Monday, April 27, 2026

April 27th Severe Storms - A Satellite Analysis

A large-scale, multi-state severe weather event is unfolding across the Midwest and Ohio River Valley, extending down into the Mid-South region. With a broad warm sector and CIN dwindling, the first focus was to watch for any discrete cells out ahead of the front that would pose an all-hazards risk. To get an idea of where the best moisture is and where any gradients between dry/moist air exist, I utilized the 4-panel that shows modeled GeoXO data vs GOES-19 imagery. This imagery did a great job highlighting the areas of best moisture and showed a clear distinction in dry vs moist air.


Figure 1: 4-panel layout comparing GeoXO Synthetic data (top) vs GOES-19 obs (bottom)

For monitoring potential discrete CI in WFO PAH’s area today, we utilized the CONUS OCTANE Cloud Top Cooling product with LightningCast ABI+MRMS overlaid. As we watched the cap continue to erode through the afternoon, I noticed “popcorn” like cumulus developing that exhibited rapid vertical motion as detected by the OCTANE satellite imagery. Most of the activity that started to develop, though, quickly fizzled out due to the cold front being so far behind. Still, this was an interesting observation and a utility I find very useful for DSS operations. Outside of our area of interest, we got to watch how rapidly discrete cells developed south of Kansas City, and learned that there is a correlation being studied between how cool a cloud top gets and how instability exists in the environment.


Figure 2: Left Image: 18:32Z, Right Image: 19:22Z

We also learned today that we can analyze low-level winds with the OCTANE Speed/Direction sandwich. For the WFO PAH area, we observed more directional shear with low-level turning of winds. In this instance, I turned off the Speed layer and only had the Direction layer selected. This highlighted the area where low-level shear was greatest.

-simoom

Lightning Cast V1 vs V2

LightningCast version two highlighted an area of towering cumulus as having a greater probability of producing lightning when compared to version one (30% vs 10%). Later on, version one caught up with version two, highlighting the same area, with both versions increasing to 70% (not pictured). However the signal showed up well in version two about 20 minutes ahead of version one.


 Figure 1: GOES flash extent density, 1-min lightning plot, cloud phase distinction, and Lightningcast v1 (left)/ lightning cast v2 (right). Valid at 1930 zulu


Figure 2: GOES flash extent density, 1-min lightning plot, cloud phase distinction, and Lightningcast v1 (left)/ lightning cast v2 (right). Valid at 1950 zulu.

-WXboi

Satellite, Satellite, Satellite


Warm Sector and no Synoptic Forcing: Paducah Kentucky Edition

We started today with a very established capped warm sector. Dewpoints were in the upper 60s and low 70s across the CWA. MUCAPE values were in the 2000 to 3000 J/kg range with 0-1 km SRH around 250 m^2/s^2. The thermodynamic parameters had started off well, but an early afternoon filled with cumulus clouds may spoil the convective threat. None of the warm sector convection never had gotten a chance to get started, there were glimpses of potential, but would quickly fizzle out. This will change quickly into the evening as the cold front moves across the region, but it is out of the “operational period”.

Vertical Wind Profiles:

With much quieter weather this afternoon than anticipated, we were able to deep dive the various uses of OCTANE. One of those is looking at the vertical wind profile. At the 0-3 km layer there is consistent south-southwest motion, while the 3-6 km layer is moving west-southwest. This analysis allows us to create a sense of ground truth that we are able to compare with models.

Figure: Here in this image we have low clouds that are identified as this more brown color, while the higher clouds are in the green. In motion these clouds have a well defined hook vertical wind profile with the lower layers moving south-southwest and the higher layer moving west-southwest.


Figure: Here is the 22z RAP model hodegraph for the convection southeast of Marion in the previous figure. This paired with the satellite product listed above we are to say with good confidence that in Northwest Kentucky there is a well defined hooking hodograph.

Final Thoughts:

For a day filled with a firehouse of new techniques they all stood out with their uses. The common theme for me is confidence in the models and also the ground truth. Each of the techniques we were shown helped to build confidence in either direction. It will be interesting to see how effective these techniques are, when in a more normal “operations” setting filled with time and workload constraints.

 -Blizzard

Overview: Week 1, Day 1

9AM

Welcome to the testbed! Day 1 is usually when forecasters are just getting their feet wet with the products, but today they may get thrown into the deep end. The 13Z SPC Outlook features a Moderate Risk and large Enhanced-Slight Risk through the Mississippi Valley, driven by a 15% CIG2 threat. Forecasters will mostly be getting familiar with products and using AWIPS in cloud instances, but hopefully they will have plenty of good storms to observe today! Unfortunately we're having issues getting the Lighting Stoplight tool into AWIPS, and it was only available online today.


1PM

We localized to Paducah, KY (PAH) and St. Louis, MO (LSX) with the expectation that semi-discrete thunderstorms would develop during our operations period. Unfortunately thunderstorms took too long to develop for PAH, but there was plenty of thunderstorms to the west across Missouri and north towards Illinois and Indiana.

We observed low level dry air from the Synthetic GXI data from a front and dry line that passed through western Oklahoma. It was interesting to compare the synthetic data from WVT and low(est) level water vapor at 5.15 µm against the observations from GOES-R in the split window difference and visible imagery at 0.64 µm. Some questions for the forecasters included how easy it was to identify features and boundaries in this clear-cut and more strongly forced scenario.


4PM
Later in the day our group also had a discussion about extremely large flashes as detected by GLM and the ground networks, and how (or if) they could be interpreted by products such as LightingCast or the Lighting Stoplight tool. Could LightningCast add lower probability contours? Would those contours add to noise and too many false alarms? How sensitive should users be to the appearance of probabilities?


6PM
To end the day, I saved off some animations of the SZA products. I tried adjust the Day Cloud Phase Distinction RGB recipe when including the Channel 2 and 5 SZA bands, so we will see how forecasters react to that product.


Kevin


Friday, April 24, 2026

2026 Satellite Proving Ground HWT Experiment Preview

It's that time of year again! The Satellite Proving Ground Experiment in NOAA's Hazardous Weather Testbed (also known as the 'Satellite HWT' for short) returns for its...hold on let me count...17th year! This year's testbed features an exciting combination experimental satellite products that push the bounds of GOES-R capabilities for severe weather warning and decision support applications, along with looking ahead to the future of GeoXO.

Volunteer NWS forecasters will use five experimental satellite products to issue severe weather warnings and provide decision support in a simulated format that leverages live, realtime weather. The testbed will operate for 12 days spread across the following weeks...

  • April 27 – May 1
  • May 11 – May 15
  • June 1 – June 5
Here's a preview of the five satellite products we'll evaluate this year...

LightningCast v2

Version 2 of ProbSevere LightningCast uses satellite imagery and radar data to provide the probability of lightning within the next hour. The first version of LightningCast only uses satellite data, and the new information for the machine learning model is expected to improve lightning forecasts. LightningCast probabilities are also available for static and on-demand locations to NWS forecasters, providing key information when providing decision support.


Lightning Stoplight v2

Forecasters get not one but two lightning-related products this year, with NASA SPoRT's Lightning Stoplight product. Geostationary Lighting Mapper (GLM) and Earth Networks Total Lightning Network (ENTLN) flashes from the past 30 minutes are color coded by the time since their last flash, with 0-10 minutes (Red), 10-20 minutes (Yellow), and 20-30 minutes (Green) as their bins. Forecasters will demonstrate the ability of the Lightning Stoplight tool to monitor lightning hazards and inform partners who need to make the 'all clear' decision.


OCTANE CONUS

The Optical flow Code for Tracking, AMVs, and Nowcasting Experiments (OCTANE) is not just a cool acronym, it uses satellite imagery to provide high-resolution cloud-top winds. Features such as divergence and cloud-top cooling can help forecasters anticipate thunderstorm formation and intensity trends. Forecasters in previous HWT experiments used OCTANE winds from ABI Mesoscale scene data, and this year OCTANE's suite of products will be evaluated on the ABI CONUS scene.

One more thing...how would you like an ABI Mesoscale scene anywhere across the CONUS? OCTANE's MesoAnywhere product provides synthetic 1-minute imagery from ABI CONUS scene data, tracking cloud motions and propagating them forward in time.


Synthetic GXI Imagery

Following the GOES-R series of satellites is GeoXO, expected to launch in 2032, will usher in a new era of satellite imagery including two new bands targeting atmospheric moisture. Synthetic GXI imagery has been derived from the HRRR model, giving forecasters a 'first look' at this imagery and the ability to explore its applications. More water vapor observations from satellite can help to monitor boundaries like dry lines, fronts, and sea breezes.


SZA Imagery

Satellite imagery that relies on reflectance from the sun (Channels 1-6) can be modified for its sun angle (aka the solar zenith angle) so images are dynamically brighter, especially before sunset, after sunrise, and at higher latitudes. This year ABI CONUS channels 2 and 5 are adjusted by their local solar zenith angle, and forecasters will evaluate how useful this type of imagery can be compared to traditional satellite imagery.


Continue to follow along as our forecasters write blog posts, and I hope to provide daily updates of all the places we visit as we 'roam' the country. Happy forecasting!

-Kevin, SPC/HWT Satellite Liaison


Wednesday, July 30, 2025

Lightning under thick ice

 Just documenting another case of LightningCast improving predictions of lightning under thick ice, where ABI can't "see" the convection. Storms were diminishing in southern Wisconsin and northern Illinois during the morning of July 29, but there was still a lightning threat, which LCv2 (ABI+MRMS predictors) correctly highlighted whereas LCv1 had much diminished probabilities. 


Figure 1: Animation of LCv2 probabilities (contours, left), LCv1 probabilities (contours, right), GOES-19 ABI Ash RGB (background), and GOES-19 GLM flash-extent density (foreground blue pixels).

We see that MRMS Reflectivity at -10C, a predictor in LCv2, showed pockets of ≥ 35 dBZ in southern Wisconsin, indicative of a lightning threat. Without the reflective bands in ABI contributing much at this time in the morning, the Reflectivity at -10C was impactful at correctly elevating lightning probabilities from about 09:30 to 10:20 UTC.

Figure 2: MRMS Reflectivity -10C at 10:00 UTC


Monday, June 16, 2025

LightningCast v2 performs better with thick ice obscuration

Here is another example---this time in western Wisconsin---where LightningCast v2 (LCv2) outperforms LCv1.  The models are trained to predict the probability of next-hour lightning, with LCv1 using ABI inputs and LCv2 using ABI and MRMS inputs.

There is thick ice obscuration from an anvil could blow-off entering western Wisconsin, south of La Crosse. Both models had about 10% probability of lightning 20 minutes prior to the first flashes (not shown). Fifteen minutes prior to the first flash, LCv2 shot up to 50% probability of lightning, whereas LCv1 hovered near 10% (top row, Figure 1). LCv1 exceeded 50% 5 minutes prior to the first flash produced by the multi-celled convection (not shown). 

The MRMS Reflectivity -10C in LCv2 (Figure 2), which observed 35-dBZ pixels in the convection, together with ABI signatures (e.g., cold cloud tops, nearby boundary layer cumulus) was able to provide an additional 10 minutes of lead time to the first flashes compared to the ABI-only LCv1 model. 


Figure 1: Top panel: LCv2 (left) and LCv1 (right) contours for 6/16/2025 13:31 UTC. Bottom panel: LCv2 (left) and LCv1 (right) contours for 6/16/2025 13:46 UTC. Background on all panels is the GOES-19 ABI day-cloud-phase-distinction RGB, while the foreground blue pixels are GOES-19 GLM flash-extent density.


Figure 2: MRMS Reflectivity at -10C over the nexus of Minnesota, Iowa, and Wisconsin at 13:32 UTC. 


Friday, June 13, 2025

LightningCast v1 vs. v2 in Texas and Alabama

The LightningCast model predicts next-hour probabilities of lightning. Version 1 (LCv1) of the model uses solely GOES-R ABI inputs (C02, C05, C13, and C15), whereas the experimental version 2 (LCv2) incorporates MRMS Reflectivity -10C in addition to the four ABI image-inputs.

While LCv1 provides accurate predictions in most circumstances, LCv2 significantly improves predictions under thick ice. This case in Texas demonstrates much higher probabilities from LCv2 (left, animation below) under a plume of thick ice with very little cloud-top texture or temperature contrast. The convection underneath was likely somewhat shallow, as storm tops were not poking out from the residual thick ice, but still produced lightning for several hours. 

LCv2 (left) and LCv1 (right) probabilities (contours), GOES-19 ABI day-cloud-phase-distinction RGB, and GOES-19 GLM flash-extent density observations over north Texas and southern Oklahoma.

Meanwhile in Alabama, cumulus clouds bubbled up along what appeared to be a residual thunderstorm outflow boundary. LCv2 consistently produced probabilities 10-20% higher than LCv1 for the congestus clouds that would go on to produce frequent lightning.

LCv2 (left) and LCv1 (right) probabilities (contours), GOES-19 ABI day-cloud-phase-distinction RGB, and GOES-19 GLM flash-extent density observations over eastern Alabama.

This convection happened to develop right over Anniston Metropolitan Airport in eastern Alabama. The lightning dashboard at that site plots both the LCv1 (red) and LCv2 (green) probabilities produced by the 5-minute CONUS sector (below). We can see that LCv2 consistently held higher probabilities 10-15 minutes prior to when LCv1 achieved the save likelihood. LCv2 had an elevated probability of lightning (>30%) about 50 minutes prior to the first GLM flash within 5 miles of the airport.

Lightning dashboard for Anniston Metropolitan Airport, with LCv1 (red) and LCv2 (green) probabilities, and GLM flash rates within 10 miles (small blue dots) and 5 miles (large blue dots) of the airport.

Scientists are working to evaluate and improve LightningCast where we have good MRMS data, while maintaining good skill and first-flash lead time where only GOES is available. 


Thursday, June 5, 2025

Southwest Texas Lightning Product Performance

 Lightning, and GOES-East vs. GOES-West

Observation 1: GLM discrepancies between satellites

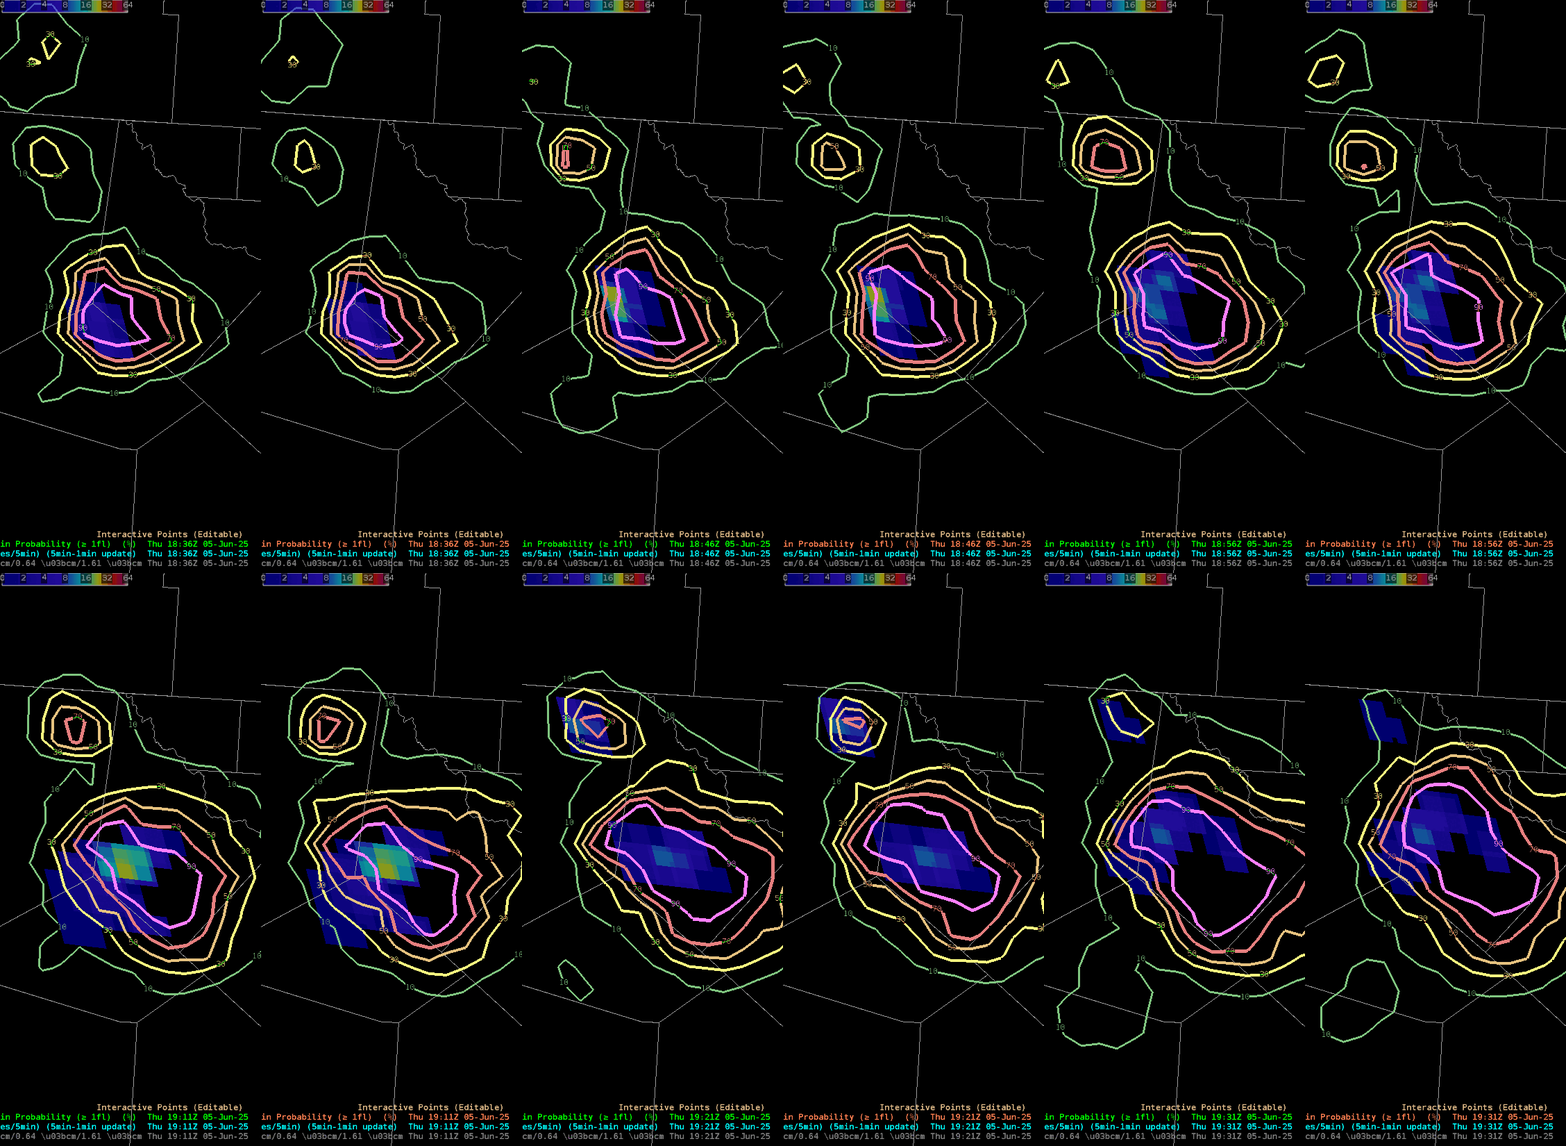
Left: GOES-East LightningCast v1 & GLM FED        Right: GOES-East LightningCast v2 & GLM FED 1836 UTC - 1931 UTC 5 June 2025 in southwest Texas

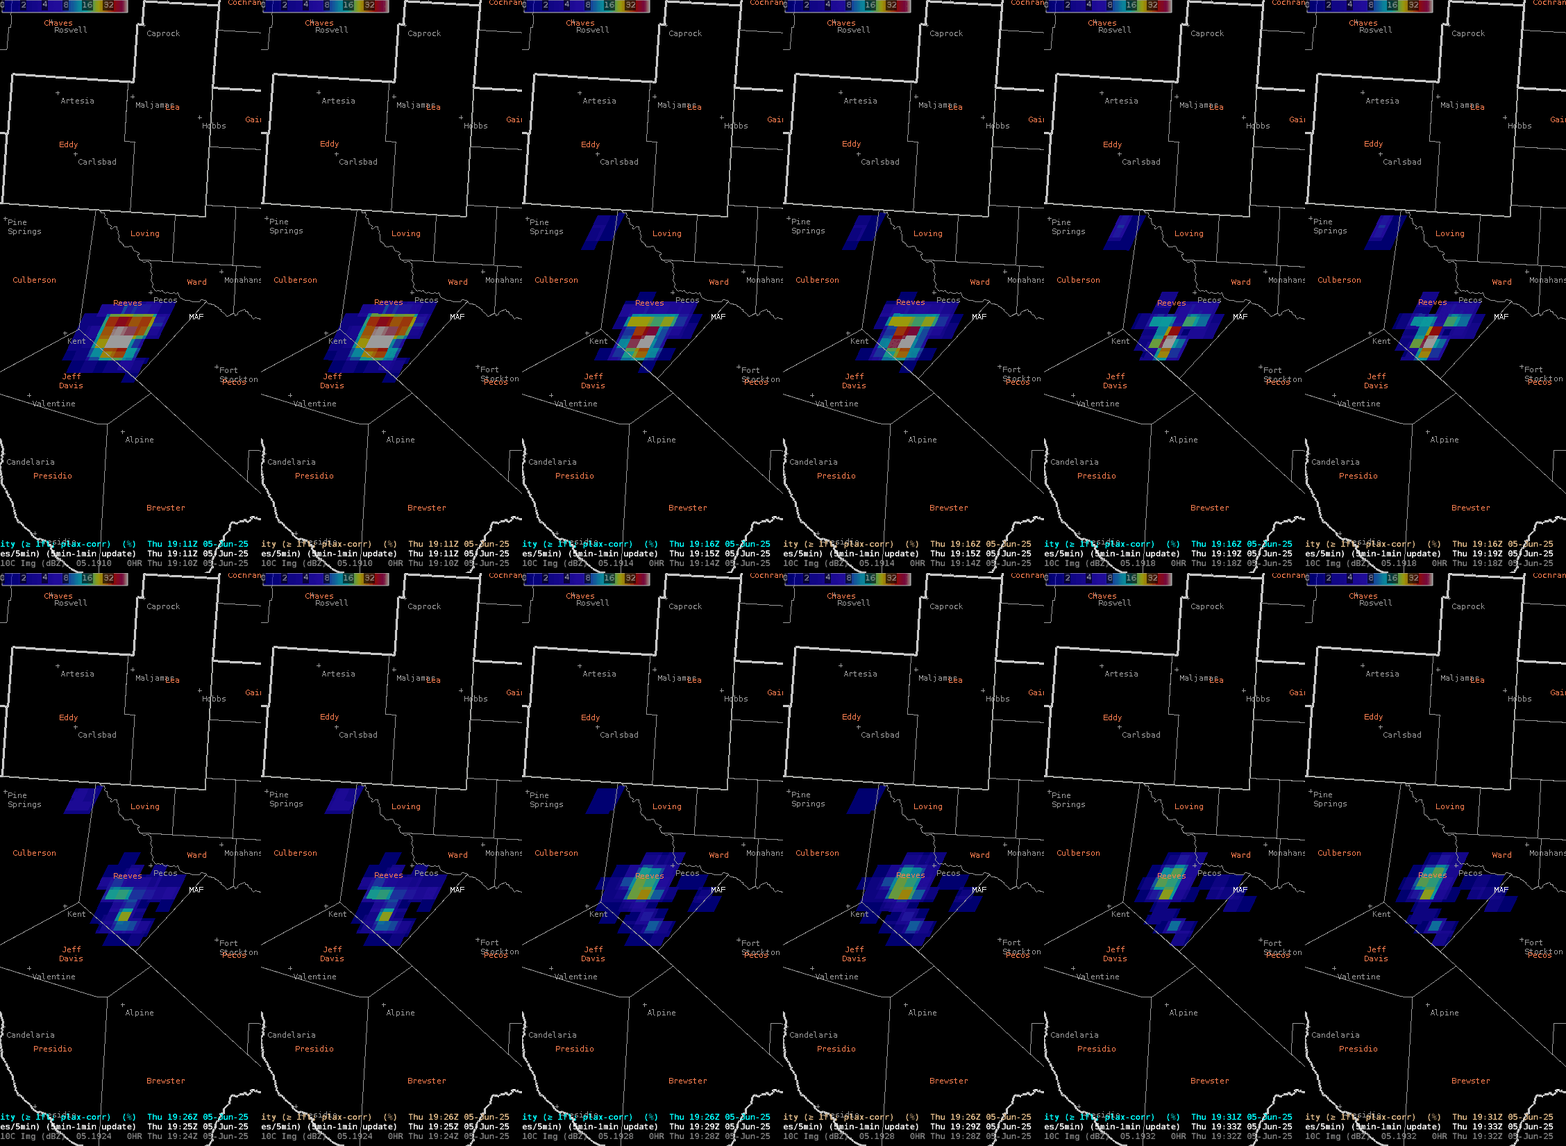
GOES-West GLM 1911 UTC - 1933 UTC 5 June 2025 in southwest Texas (LightningCast outside the domain)

The Midland-Odessa (MAF) forecast area (and nearby upstream areas in Mexico) sits in a weird position where it is well within the GOES-East CONUS domain, but on the edge of the GOES-West CONUS domain (and thus outside the CONUS LightningCast domain), yet within the GOES-West full disk domain. The above images show GLM observations in southwest Texas from both satellites, where GOES-East shows far less lightning (and a downward trend) while GOES-West showed significantly more lightning at the same time (also with a downward trend, but still indicating a stronger storm).

New Mexico and Texas Tornado Outbreak

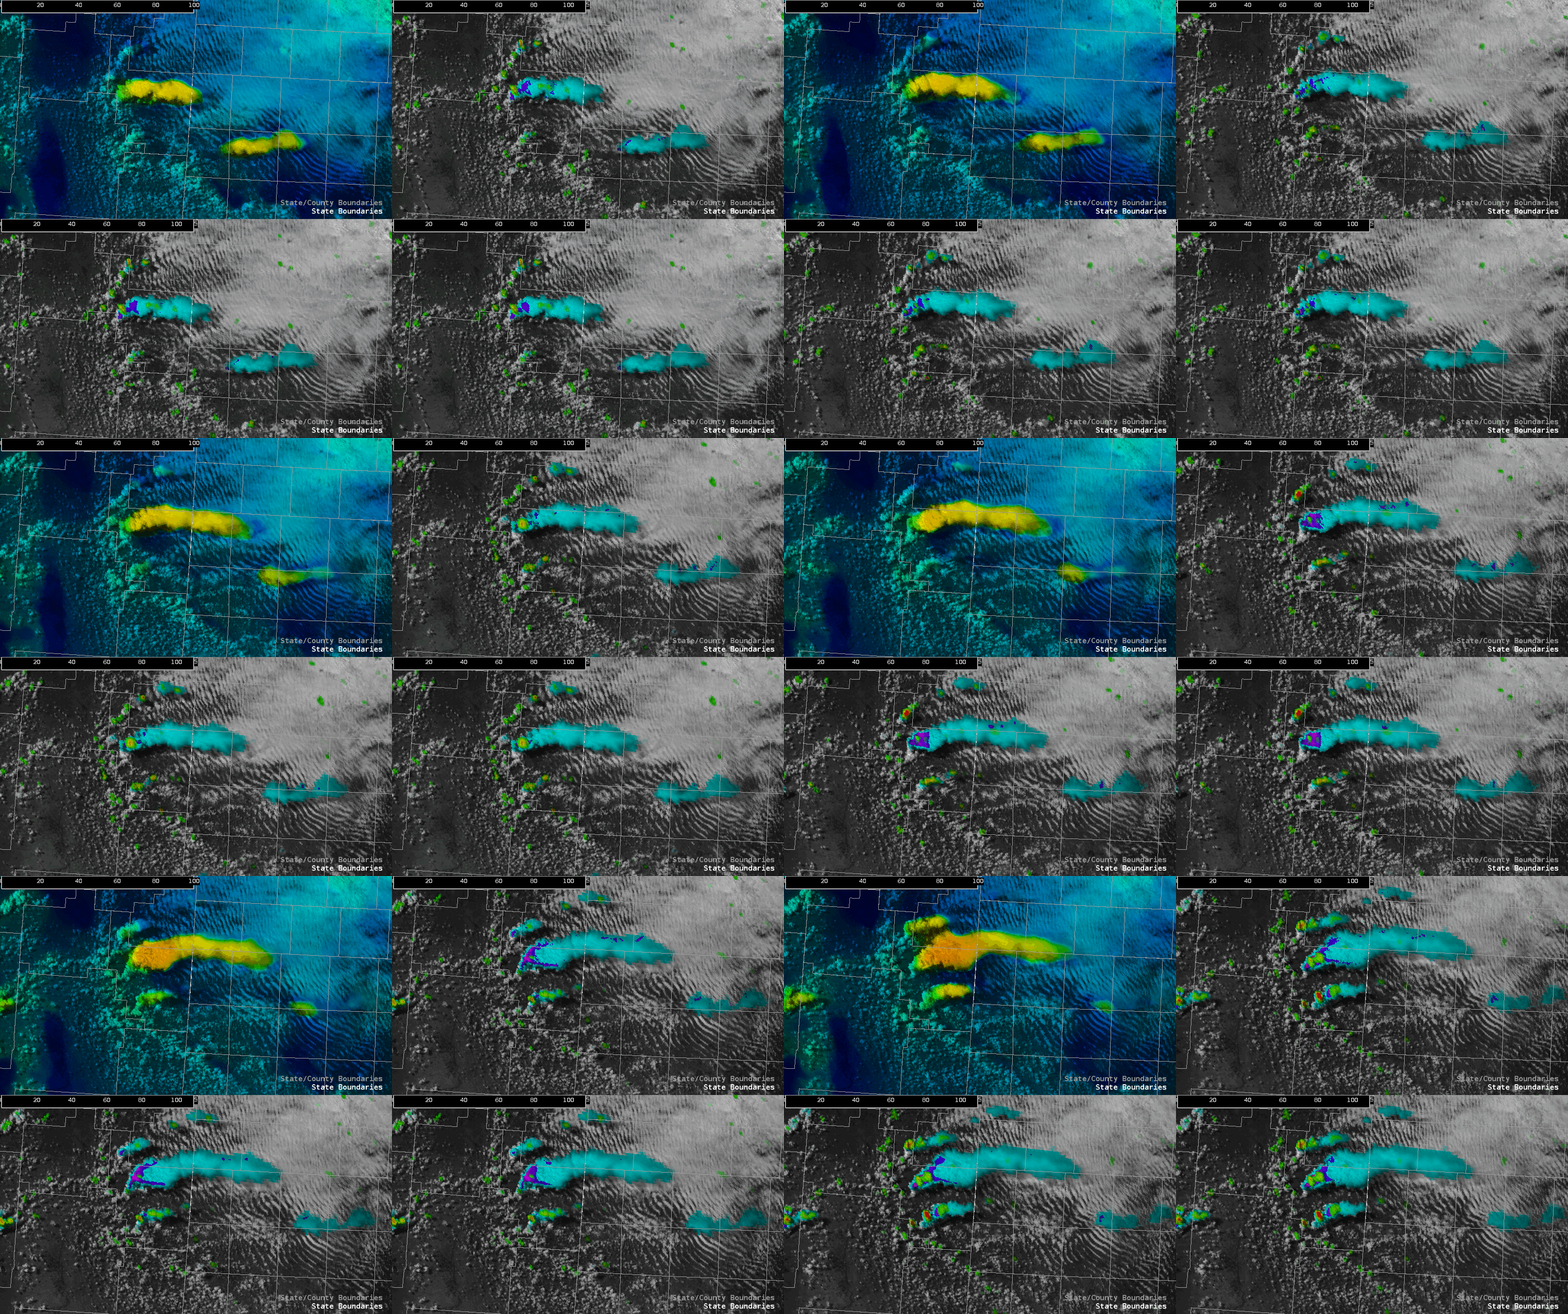
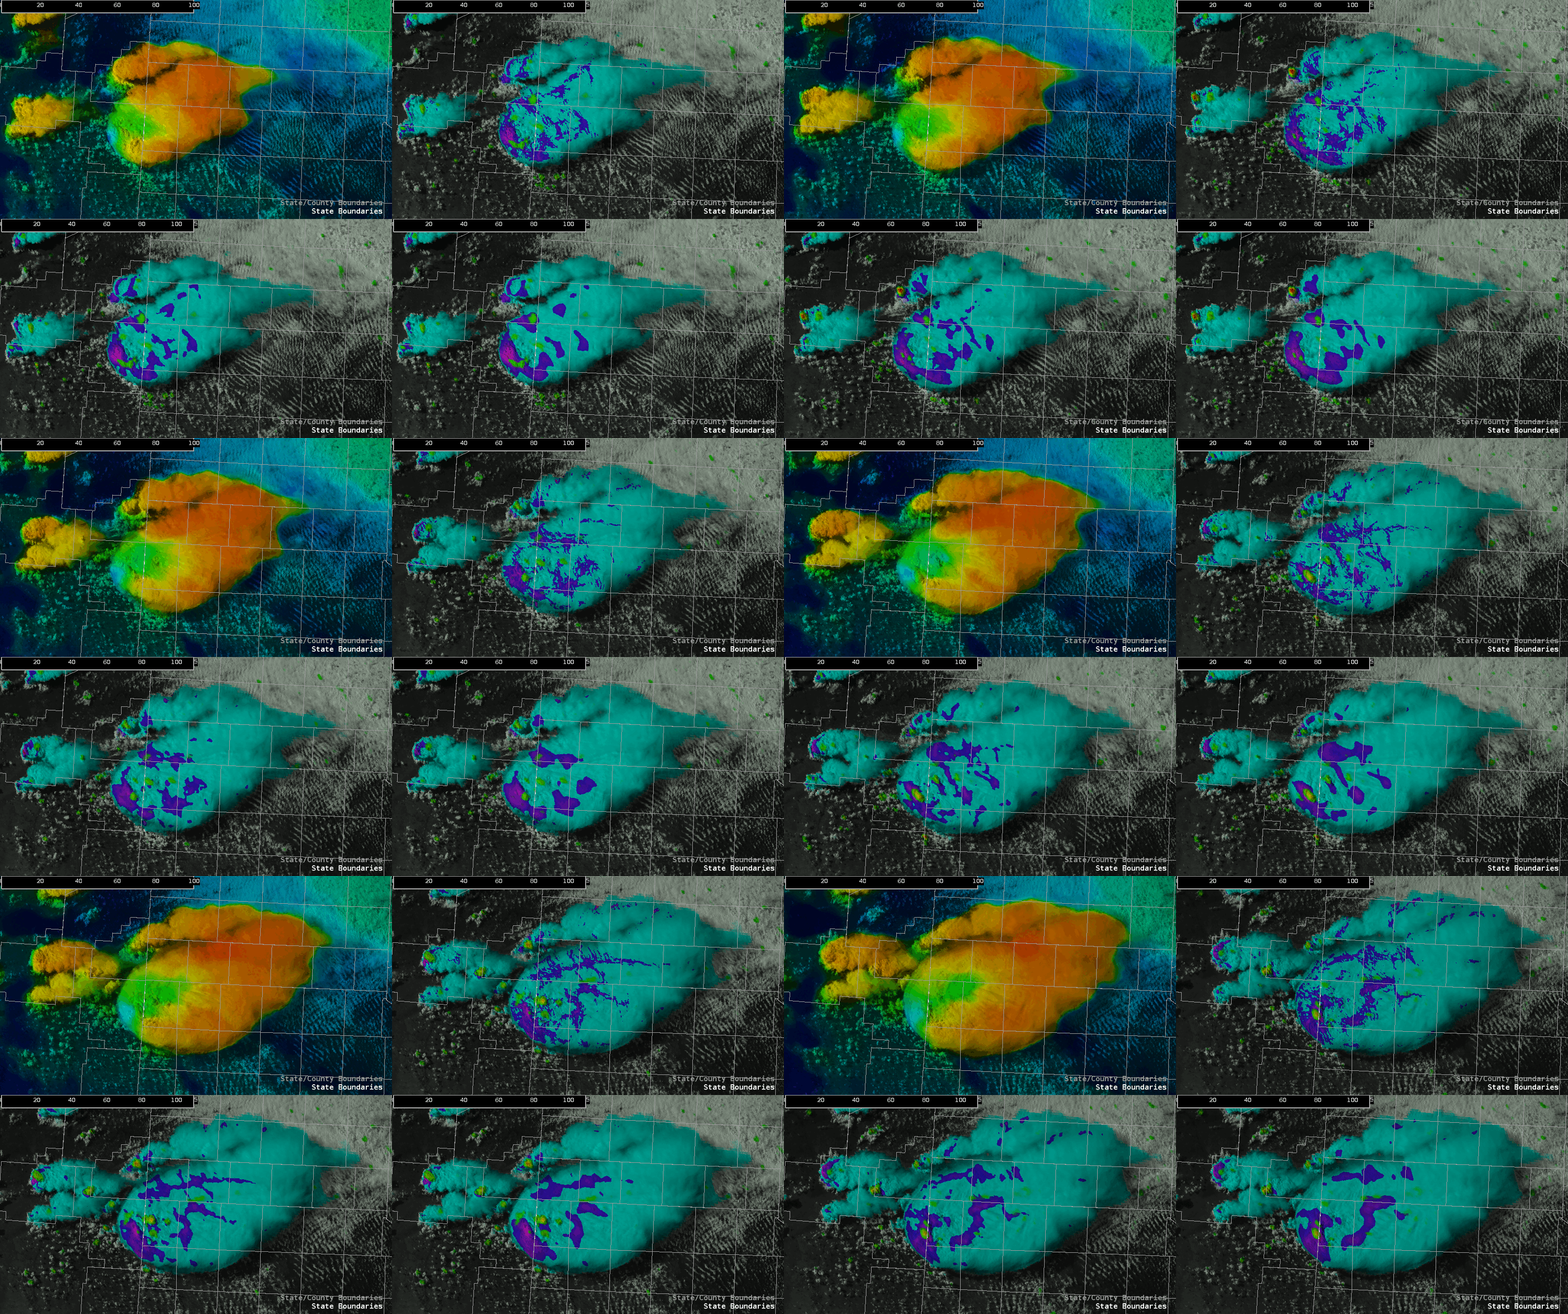
 We did warning operations today across the Lubbock TX CWA. Storms were beginning to fire up as we started, but took a while to mature. Multiple convective attempts were needed before a primary updraft took root. Seen below, is the transition from a sputtering narrow convective column to a deep mature storm. OCTANE helped pin-point this motion showing warmer/faster colors and stronger divergence.

An old outflow boundary, from yesterday’s activity across New Mexico and Texas, served as focus for convection. Soundings showed steep lapse rates through the column south of the boundary with a moist boundary layer.  North of the boundary, the boundary layer was stable as indicated by the billow clouds / undulating smooth stratus. Hodographs were long and straight, but we deduced that a tornado threat existed immediately along the boundary and perhaps a bit to the north where low-level helicity was more enhanced. We also surmised that the tornado threat would increase with time as the low-level jet ramped up and elongated the lowest portions of the hodograph.

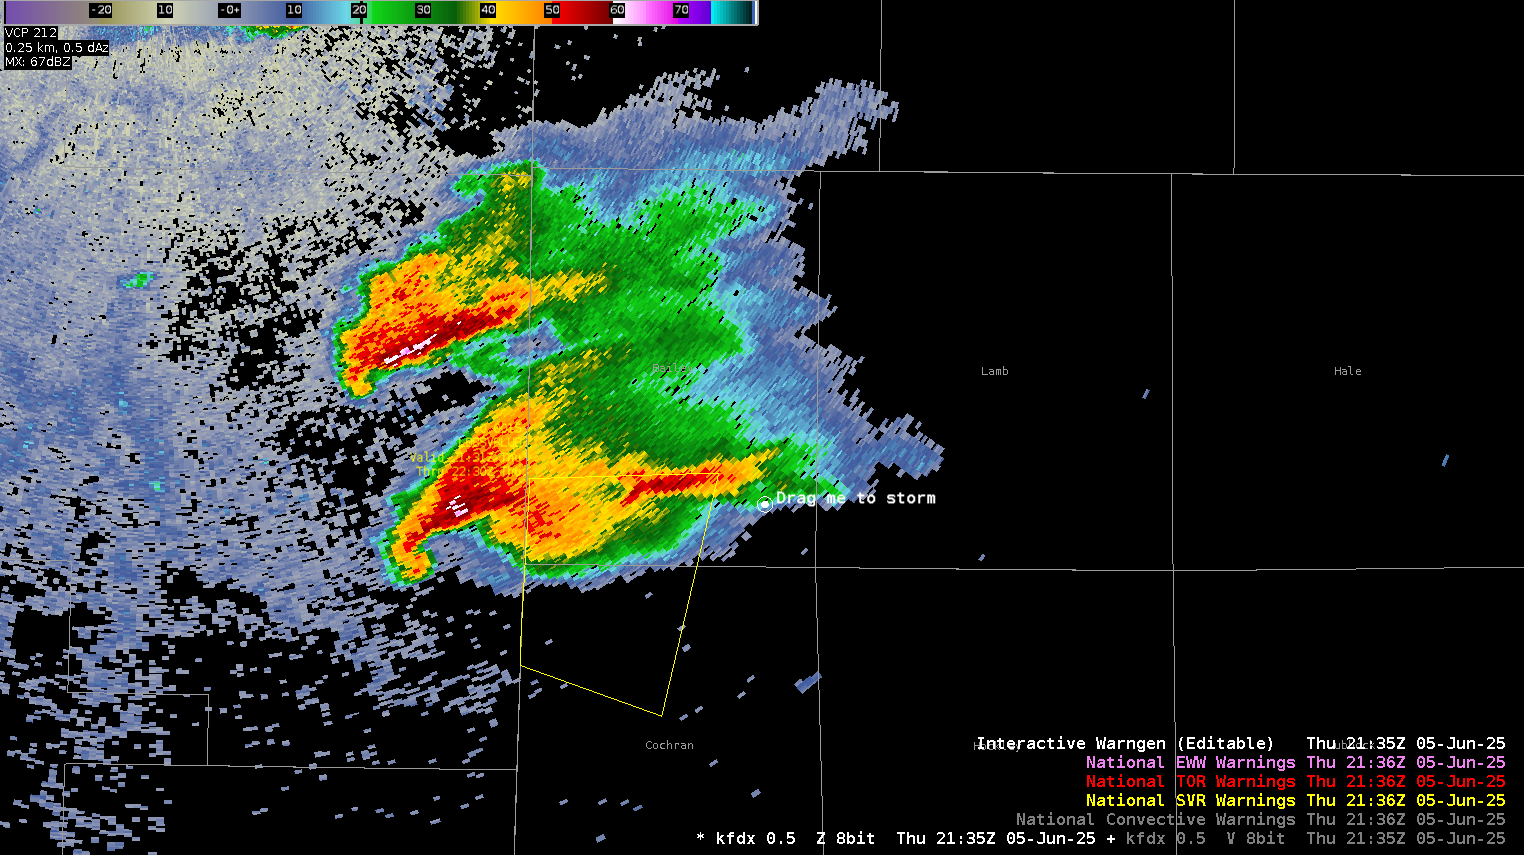
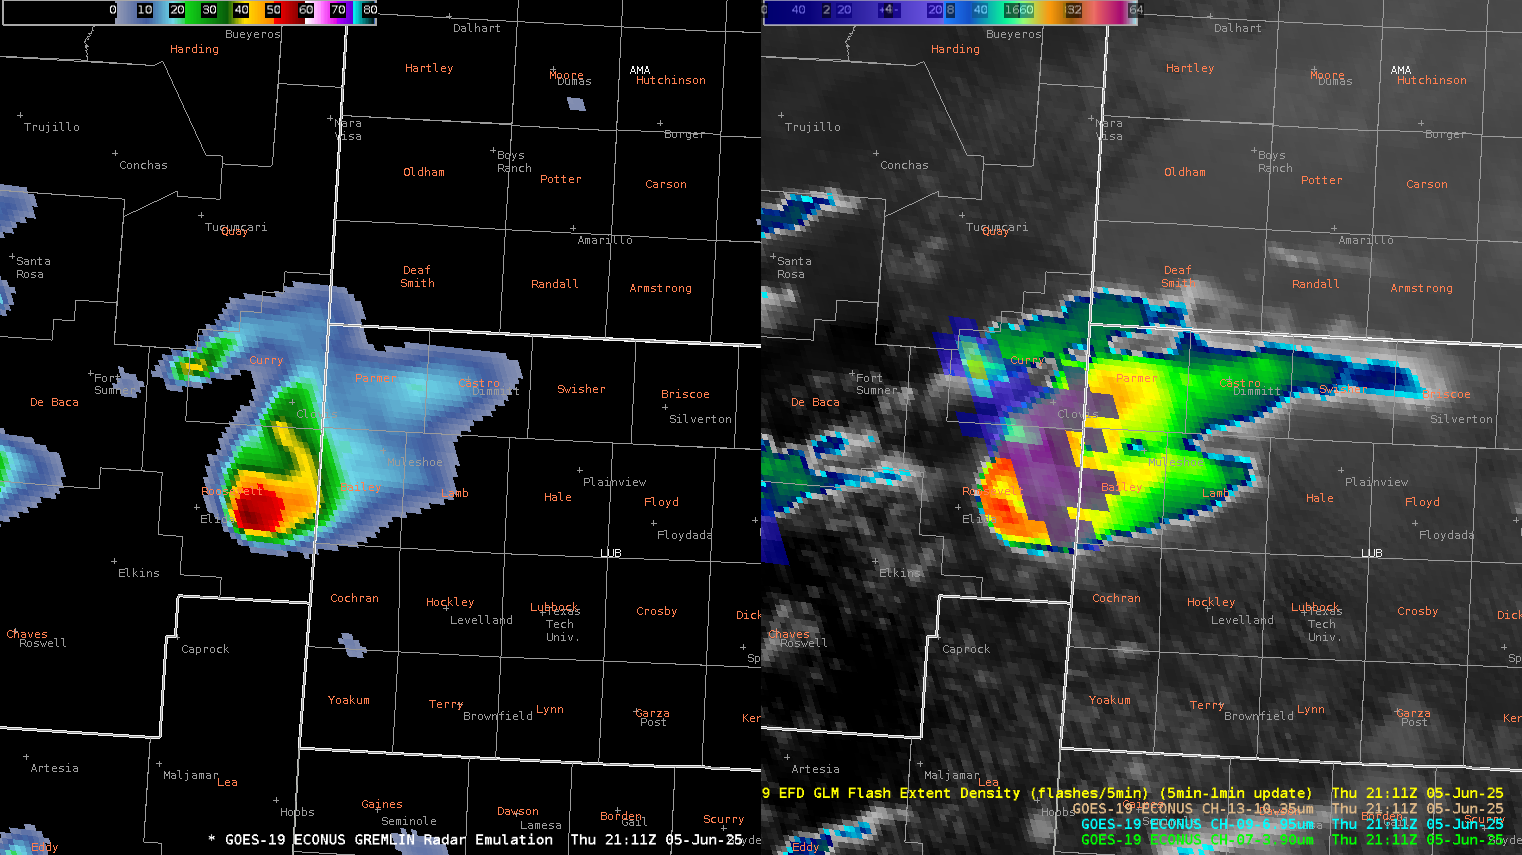
Storms were initially in ABQ’s CWA and we issued our first warning around 2130z with a duration of one hour. I heavily used storm top divergence within my warning strategy as OCTANE showed 100+ knots and radar showed 145 knots at times. Combined with a BWER to 35k ft (-20C level was 22k ft) and 50dbz to 45k ft…I went with 2” diameter hail and 70mph winds along with possible tornado. I did not go tornado warning simply because that part of the storm wasn’t close enough to our CWA yet.

It was interesting to  note that the massive anvil from each of the two supercells merged causing GREMLIN to show only one primary core. The extreme DBZ values within gremlin added confidence to the severity of the cells within the anvil. Another interesting thing is that the northern cell died down shortly after this image was captured resulting in only one primary cell reminiscent of the above image.

Towards the end of operations the now mature primary supercell showed strong divergence within OCTANE and a wake near and immediately downstream of the overshooting top, indicative of a very strong and likely severe storm.

We ended up issuing a tornado warning as the storm neared the state line, which verified as broadcast media reported a tornado just east of the Texas line. Our warning had about 17 minutes of lead time. Additionally, 1.75 to 2 inch hail reports were on the New Mexico side of the state line during the time of our SVR warning…with a 3 inch hail report coming in on the Texas side as the testbed came to an end.

Overall, OCTANE aided our warning decisions significantly…the addition of satellite-derived storm top divergence was a good confidence nudger and helped us get half an hour to an hour lead time on large hail and over 15 minutes on a tornado. LightningCast and OCTANE helped guide us toward which cell would eventually become dominant during the initiation phase.

- WxAnt