We had an interesting storm develop in a radar gap in far eastern New Mexico yesterday. This is a great case study to demonstrate the value of data fusion in ProbSevere.
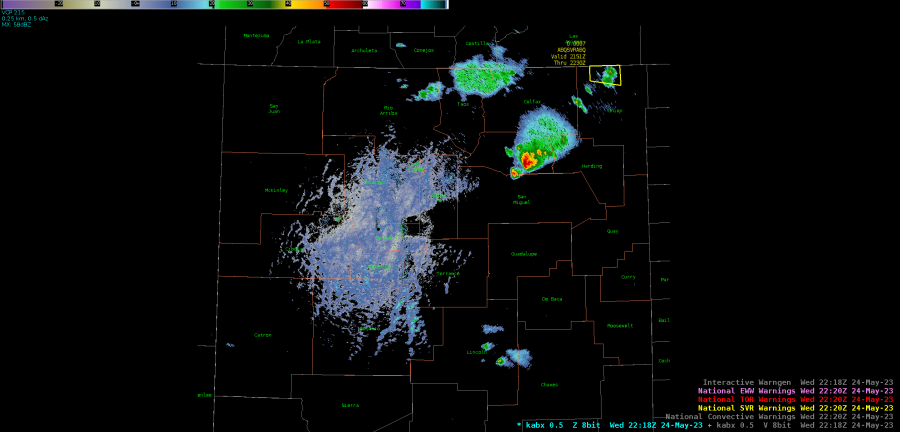
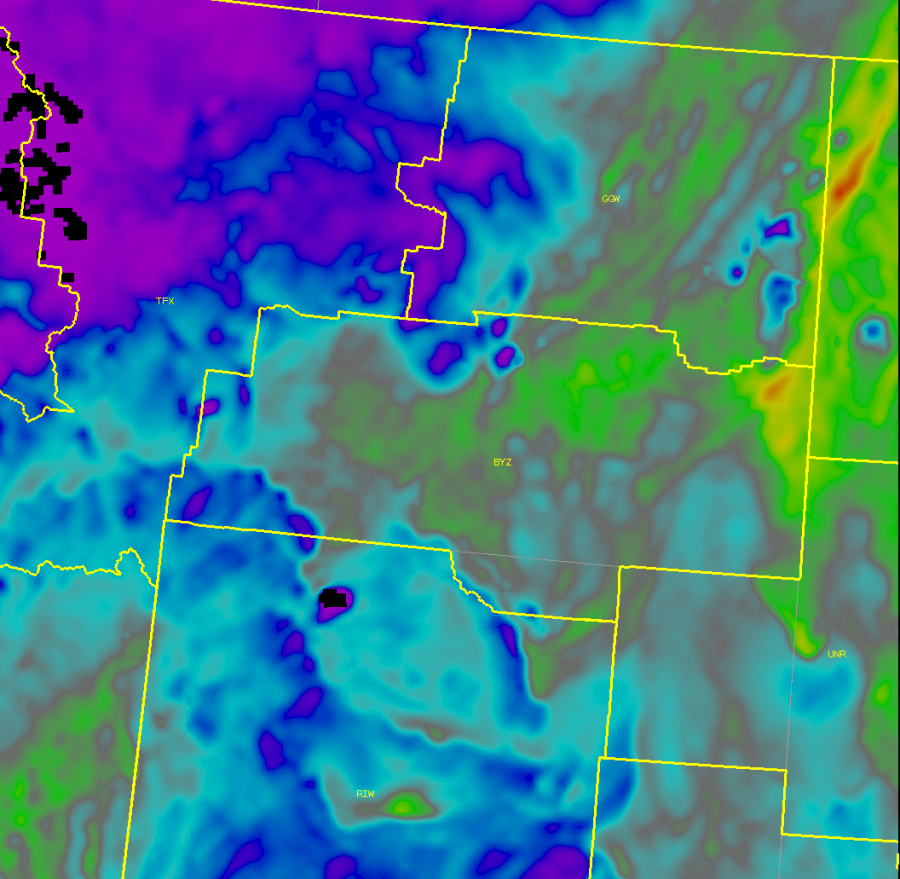
Figure 1 shows where the storm developed (the red circle), which was in a region of very poor "radar quality", as the eastern New Mexico KFDR radar was down. Thus, the closest radar was KAMA in Amarillo, TX.
 |
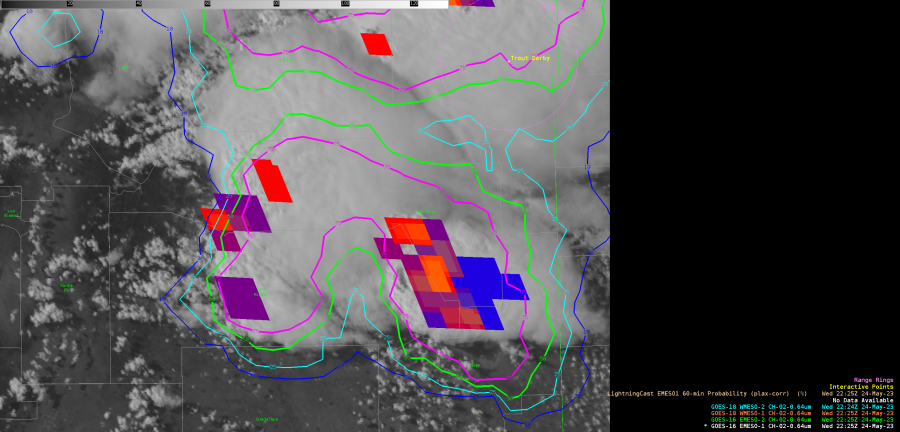
| Figure 1: Radar Quality Index for eastern New Mexico yesterday. The red circle is the approximate location of where the storm first developed. Figure 2: ProbSevere IntenseStormNet contours with GOES-16 ABI vis-IR sandwich product for a rapidly developing storm in eastern New Mexico. |
The rapidly increasing IntenseStormNet probability, along with a favorable environment, and increasing total lightning flash rates helped jump the probability of severe despite poor radar reflectivity.
As the storm moved south and east into better radar coverage, radar reflectivity increased and the probabilities of severe further increased to above 70%.
 |
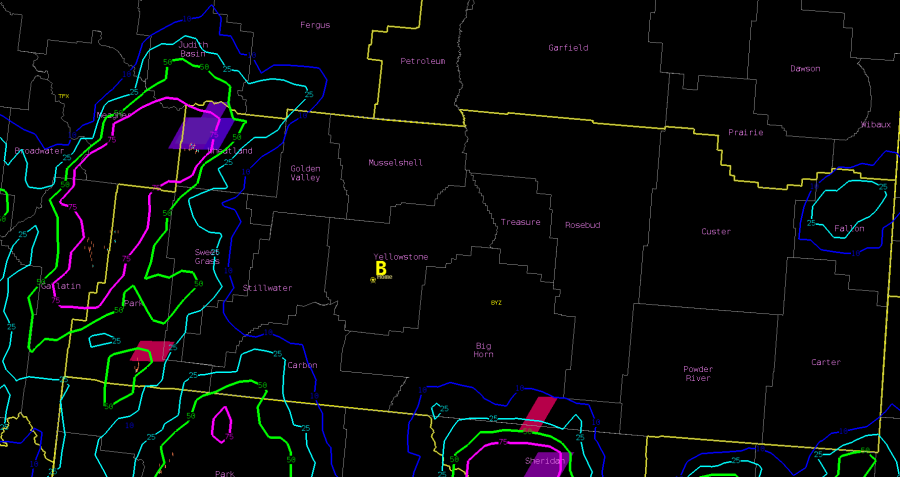
| Figure 3: ProbSevere contours, MRMS MergedReflectivity, and NWS severe weather warnings. |
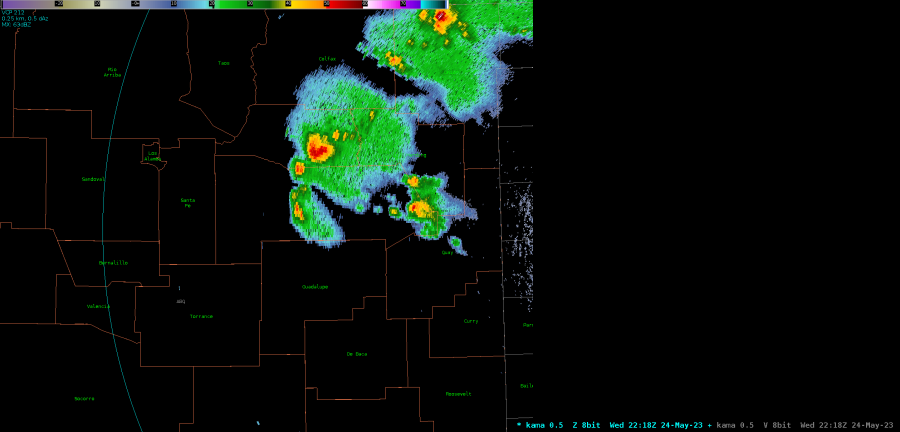
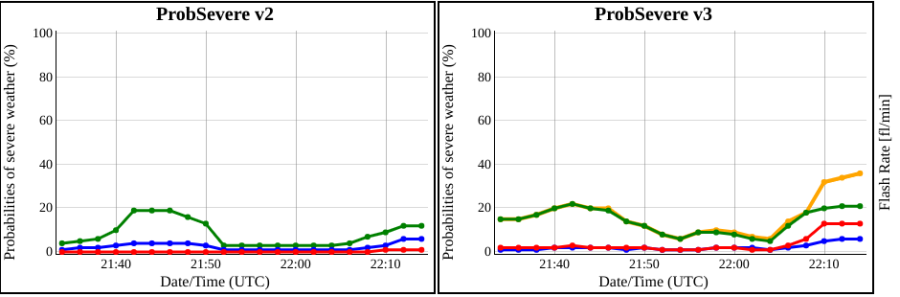
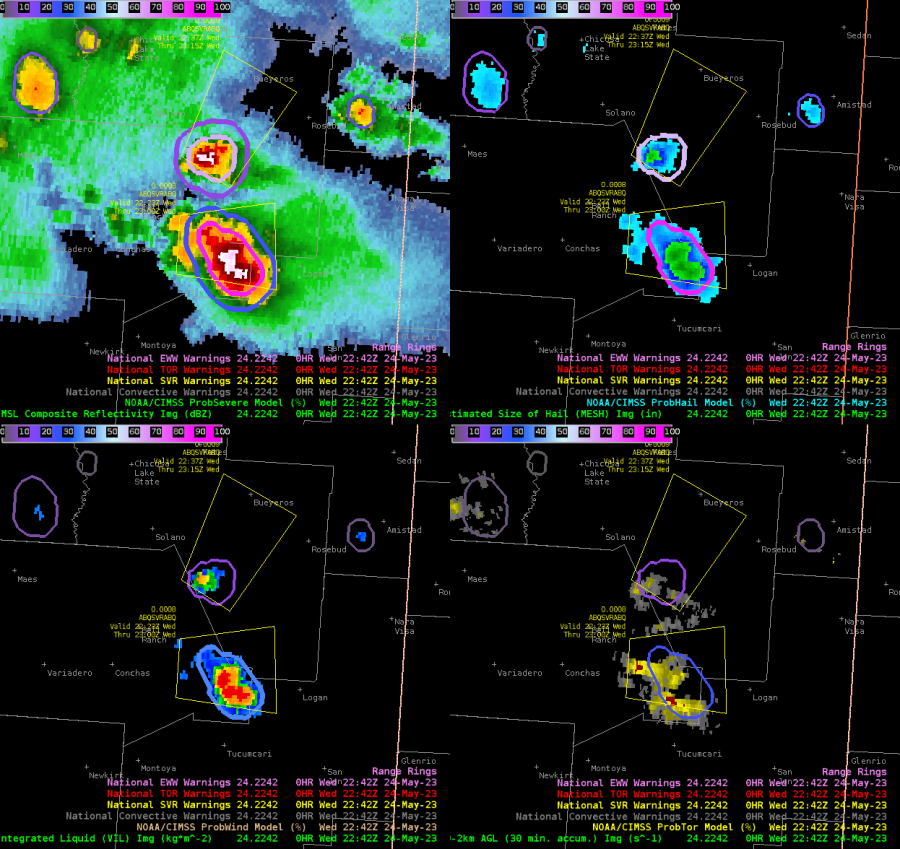
Forecasters at the HWT have noted numerous times how ProbSevere v3 has increased before v2, particularly noticeable in the regime we've experienced this week, where the storms have had a dearth of lightning at the developing stages. At the time in Figure 4, this storm had PSv3 of 36% vs PSv2 of 12%.
 | ||
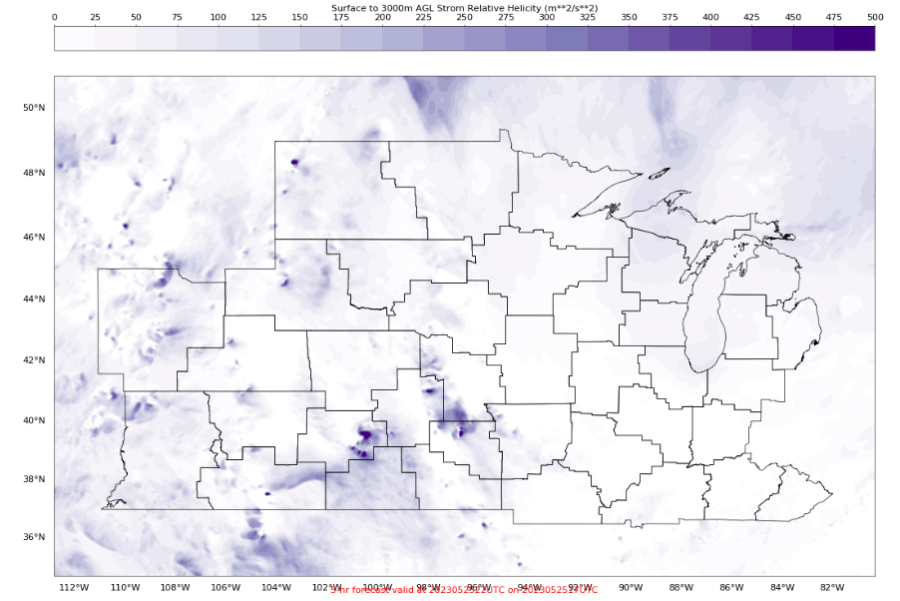
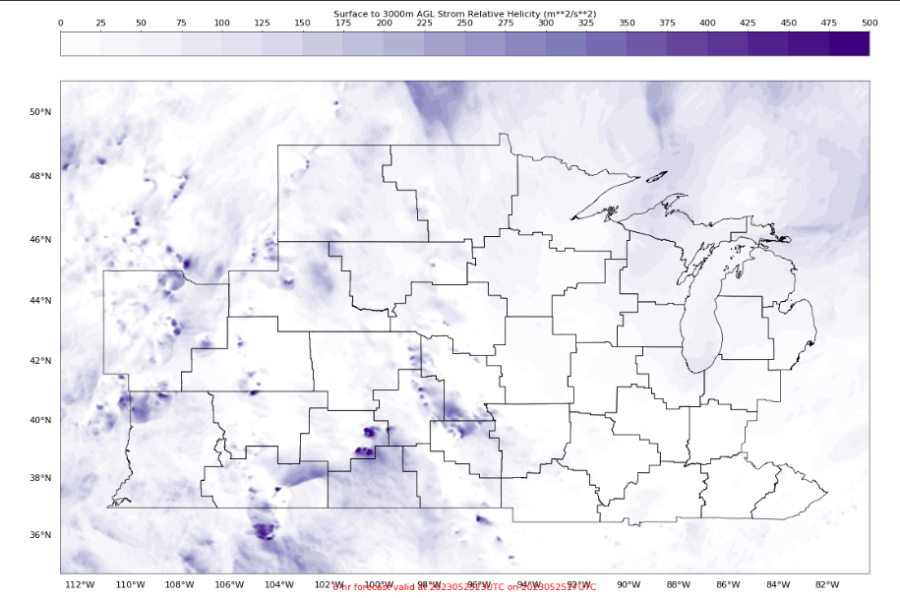
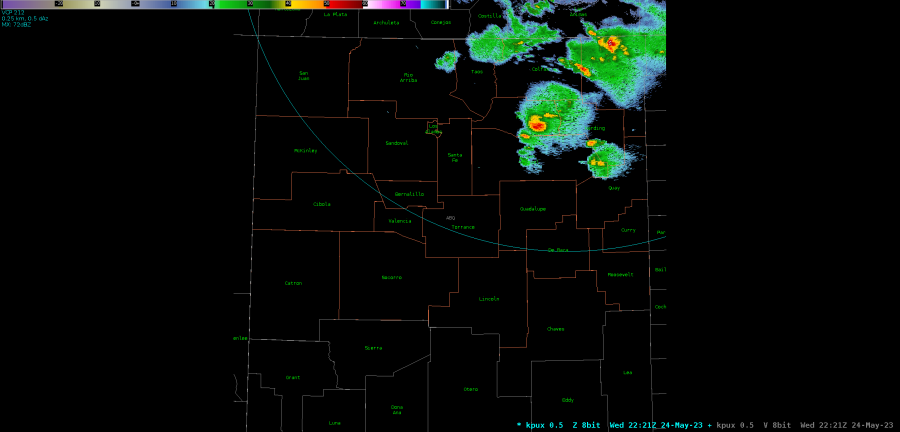
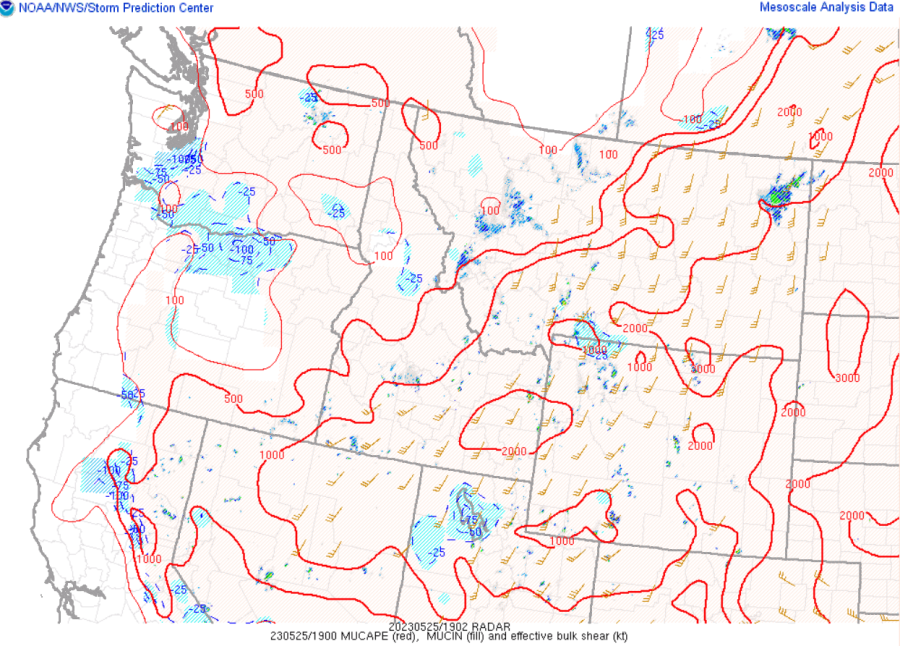
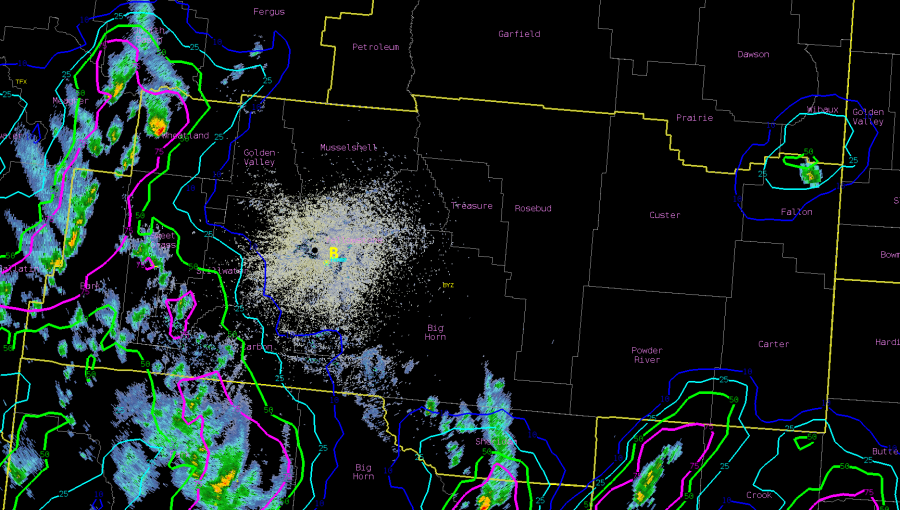
| Figure 4: ProbSevere and MRMS MergedReflectivity for a developing storm in a radar gap in eastern New Mexico. Later on, this storm produced numerous large hail, severe wind, and several tornado reports. Interestingly, the ProbTor v3 was much higher than ProbTor v2 prior to the first tornado report. In Figure 5, we can see PTv3 is 47% while PTv2 is only 9%. Looking into this deeper, we found that the environmental information such as the 0-1 km storm-relative helicity (~ 30 m^2/s^2) and the 1-3 km mean wind (~15 kt) were very low. The HRRR values in PTv3 were much better (~100 m^2/s^2 for SRH and 27 kt for the low-level mean wind). I believe this is an indication that PTv2 was too dependent on environmental information, compared to PTv2. This also demonstrates that the HRRR had a better handle on the environment than the RAP. You can see the low 0-1 km storm-relative helicity in the SPC mesoanalysis (Figure 6).
|

 |
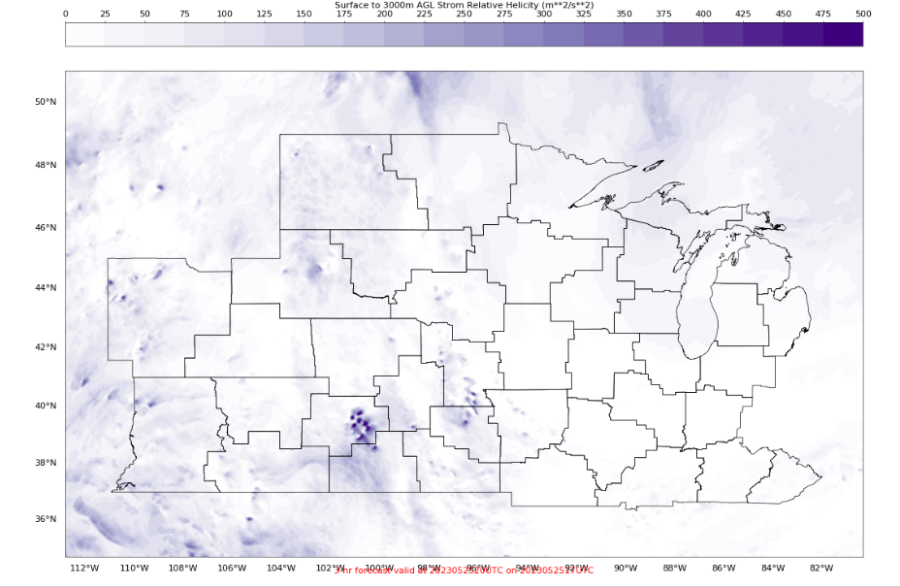
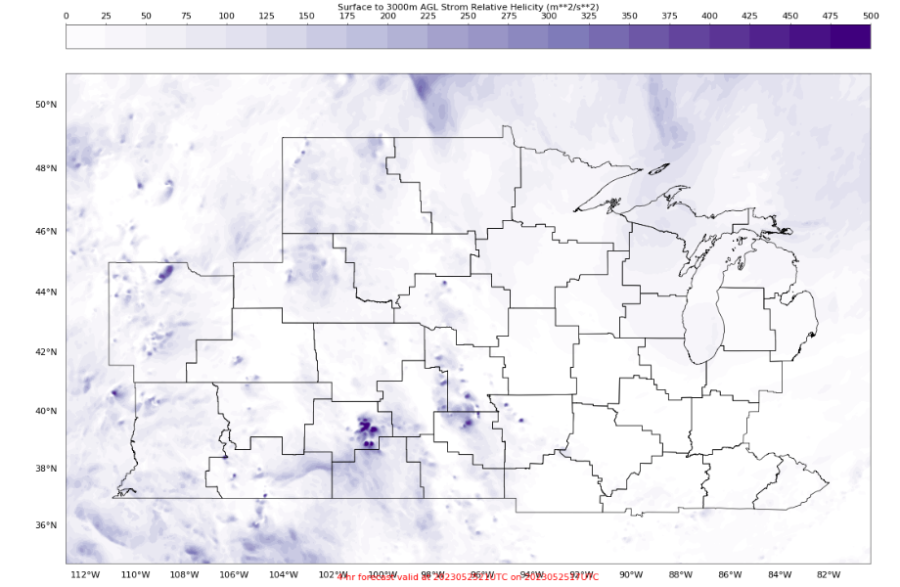
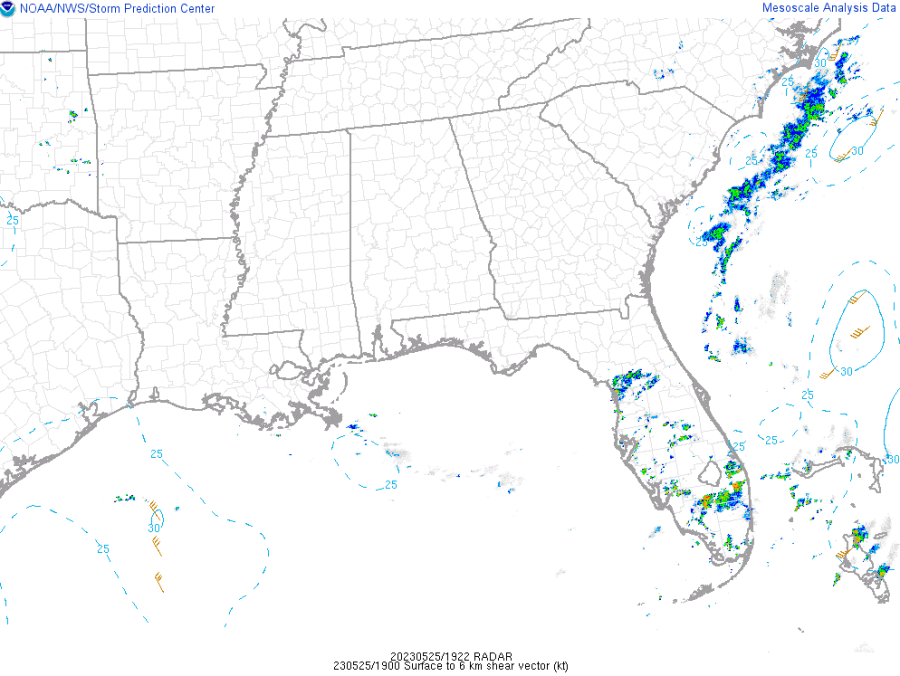
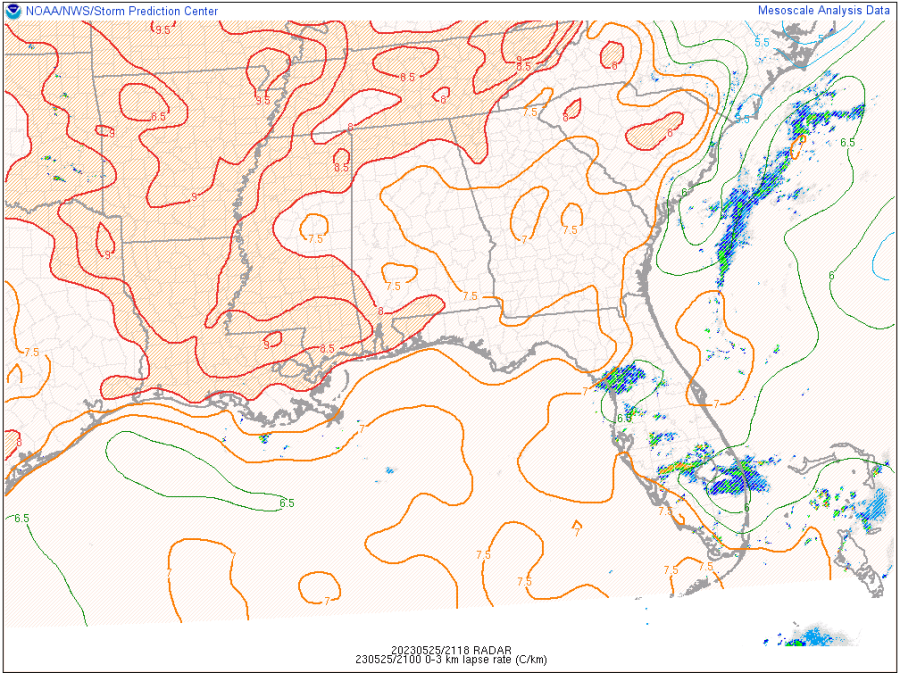
| Figure 6: 0-1 km SRH (contours) and storm motion (vectors) prior to tornadogenesis. The red circle shows where the approximate location of the storm prior to producing tornadoes. |
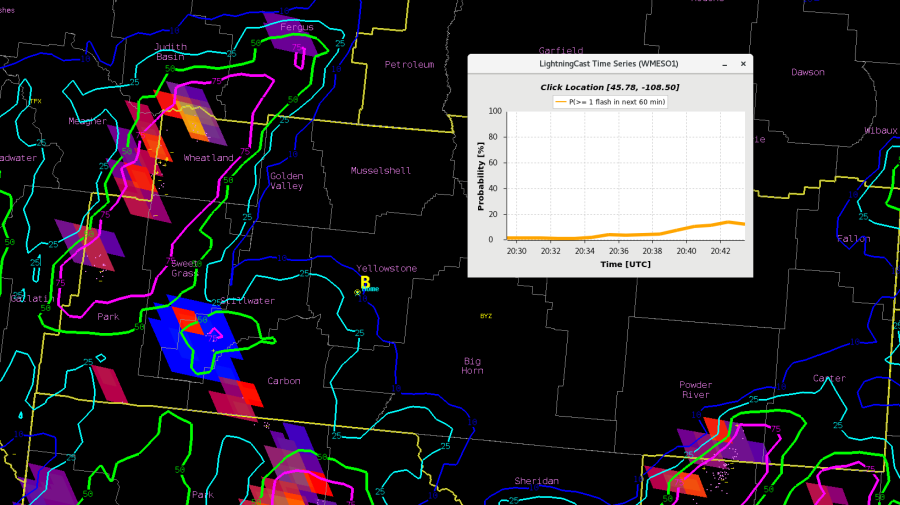
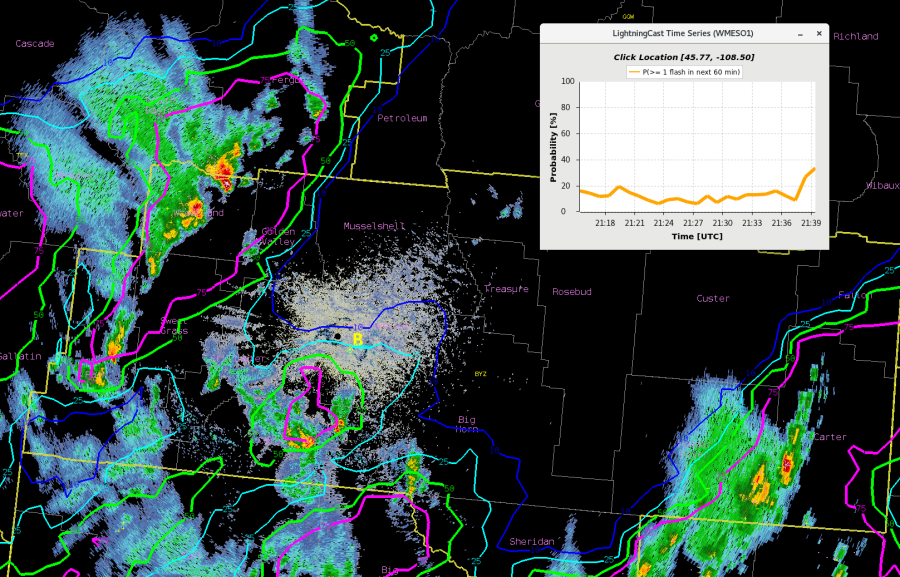
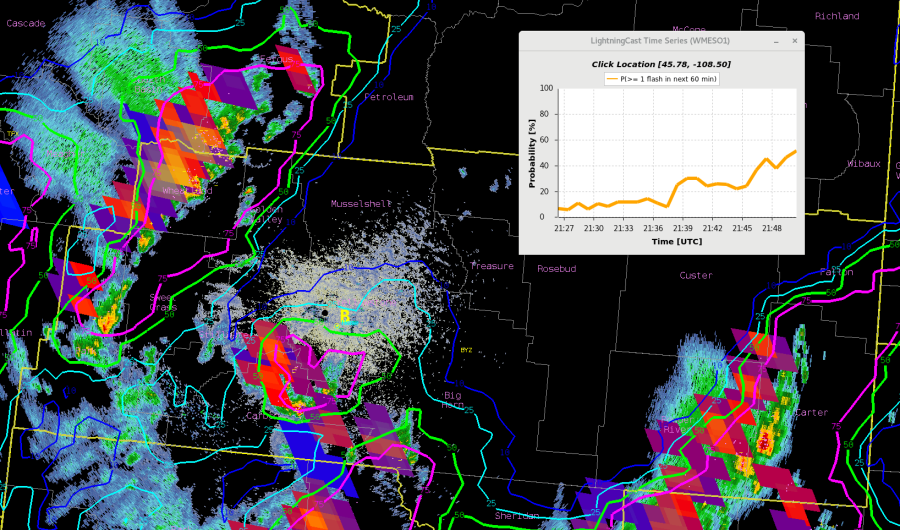
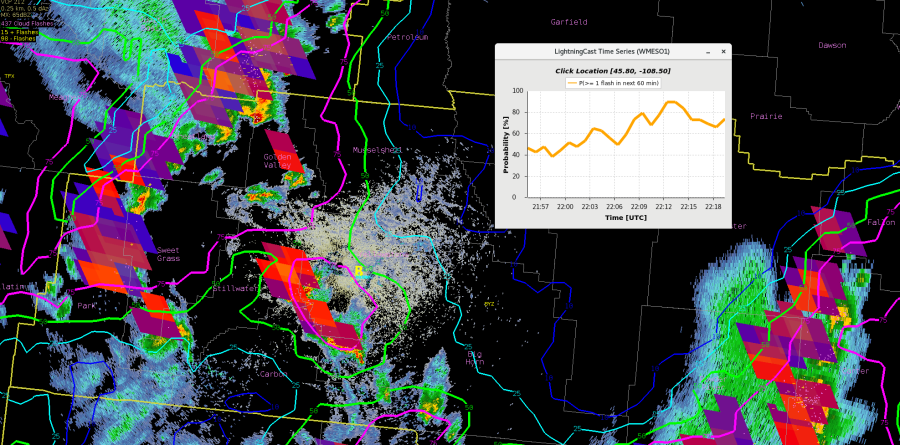
Figure 7 demonstrates how ProbTor v3 was much higher than ProbTor v2 early on. The vertical black lines in the top-left two panels represent the times of the first and last tornado reports. The interactive version of these time series have been saved off and are available here.
 |
| Figure 7: Time series of ProbSevere probabilities and radar, satellite, lightning, and HRRR attributes for the tornadic storm in Figure 6. |
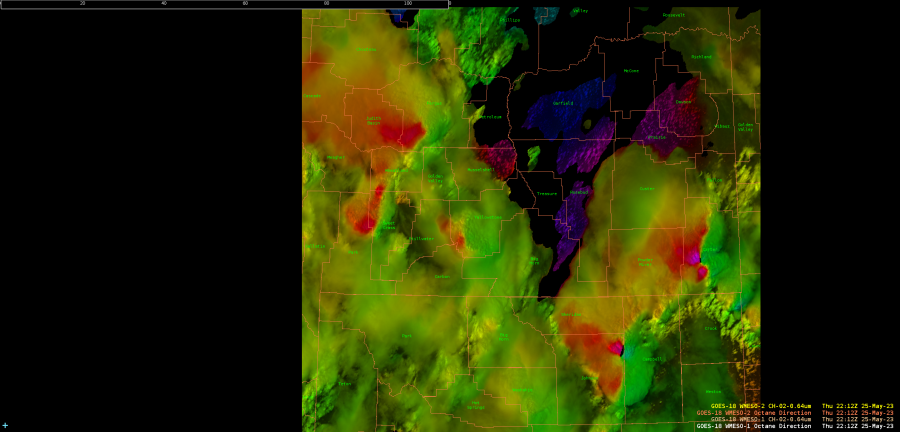
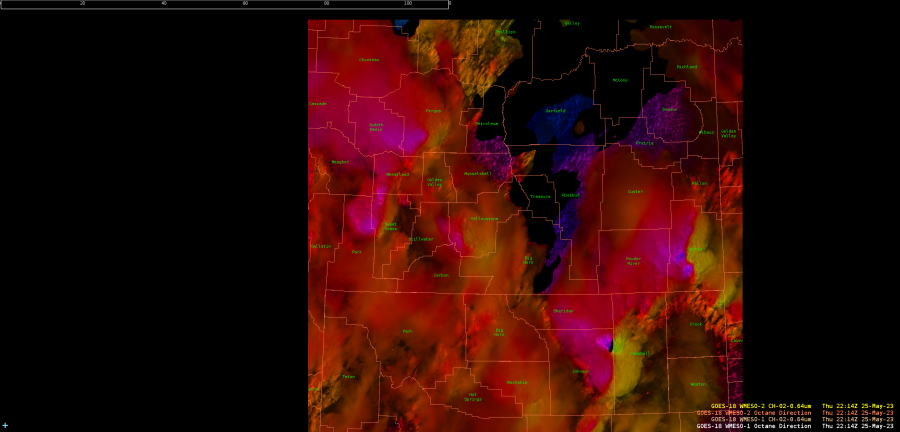
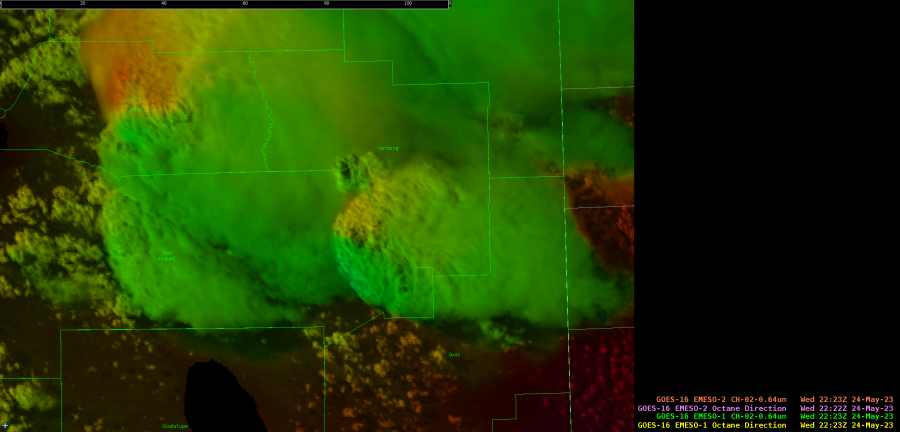 GOES-16 Octane Direction.
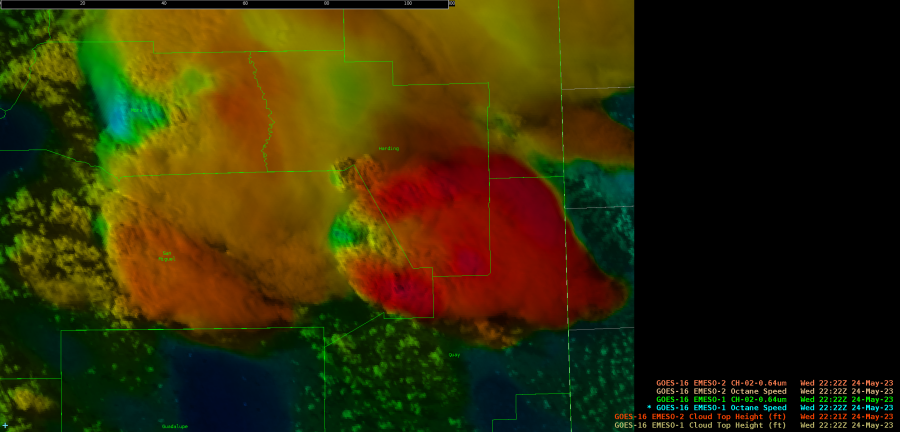
 KPUX 0.5 degree reflectivity.
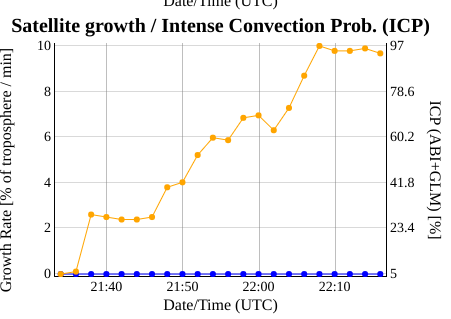 _
_
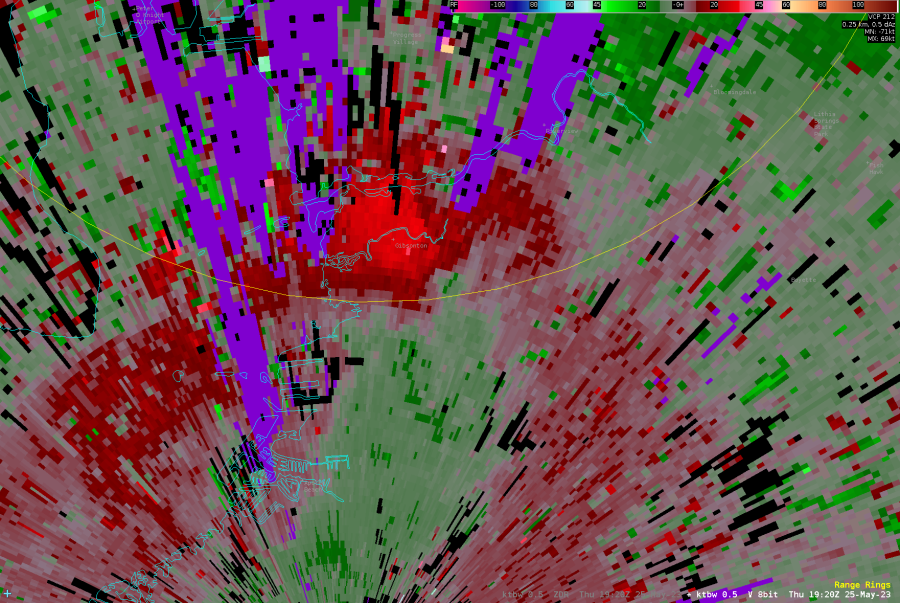 track a developing storm near the Florida State Fair

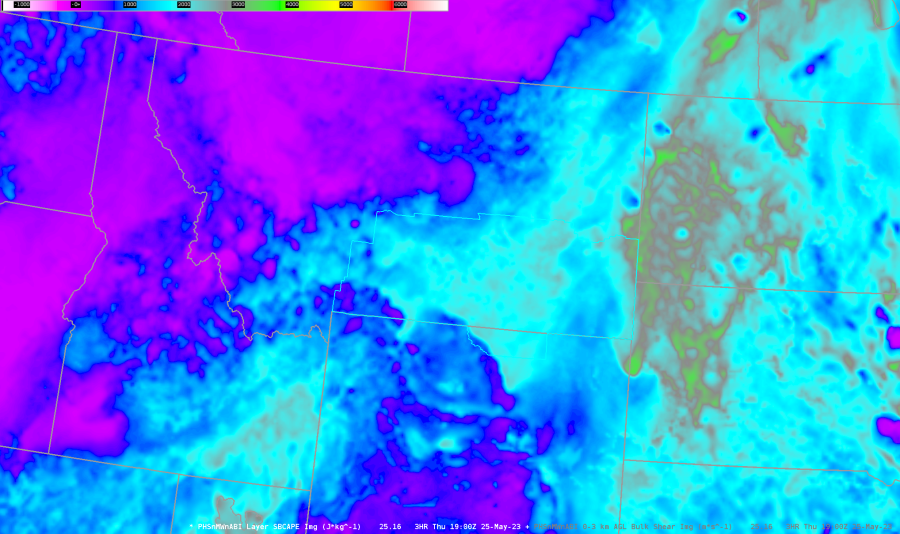
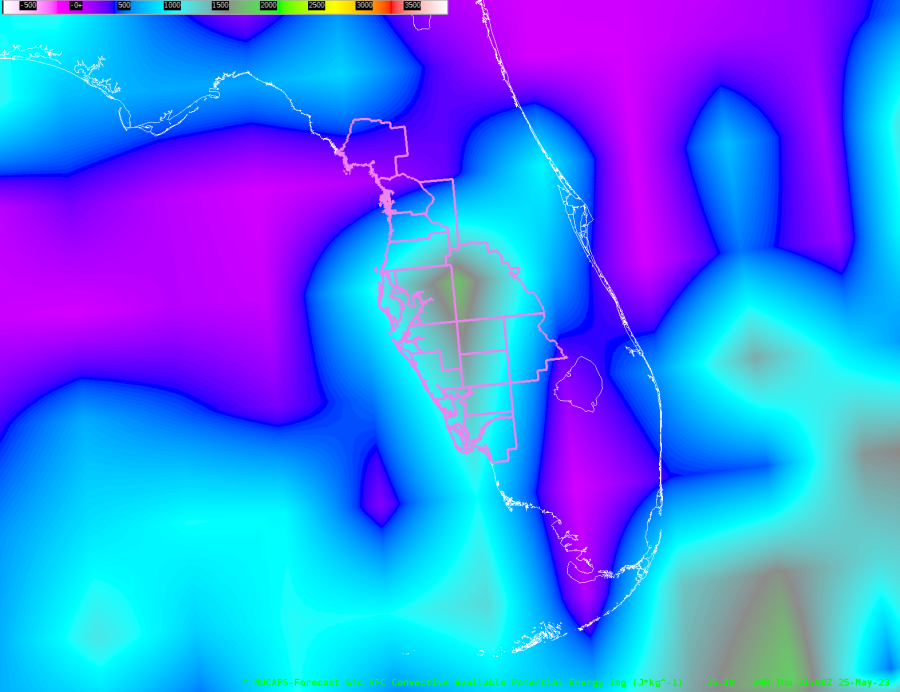 PHS shows a similar trend to NUCAPs with higher areas of SBCAPE across the central and southern CWA with lower values across the northern half of the CWA. However, the color scale on the online version of PHS is difficult to interpret as the gradient ramps up from light red to dark red. So, you cannot really pinpoint specific values of SBCAPE. However, you are able to see areas of lower SBCAPE and areas of higher SBCAPE at a glance.
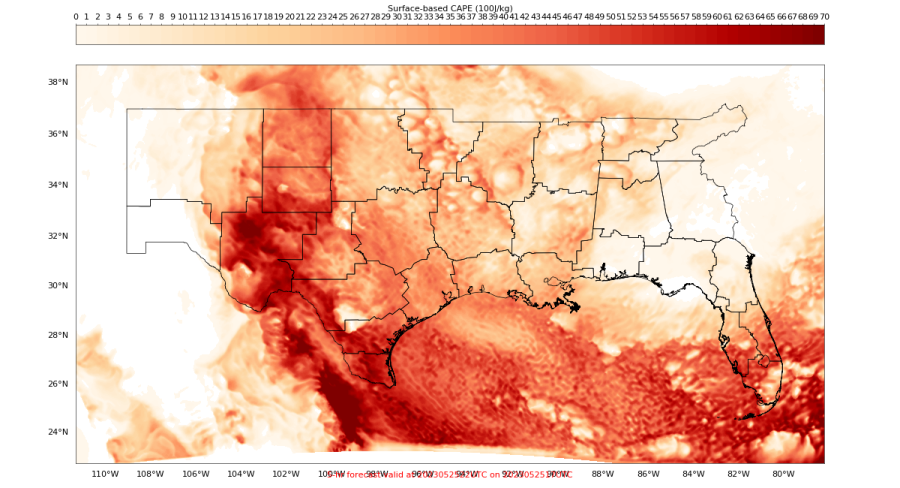
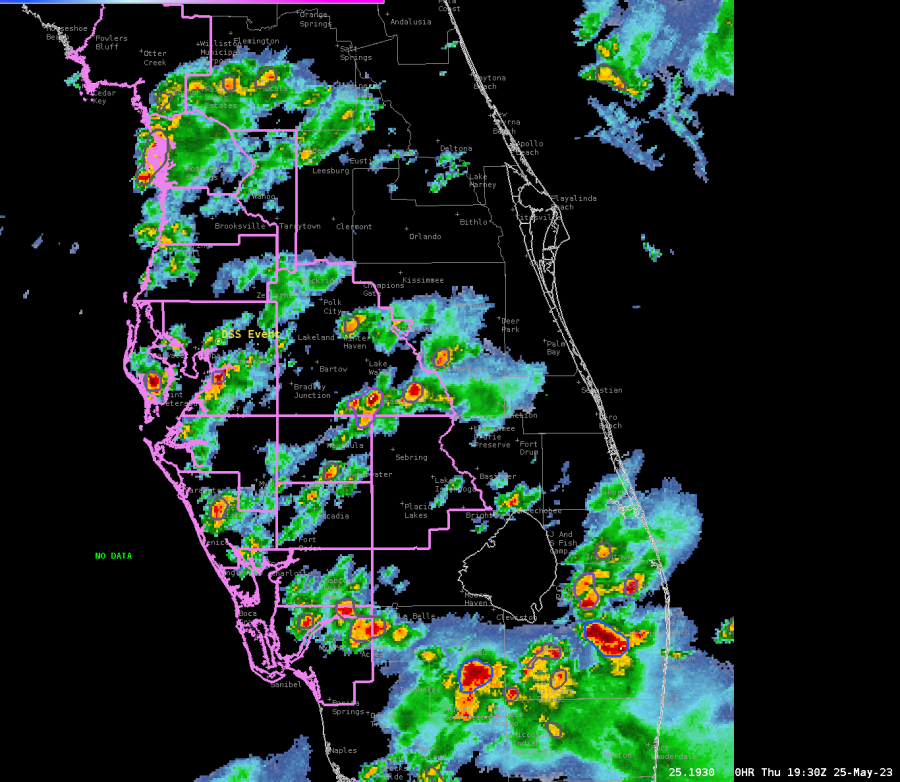 The Octane Speed Sandwich product further confirms that storms are remaining below severe limits as the strongest storms are noted over southeastern Florida this afternoon as of 1930Z. Not only do these products help us pinpoint areas of potential severe weather, but they also help us pinpoint areas of sub-severe weather.
  GLM shows lightning activity increasing across the Tampa CWA early this afternoon, and activity is expected to gradually increase in coverage as more thunderstorms develop through the late afternoon and early evening hours.
  Lightning Cast around 1930Z shows lightning probabilities increasing across the Tampa CWA over the next hour. Pink contours represent a 75% chance of lightning in the next hour. Green represents a 50% chance, teal a 20% chance, and dark blue a10% chance of lightning in the next hour.
 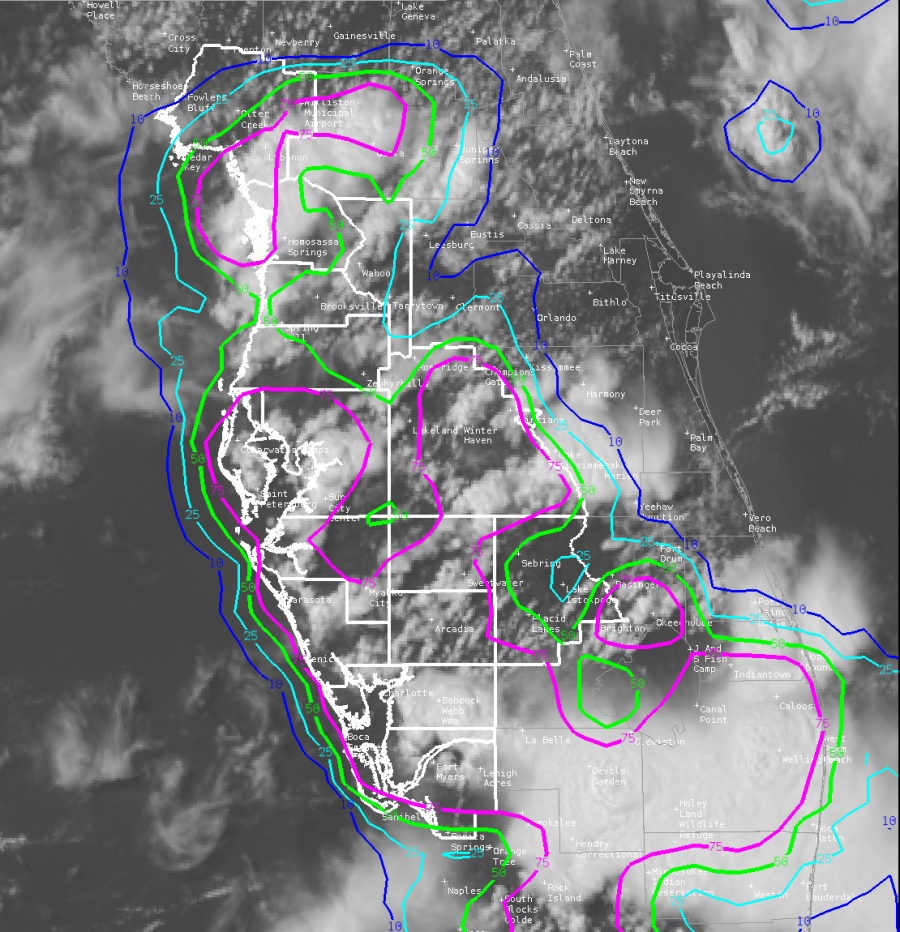 GLM showing lightning activity increasing across Florida from 1930Z through 2016Z across the Tampa CWA. Areas showing more oranges and yellows have shorter flashes and more lightning density. These areas help us know where stronger updrafts are located. The strongest updrafts at the time of this loop remain outside of the Tampa CWA.
  -Dwight Schrute
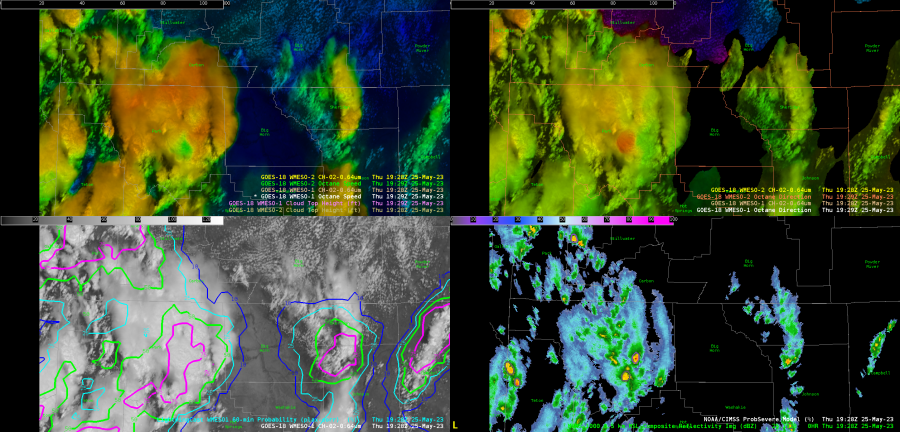 -Thunderstruck
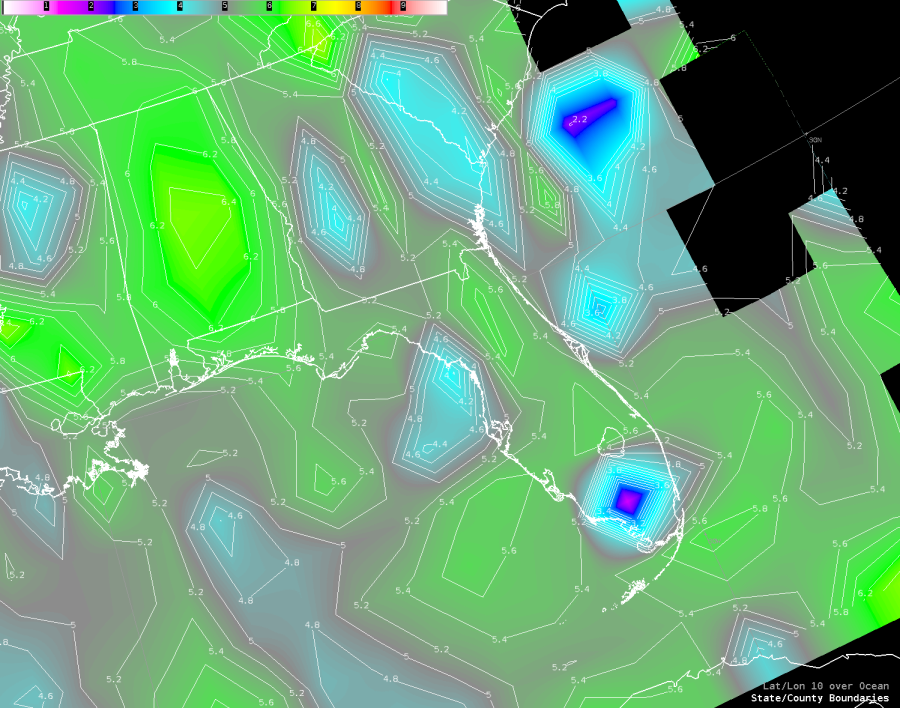
 Octane Speed Sandwich also captured the outflow boundary approaching the DSS Event.
 -Champion
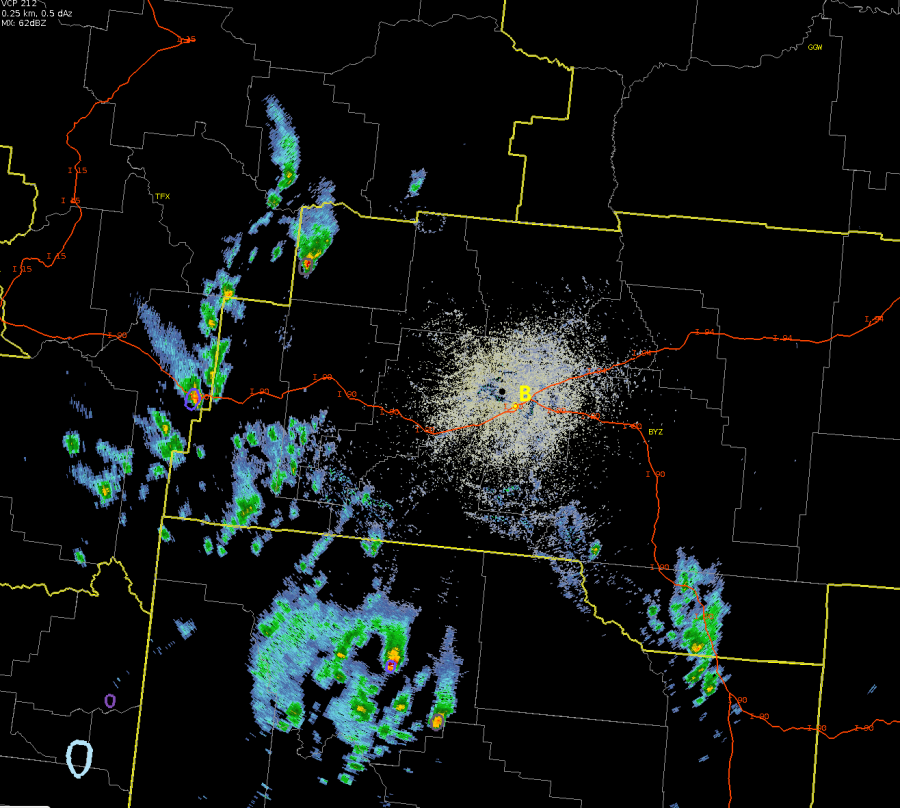
 -Thunderstruck