Showing posts with label OCTANE Speed Sandwich. Show all posts

Monday, May 20, 2024

OCTANE Speed Assignments in Montana

An area of thunderstorms over southern Montana was examined using OCTANE and other satellite imagery.

Of interest in particular is the storm over western Big Horn County. The day cloud phase loop (bottom right) shows that this is a slow-moving thunderstorm, but there is also a bunch of patchy/streaky high cirrus moving much faster over top of it. Looking at the OCTANE speed sandwich (top left), it appears that the convective updraft was assigned the speed of the faster cirrus (yellow/orange, ~80kts). In reality, this updraft is moving much slower. For the sake of comparison and verification, notice the two updrafts over Stillwater County. These updrafts appear similar in nature based on the day cloud phase imagery, but the Stillwater County storms do not have any high cirrus contaminating the signal. As such, they are assigned a proper velocity on the OCTANE speed sandwich (green, ~30kts). There are also some artifacts in the divergence (bottom left) with the Big Horn County storm.

--Insolation

Wednesday, May 15, 2024

MesoAnalysis Support and Lack of Radar

More emphasis has been put on mesoanalysis in severe weather operations over the last several years and utilizing the OCTANE products has demonstrated that it has utility in confirming objective analysis. Scattered thunderstorms were developing across parts of the Carolinas today, but the mesoanalysis suggested that severe thunderstorms would be favored farther south and east of our area of concern through the late afternoon. A quick look at the SPC mesoanalysis of effective shear showed values of 40-50 kt to the south of our area of concern. As thunderstorms started to develop, we were able to use the OCTANE products to confirm that larger areas of shear were present with our southern storms.


Thunderstorms were ongoing across parts of northern SC and southern NC through mid afternoon. The OCTANE speed products clearly show slower wind speeds aloft to the north, while our southern storms show much higher wind speeds aloft and even some divergent signatures to the southwest of our event. A few of these southern storms would eventually become severe. This product will be beneficial to short term operations in confirming local objective analysis.

Our case also required us to look at information without utilizing radar. The GREMLIN product filled the role of radar data, but some notable issues were present. The GREMLIN latency approached 20 minutes at time, which really makes the product unusable for real time warning operations. However, discussion with the developers indicated that some of these latency issues could be overcome. The utility in the product comes from its visual representation. Forecasters are used to looking at radar data, and this product offers something similar. Latency issues must be overcome for it to be usable in operations. The product overlaid with real time lightning data would offer utility in areas with poor radar coverage or during times of significant radar outages. After working a few days with the other products, the GREMLIN utility really became evident in the absence of regular radar data. An example is shown below.


Would you warn?


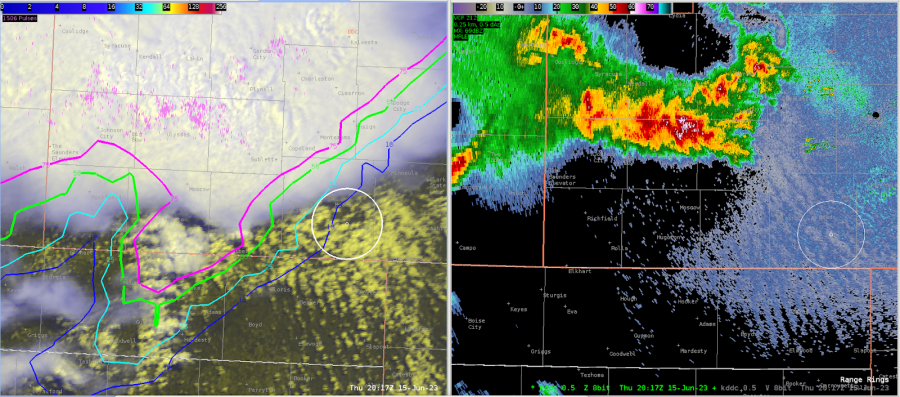
I want to walk you through a thought experiment that I had today during this event in the Panhandle region of TX/OK, as it enters the southeast corner of the Amarillo forecast area. From the Amarillo forecast area, highlighted in white in GIF one, the environment becomes increasingly more unstable. The storm in question is moving through the bottom right corner of the forecast area moving southwest to northeast. 


Here is the question I want you to ponder. Would you warn on this storm with only the environmental information and the two satellite products provided in GIF one? We are assuming we don't have radar data right now. 

GIF one: CH-2, Red Visible GOES-16 1 minute imagery from the MESO-1 Sector. 

Okay, I know, we would normally have the prob-severe tool, and lightning data. But I didn't look at it. So what was my answer? A hard maybe because I would want to make it a group discussion with the other forecasters on shift. My vote would be to warn, but with the lack of information, I would have no problem waiting for a storm report or some other data source.


Now, ask yourself the same question. Would you warn on the cell moving through the bottom right corner of the forecast area? But this time, you have access to the OCTANE suite of products. 


Have an answer? Let me share some further information I collected from the developer before we share out answers. 

I discussed with the developer what correlations existed between the OCTANE speed and divergence products and the severity of a storm. None had been established yet and the rule of thumb I was left with was that the storm top diverge observed in OCTANE speed products were about 30% to 50% less than the radial velocity divergence signals we normally use with data from WSR-88D. So where we measured a divergence speed of 40 kt in the OCTANE Speed product, the radar velocity should be around 50 to 80 kt, which could definitely support severe hail. 

So, I said I would have been comfortable warning with just this additional OCTANE information. That said, a discussion may still be held, but I think this would be the information that gets the warning out more quickly. If I had a table of correlated values and severity? My confidence would sky rocket!

-Kilometers


Update: There was a storm report generated from a mesonet observation that observed a wind speed of 78 mph. 

The Machine Learning Foretold the Future

While monitoring convective initiation in a sea of Altocumulus castellanus clouds as they moved into a more convectively unstable environment, I noticed that the GREMLIN Emulated reflectivity in Briscoe County was higher than the MRMS (GIF 1).  The GREMLIN emulation was producing a DbZ of 50+ while the MRMS was showing a 30 DbZ. To me, this difference was operationally significant as I would pay closer attention to the developing 50 DbZ feature than I would the 30 Dbz feature. So far in our experiment, this was the opposite of what I had experienced and I initially thought the emulated radar was wrong. I jumped over to the OCTANE products to get a sense of how rapidly the cell was building (GIF 2). My assessment of the cell seemed to confirmed my initial opinion that it was not growing as rapidly as I would have expected given that there was not a strong gradient in the speed or direction products. 


Gif One: GREMLIN Emulated Radar on the top and MRMS Composite Reflectivity on the bottom.

Gif Two: OCTANE Products (Speed Upper-left, Direction Upper-Right, Divergence Bottom-Left) and Day cloud Phase RGB (bottom-right)

My opinion changed 10 minutes later.  Seen in image one, the MRMS with the next update showed a similar storm intensity to the GREMLIN emulation. This is impressive when one considers the latency of GREMLIN is greater (about 10 min) than the latency of MRMS (about 2 min). The GREMLIN product actually delivered a more operationally useful product sooner, despite having a greater lag. The GREMLIN product continued to show this ability for two more storms developing further back in the line!

Image One: GREMLIN Emulated Radar on the top and MRMS Composite Reflectivity on the bottom.

 -Kilometers

Thursday, June 15, 2023

Day 4 Review of Products & Operational Applications

 Today, I took on the role of mesoanalyst during operations. I first looked at PHS fields (mainly MUCAPE and bulk shear) and compared them to the SPC mesoanalysis of said fields. The two agreed well, though I do have a suggestion – PHS bulk shear fields are given in m/s, but knots or mph would be better for quick comparison to SPC mesoanalysis and most model output.

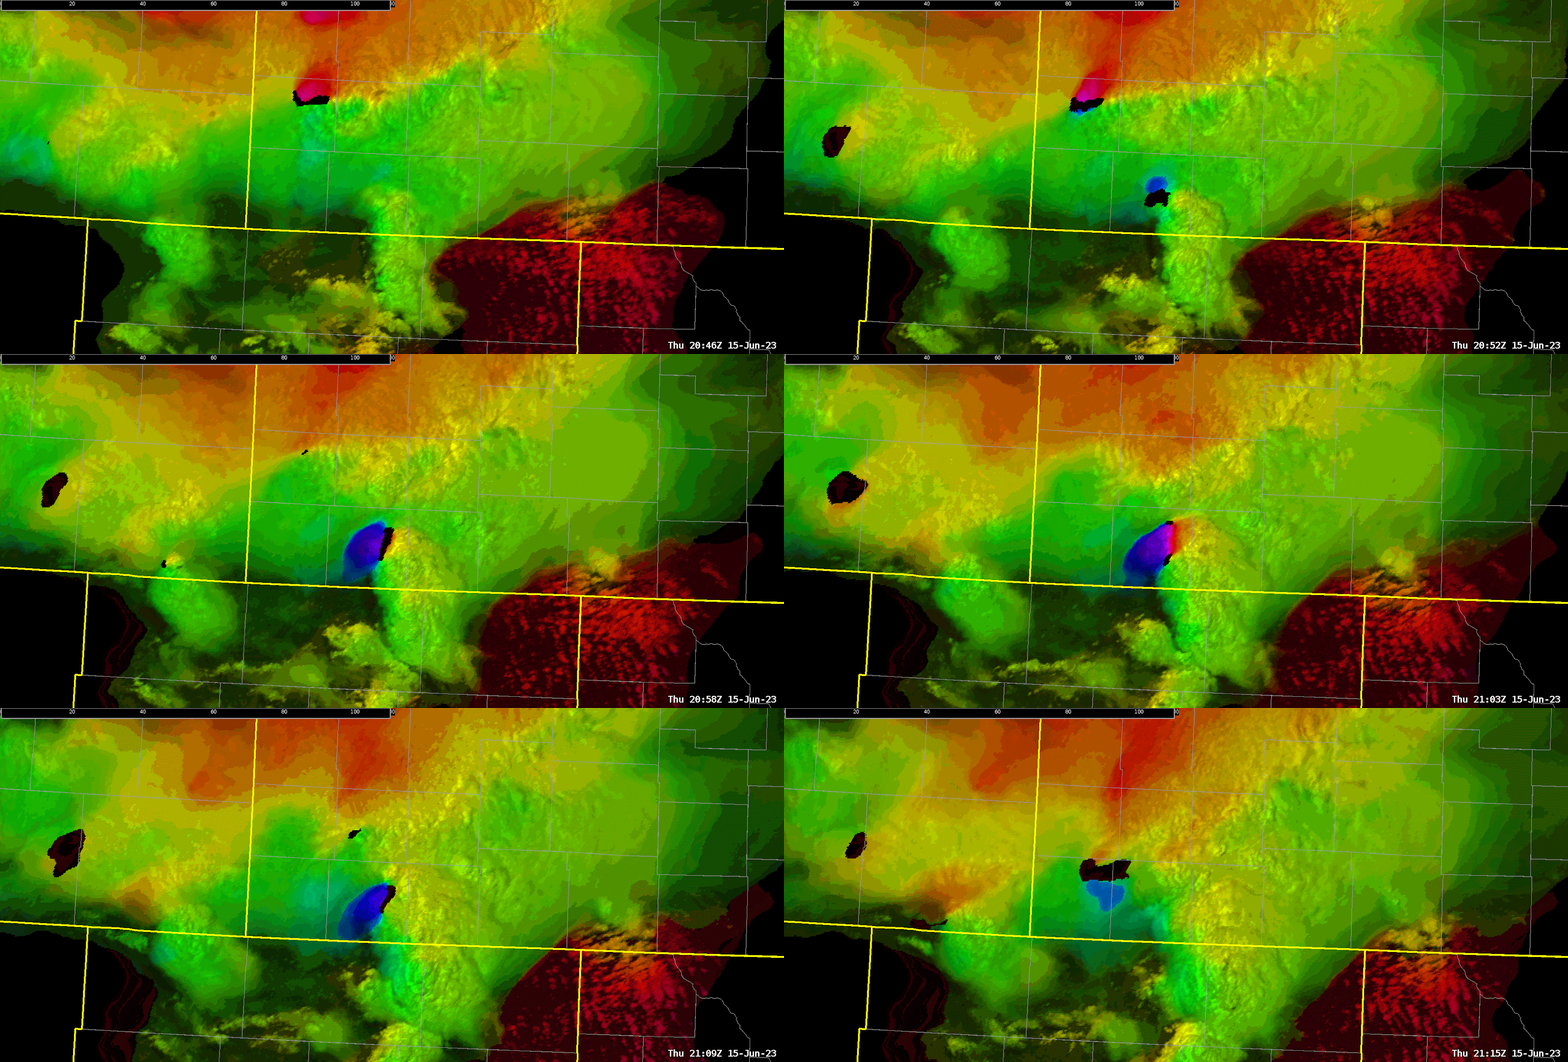
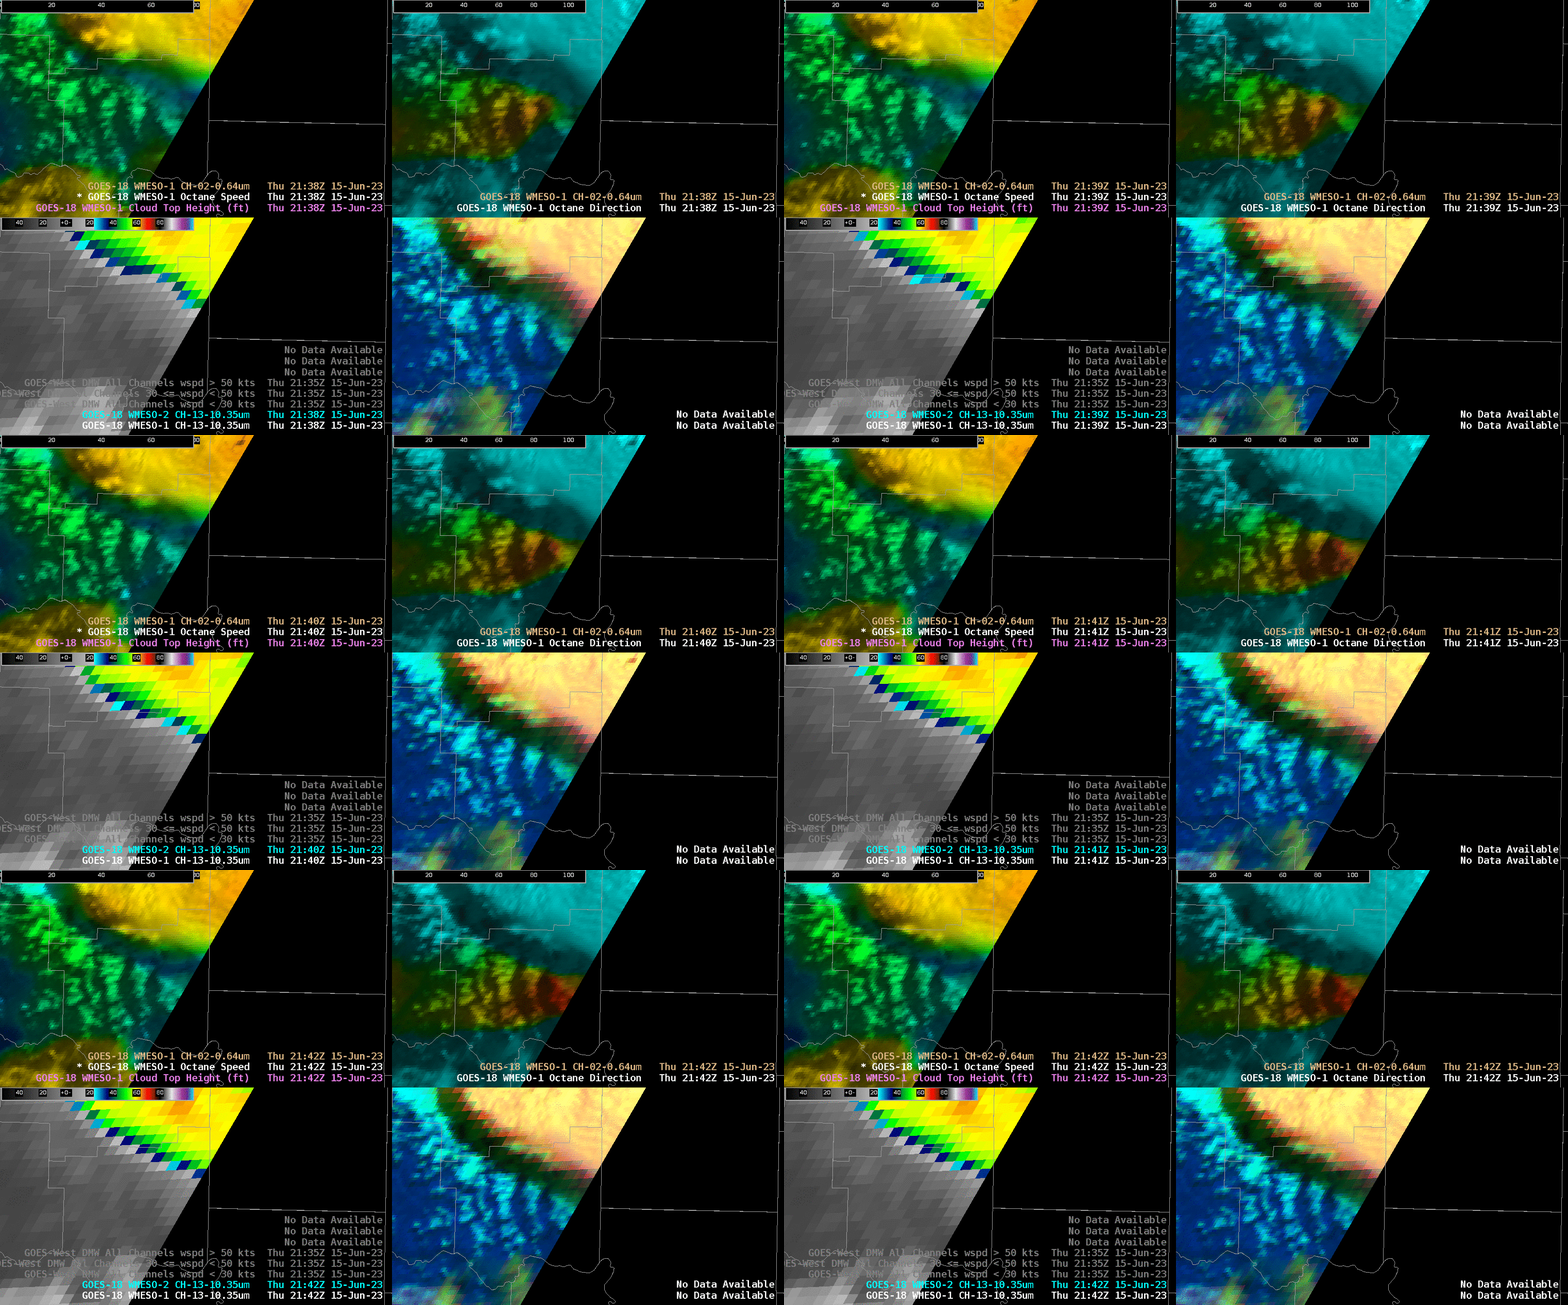
I then looked at OCTANE imagery and immediately took note of the divergence signature associated with an especially robust storm over western DDC (Figure 1). This signature was easy to identify as the environmental winds aloft were relatively light.

Figure 1

As the operational period wore on, LightningCast indicated a high likelihood of convection over the southwest portion of DDC well before any radar returns actually appeared (Figure 2). My group used this information to create a DSS graphic that highlighted this area for likely storm development later (which did in fact end up happening).

Figure 2

OCTANE Direction later captured what at first glance appeared to be a couple divergence signatures over southwestern DDC (Figure 3). Upon closer inspection, however, these signatures were co-located with relative minima in OCTANE Speed. The proximity of these signatures to areas of missing pixels (where winds are likely <5 kts) in OCTANE Direction suggests very light winds and/or lower quality data, per the developer.

Figure 3

- Vort Max

6/15 Feedback for AMA

 PHS

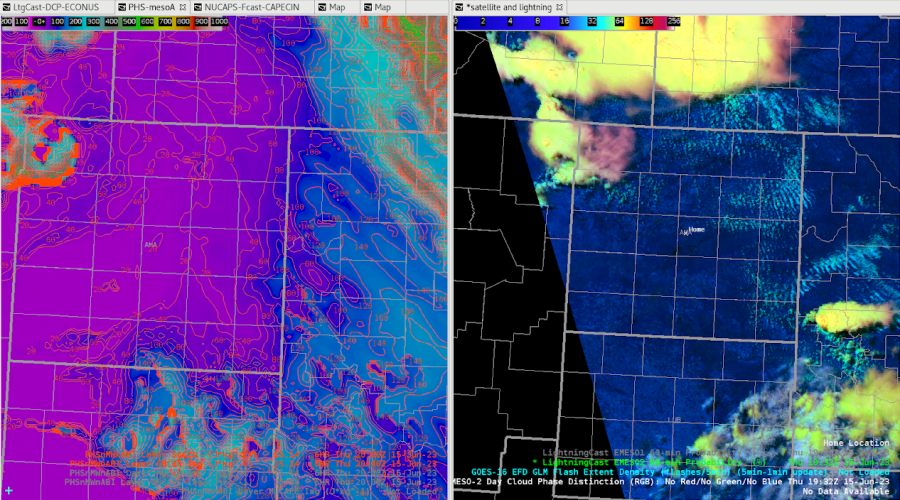
The surface based CINH at 20z lined up rather well with the satellite imagery showing the slightly more stable clouds over the eastern CWA.
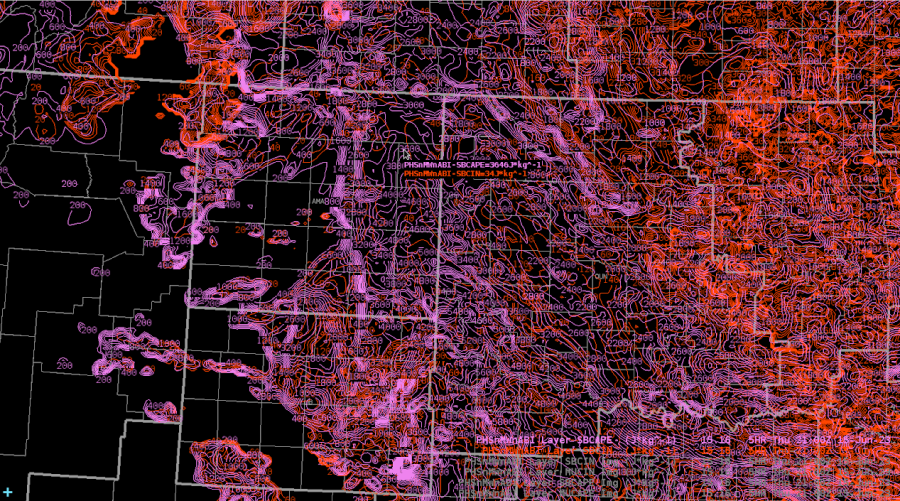
When sampling an image versus contours, the contour sampling has the entire product name in the readout
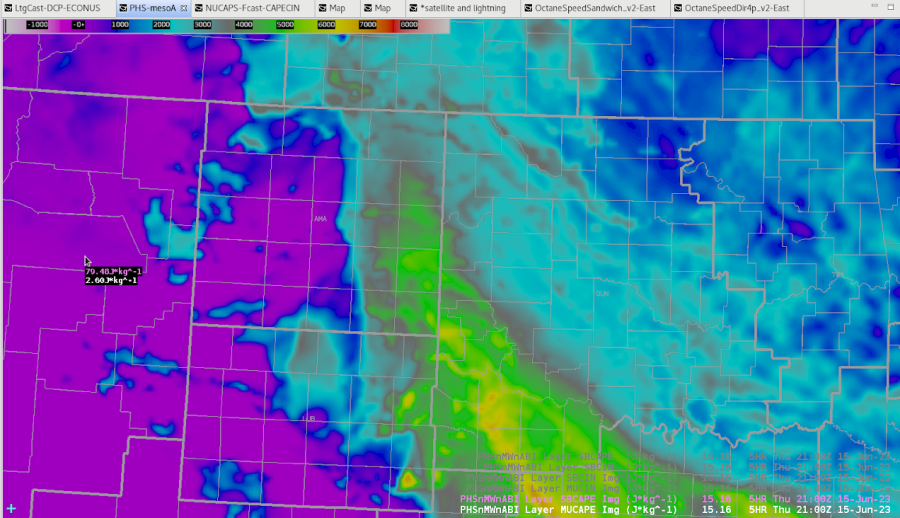
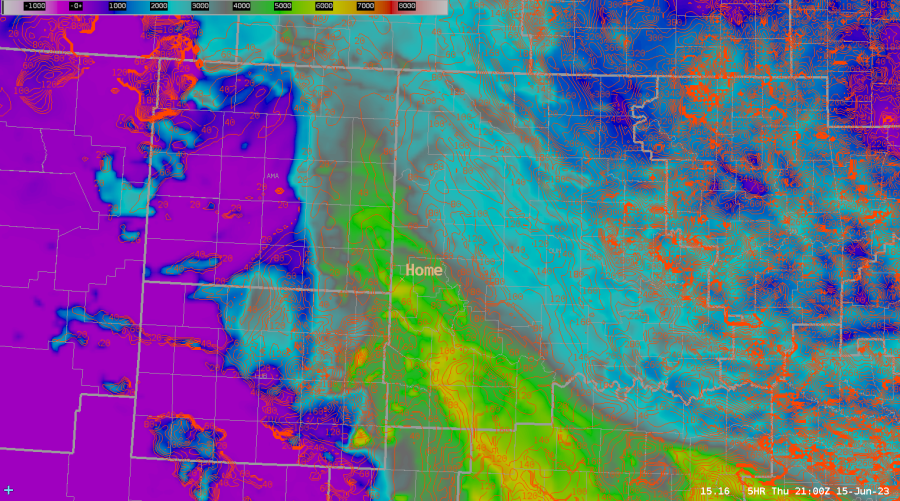
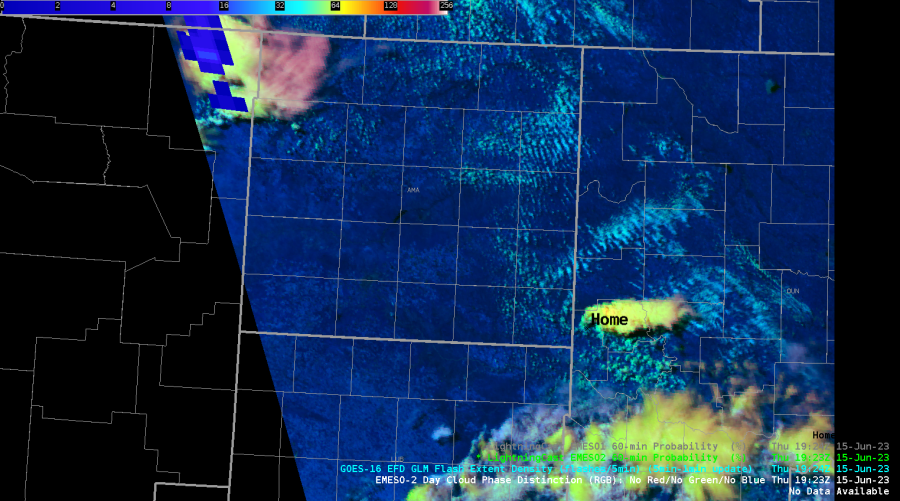
PHS captured the initial convection just east of AMA well, even though the convection started an hour earlier than PHS indicated.  Image on right is PHS SB CAPE and contours are PHS SB CINH.  Home is roughly where the storm is located.  Satellite image is around 1930z and PHS forecast is 21z when CINH dropped from 80j/kg to 40 j/kg.
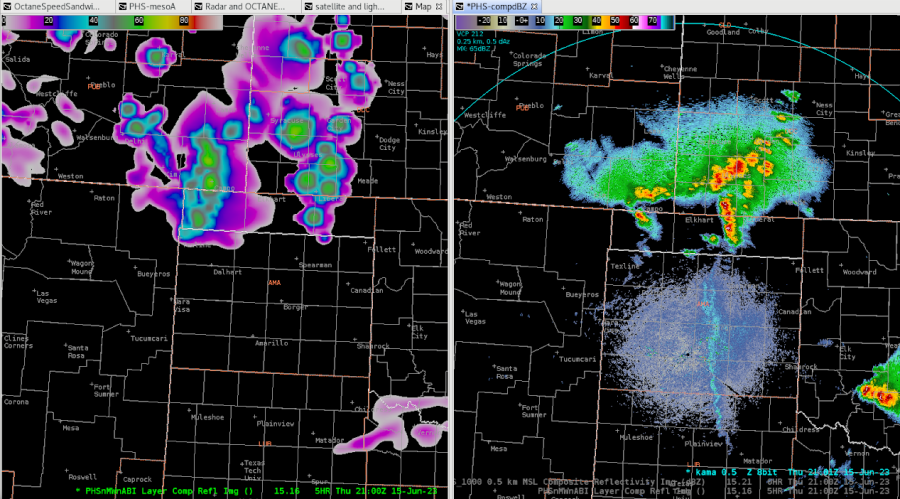
PHS did a reasonable job predicting the general storm coverage by 21z from the 16z run.
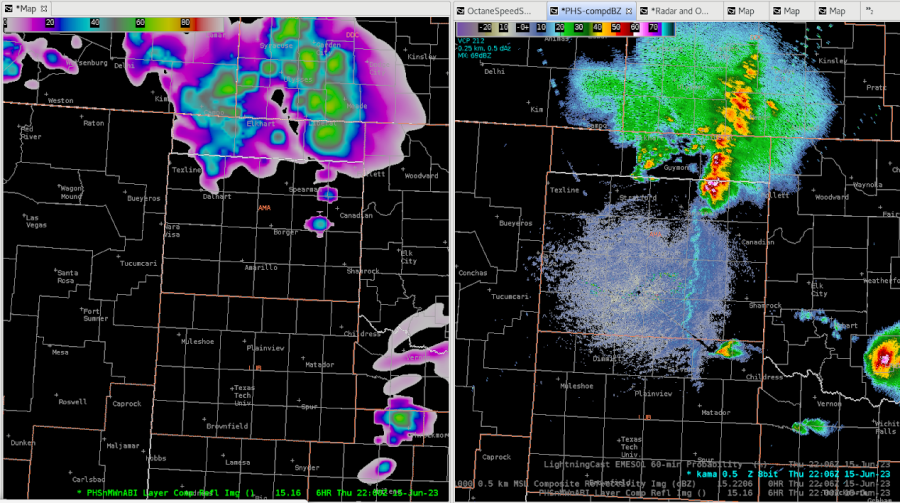
Toward the end of the exercise, the storm coverage was well captured by the PHS 16z run.  Should have taken this into account for my public graphics when describing the storm evolution.
NUCAPS

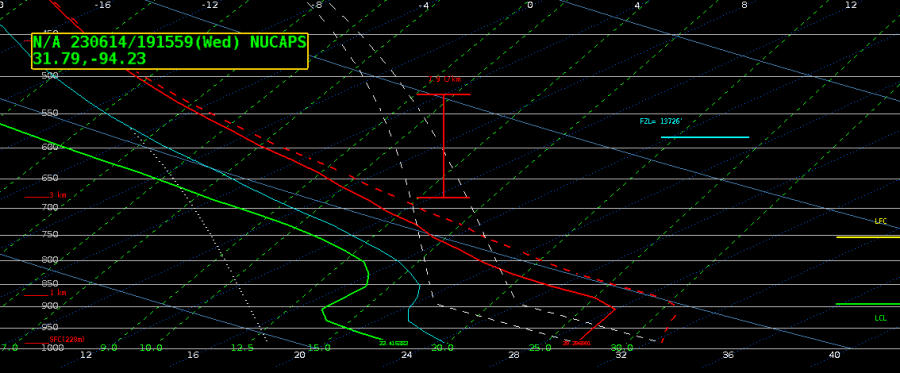
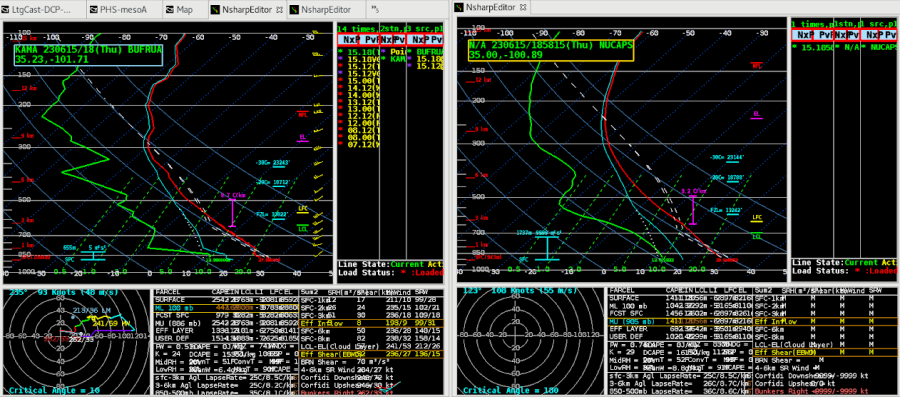
This is a NUCAPS sounding in the TX panhandle near AMA vs. a RAP40 sounding at the same point.  The RAP has the same trend in the dew point profile as NUCAPS, but is lower.
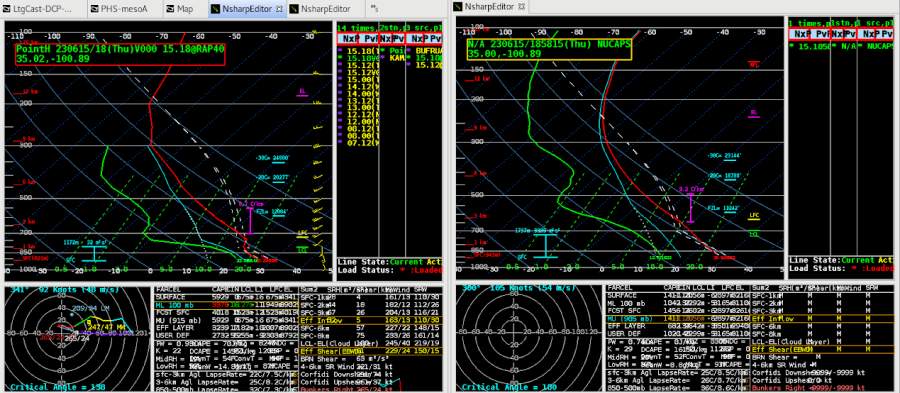
Noticed the NUCAPS sounding didn’t have the lower dew points around 400 mb as shown in the special sounding.  NUCAPS did have a hint of the weak cap near the surface though.
NUCAPS 700-500mb lapse rates from the gridded data was a constant 34.17 C/KM across the map.

NUCAPS forecast for ML CAPE was slightly less than what SPC mesoanalysis had at the same time of 20z.
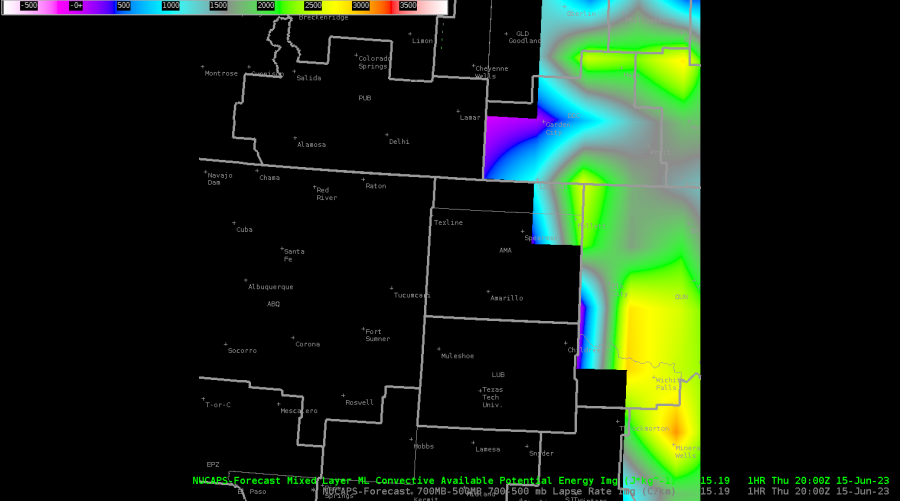
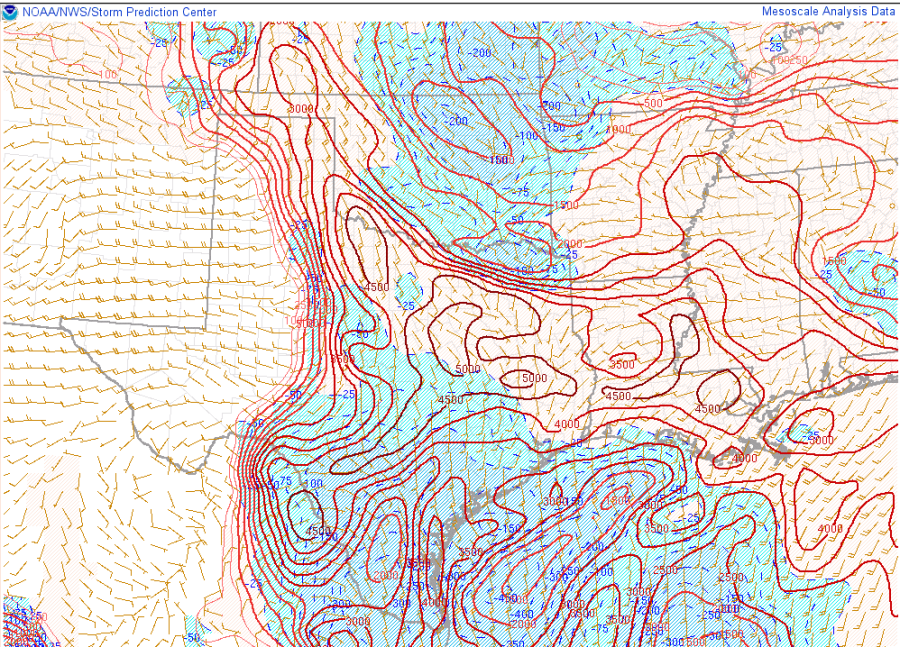
NUCAPS ML CINH was higher than SPC Mesanalysis for 20z, with some parts of the CWA having almost 90j/kg of CINH south of Liberal, KS.
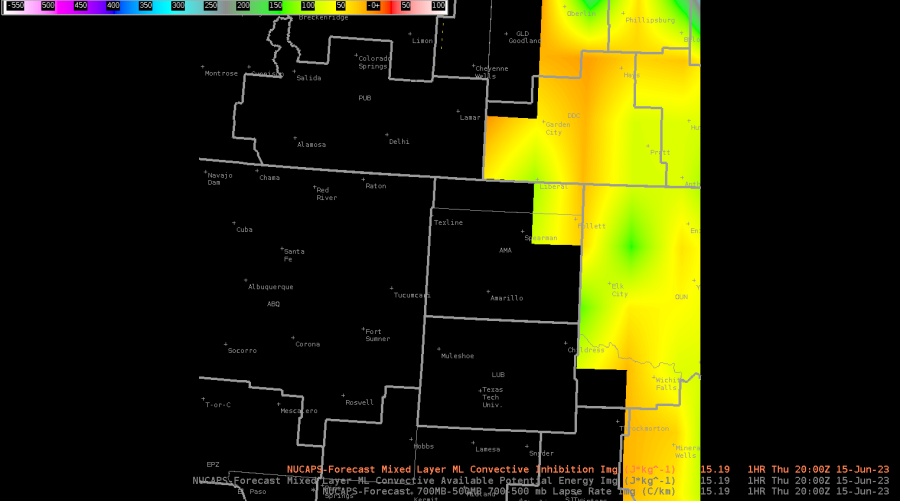
The 700-500mb lapse rates matched well with SPC meosanalysis for 20z.

OCTANE

OCTANE showed the cumulus developing along the dry line and warm front well.  Can also distinguish which clouds are becoming taller.
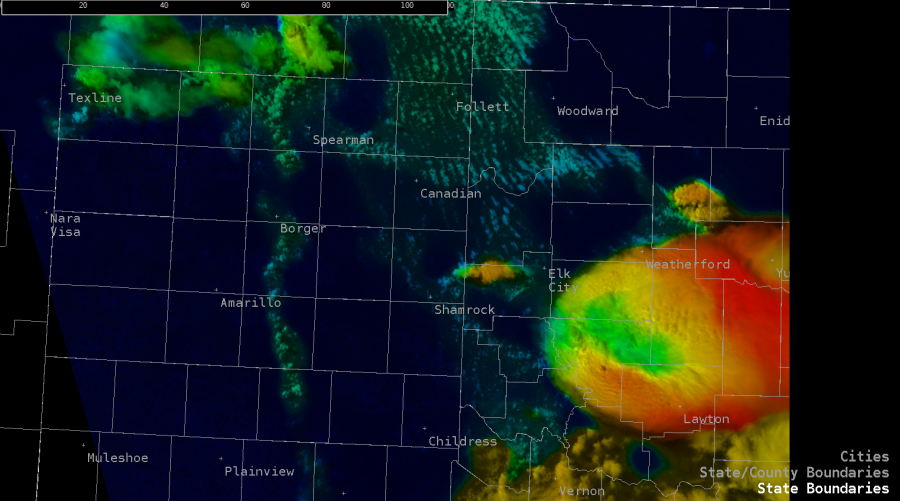
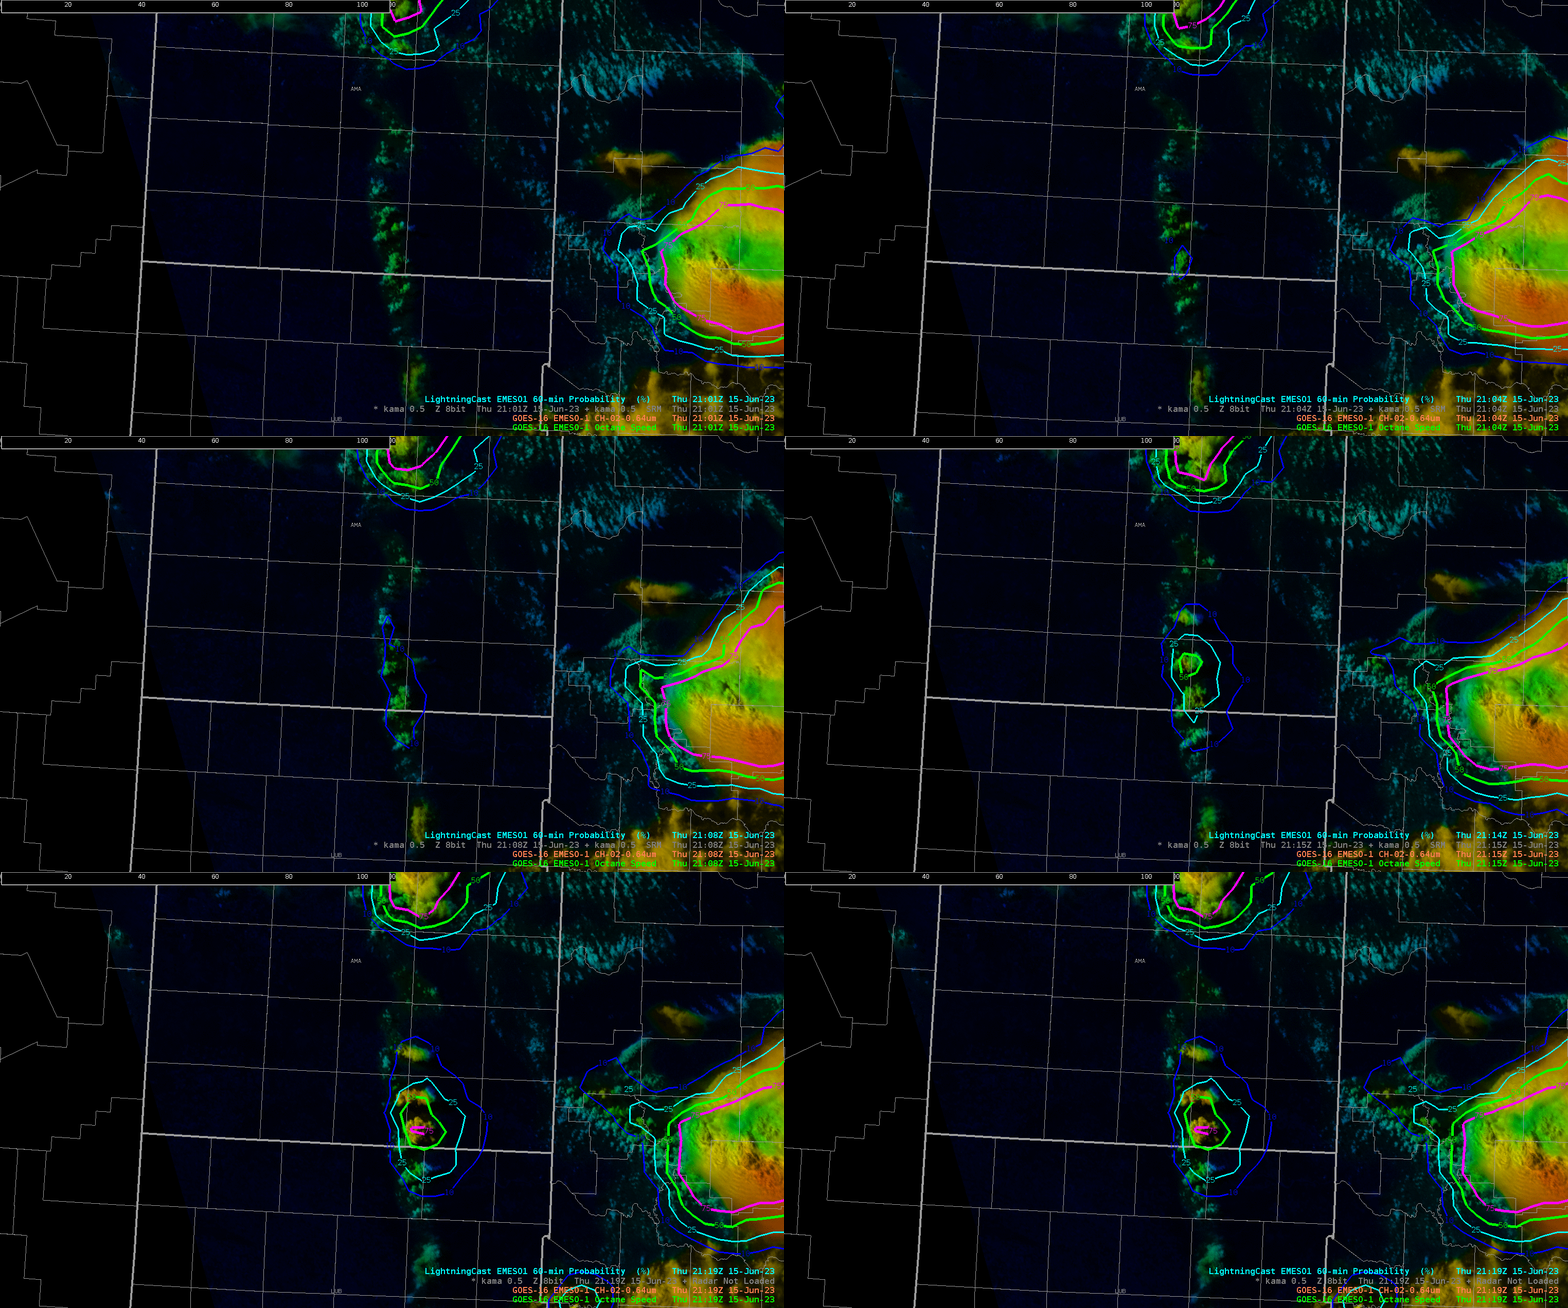
OCTANE highlighted where convection was taller, and Lightning Cast started to show probabilities for those same updrafts.
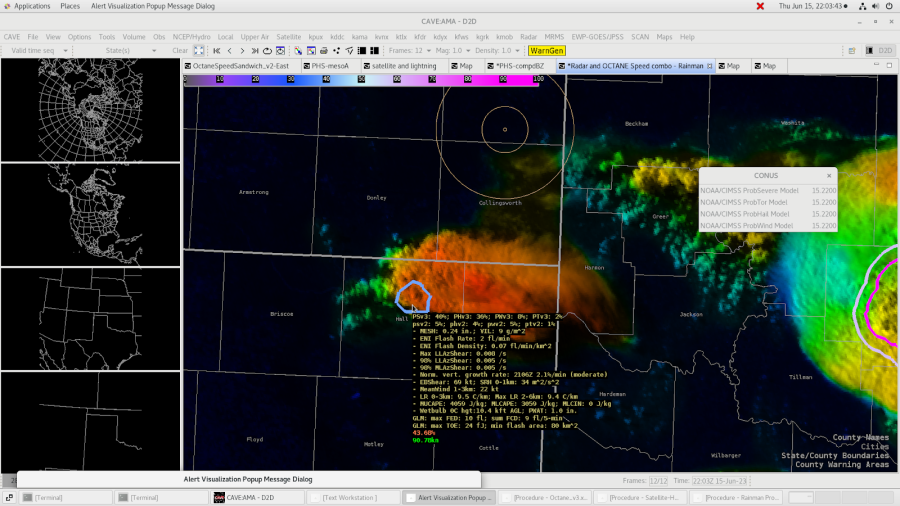
ProbHail

Noticed what could be an above anvil cirrus plume with the storm in question.  Prob Hail only had a 35% chance for severe hail at the time.
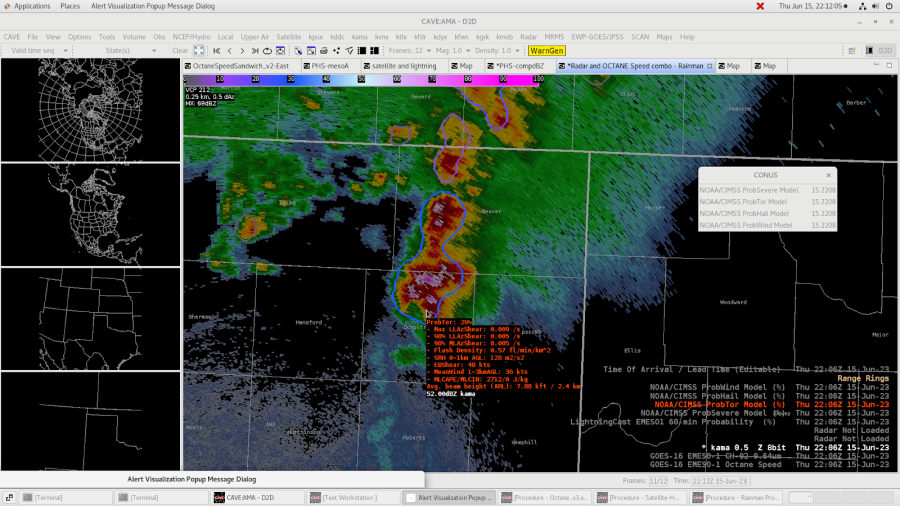
Prob Tor

Noticed the Prob Tor jumped up depending on what cells it was encompassing.  Took three screen shots to denote the trend.  Seemed reasonable for it to increase since the end cell was ingesting the dry line at the time the probabilities increased.
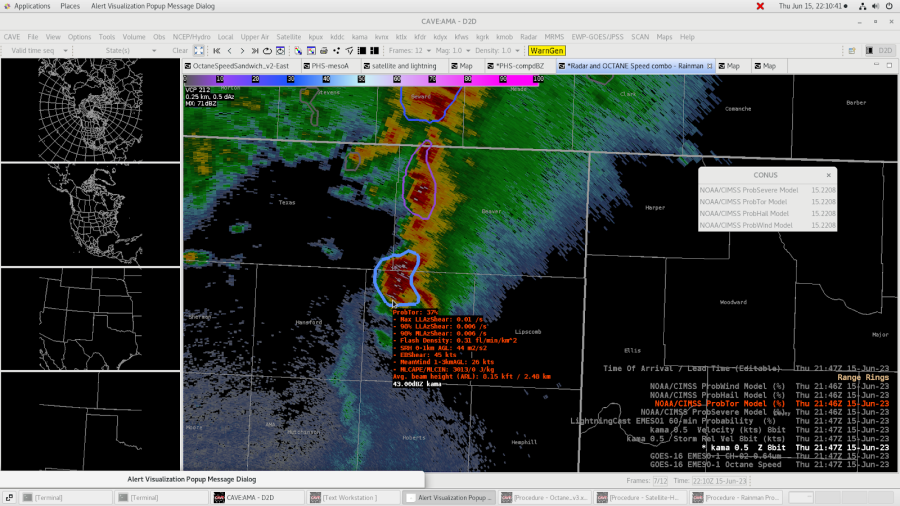
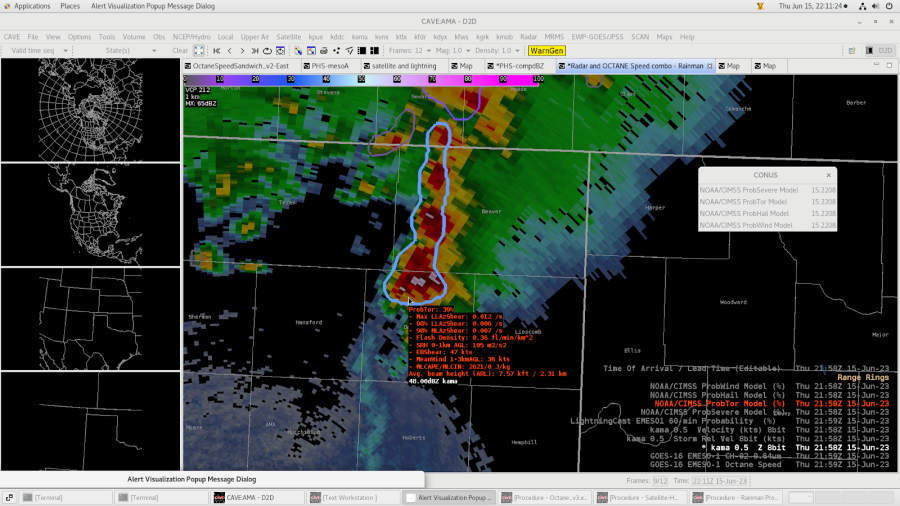
-Rainman

6/15 HWT OUN SuperCell

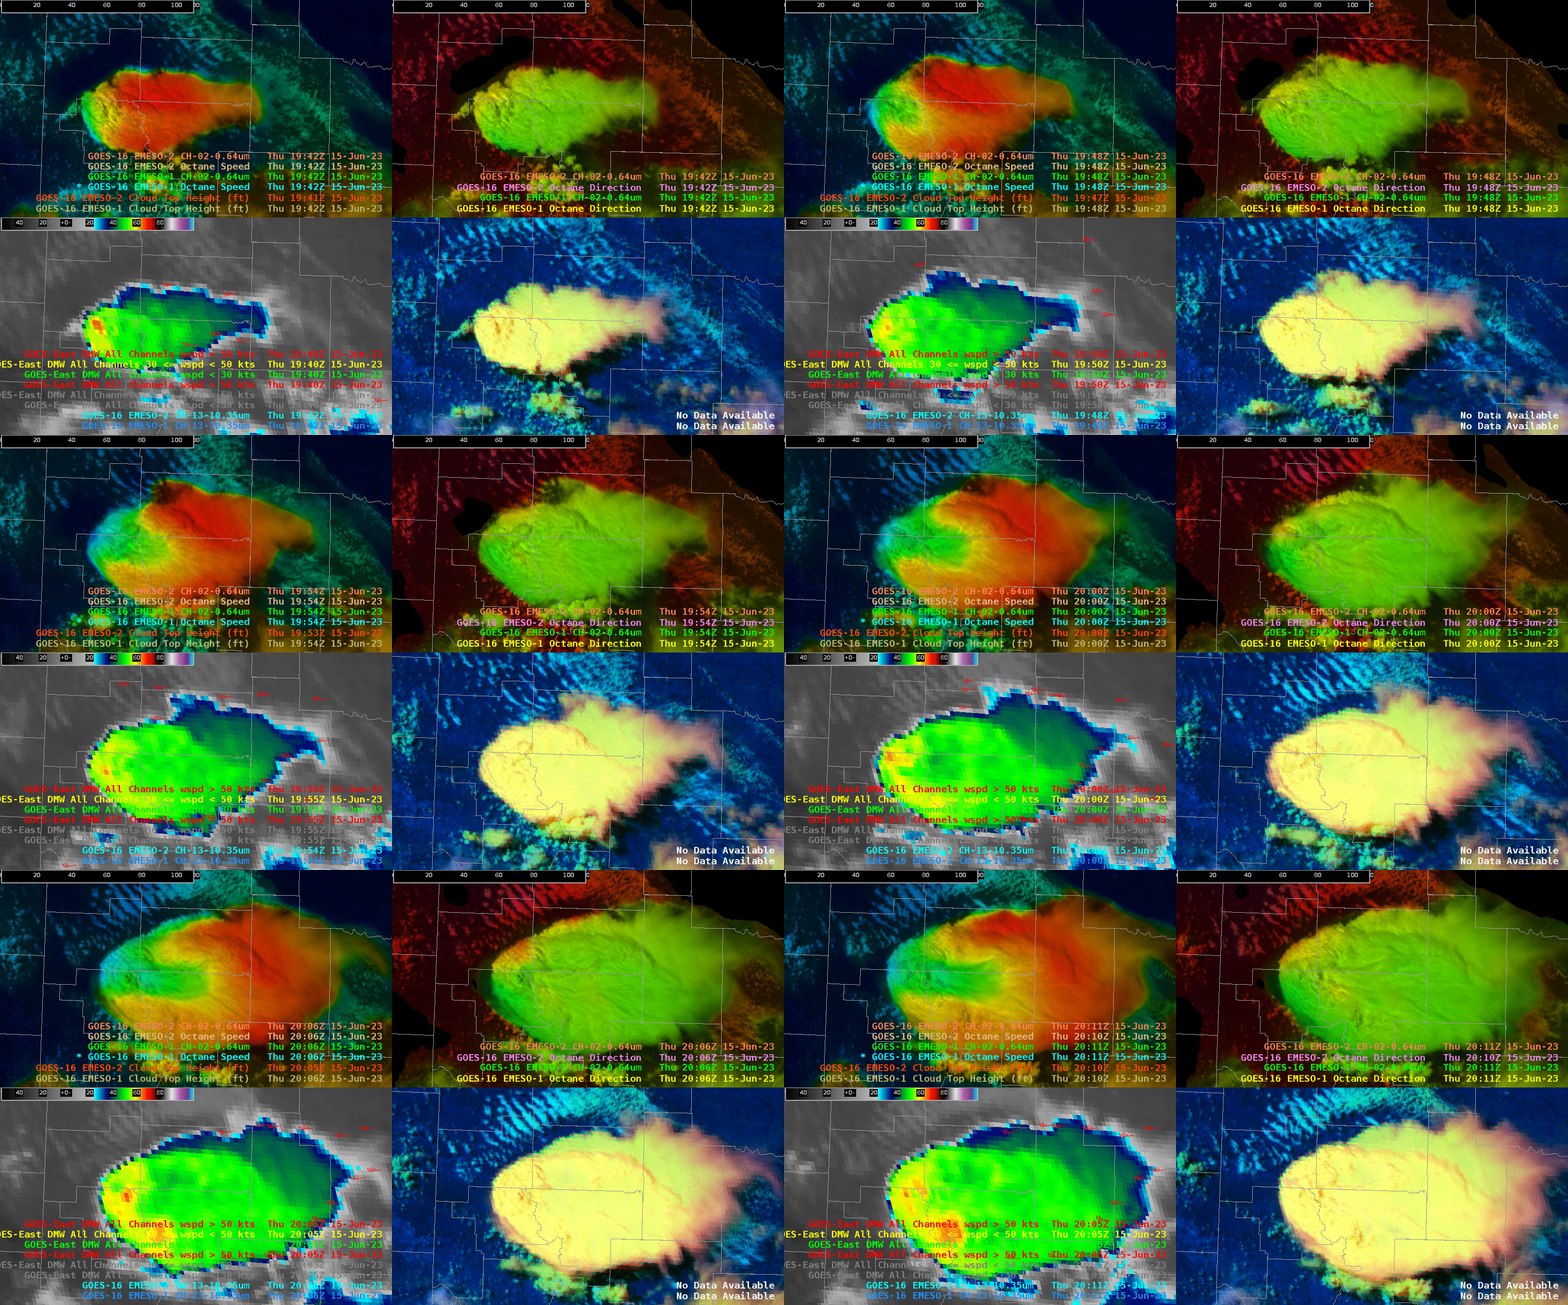
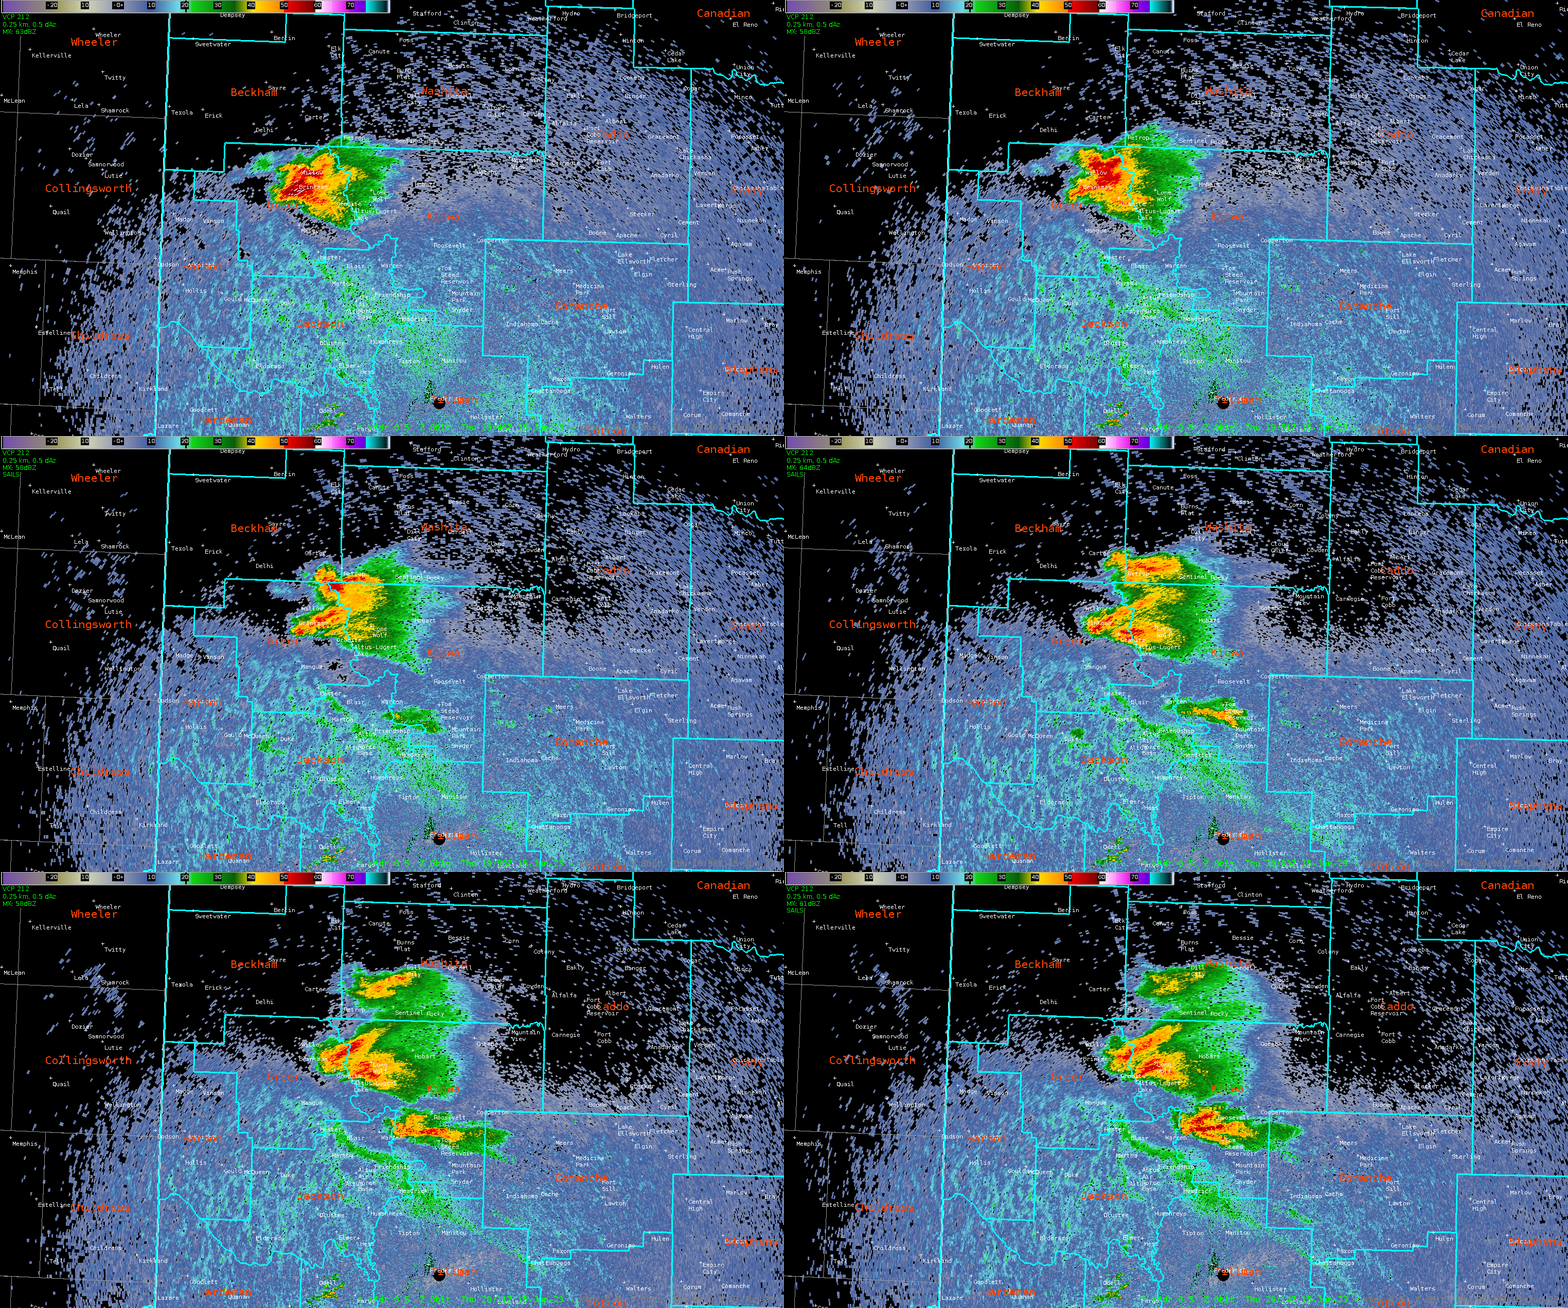
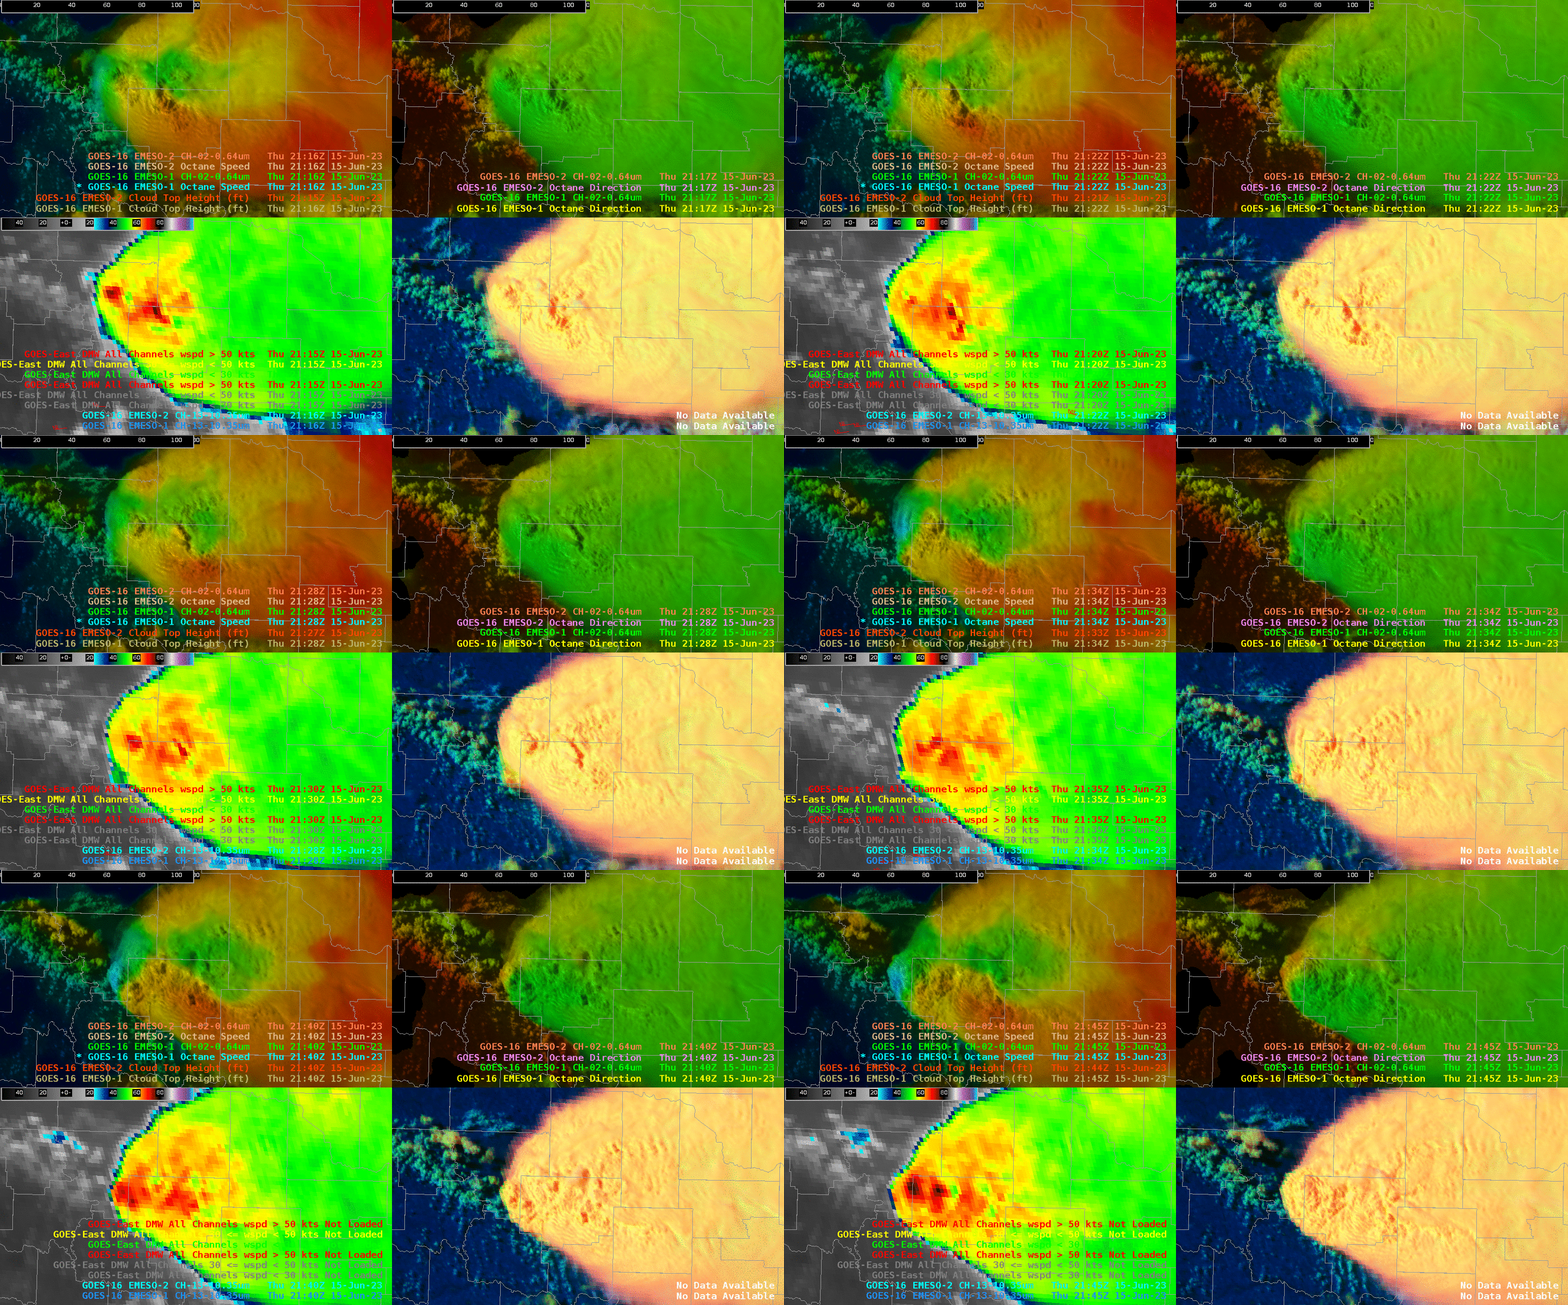
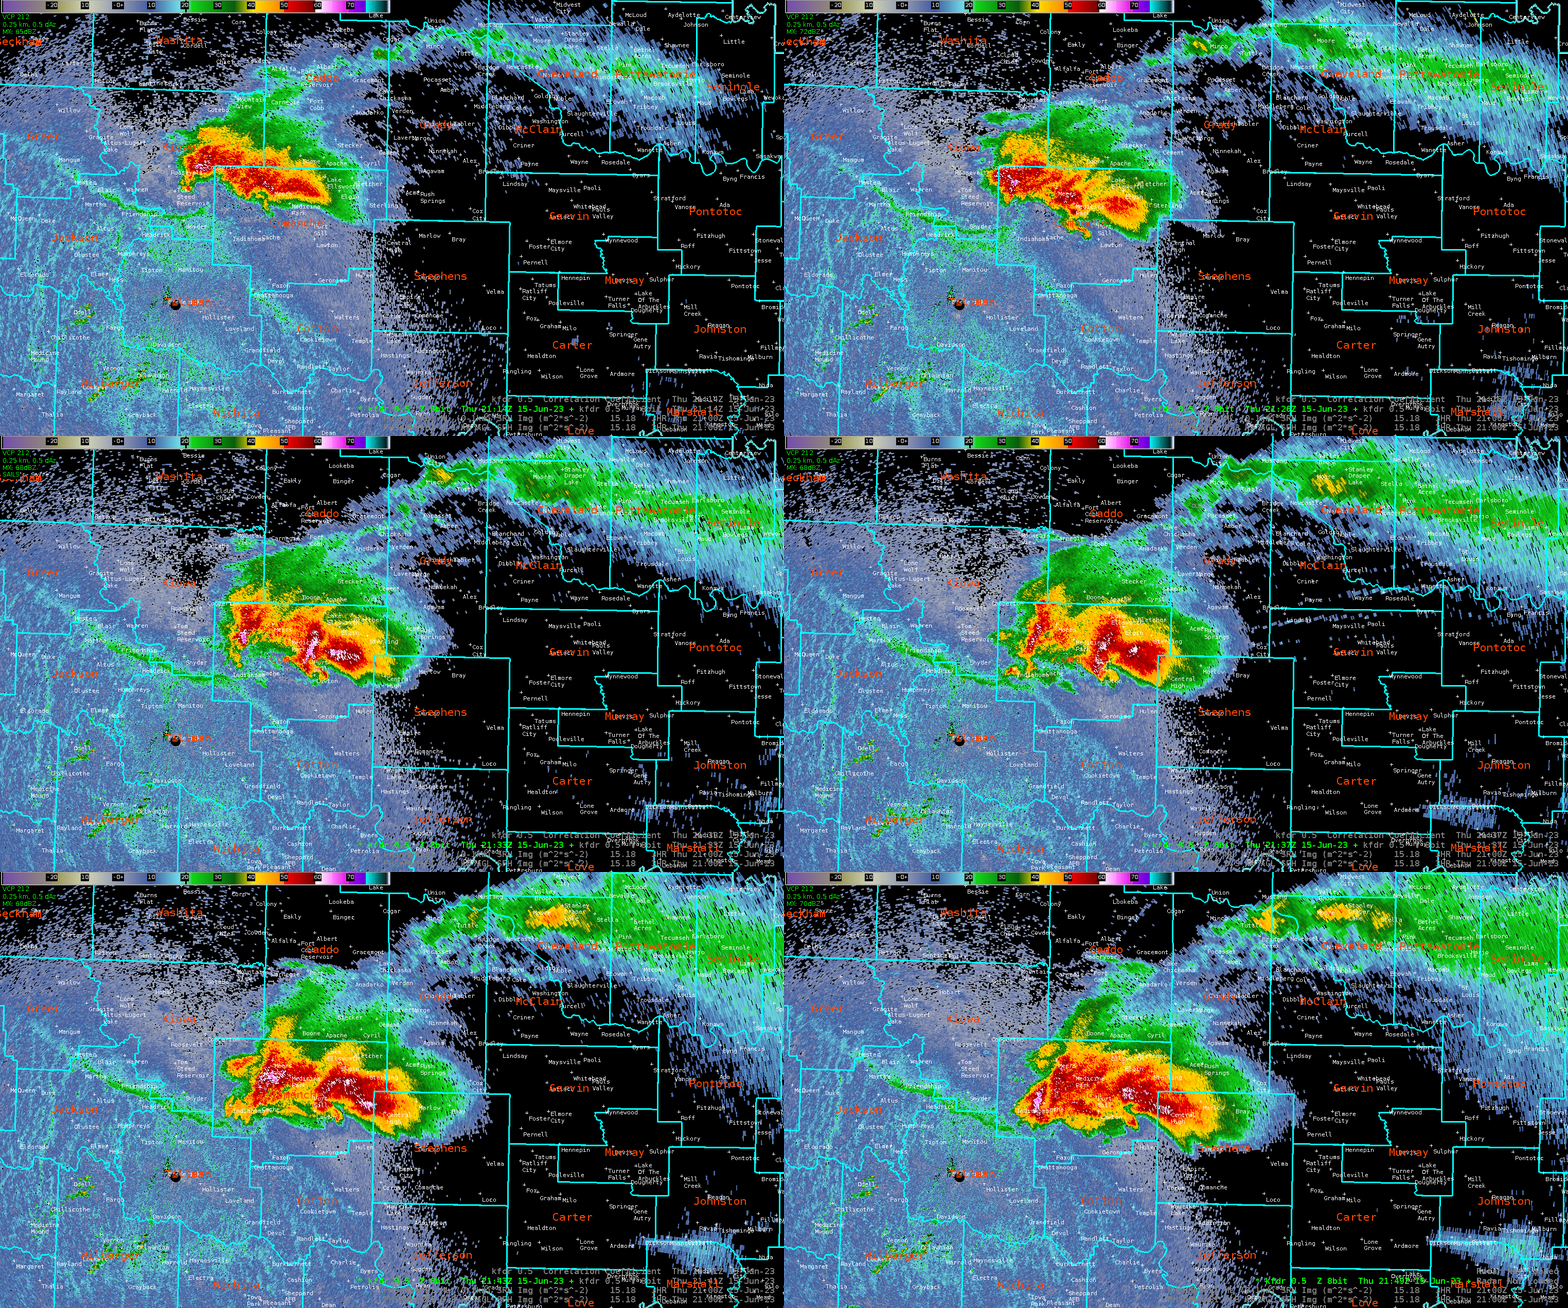
 A very intense supercell formed across western portions of OUN CWA. This cell underwent many transformations including splitting and merging at other times. Octane was very interesting to watch as this cell went through the various processes before eventually producing a tornado. Octane was able to show the storm splitting before it occurred on radar.  PHS was also showing corridors of stronger 0-3 and 0-1 SRH; SPC Mesoanalysis was showing this as well but I did like how the PHS was able to highlight exactly where these occurred. Seeing that and a near stationary boundary did increase my confidence that if a storm was able to latch on it would become tornadic. Probsevere/MESH did struggle to catch on to how large the hail actually was initially before finally picking up on the hail size.

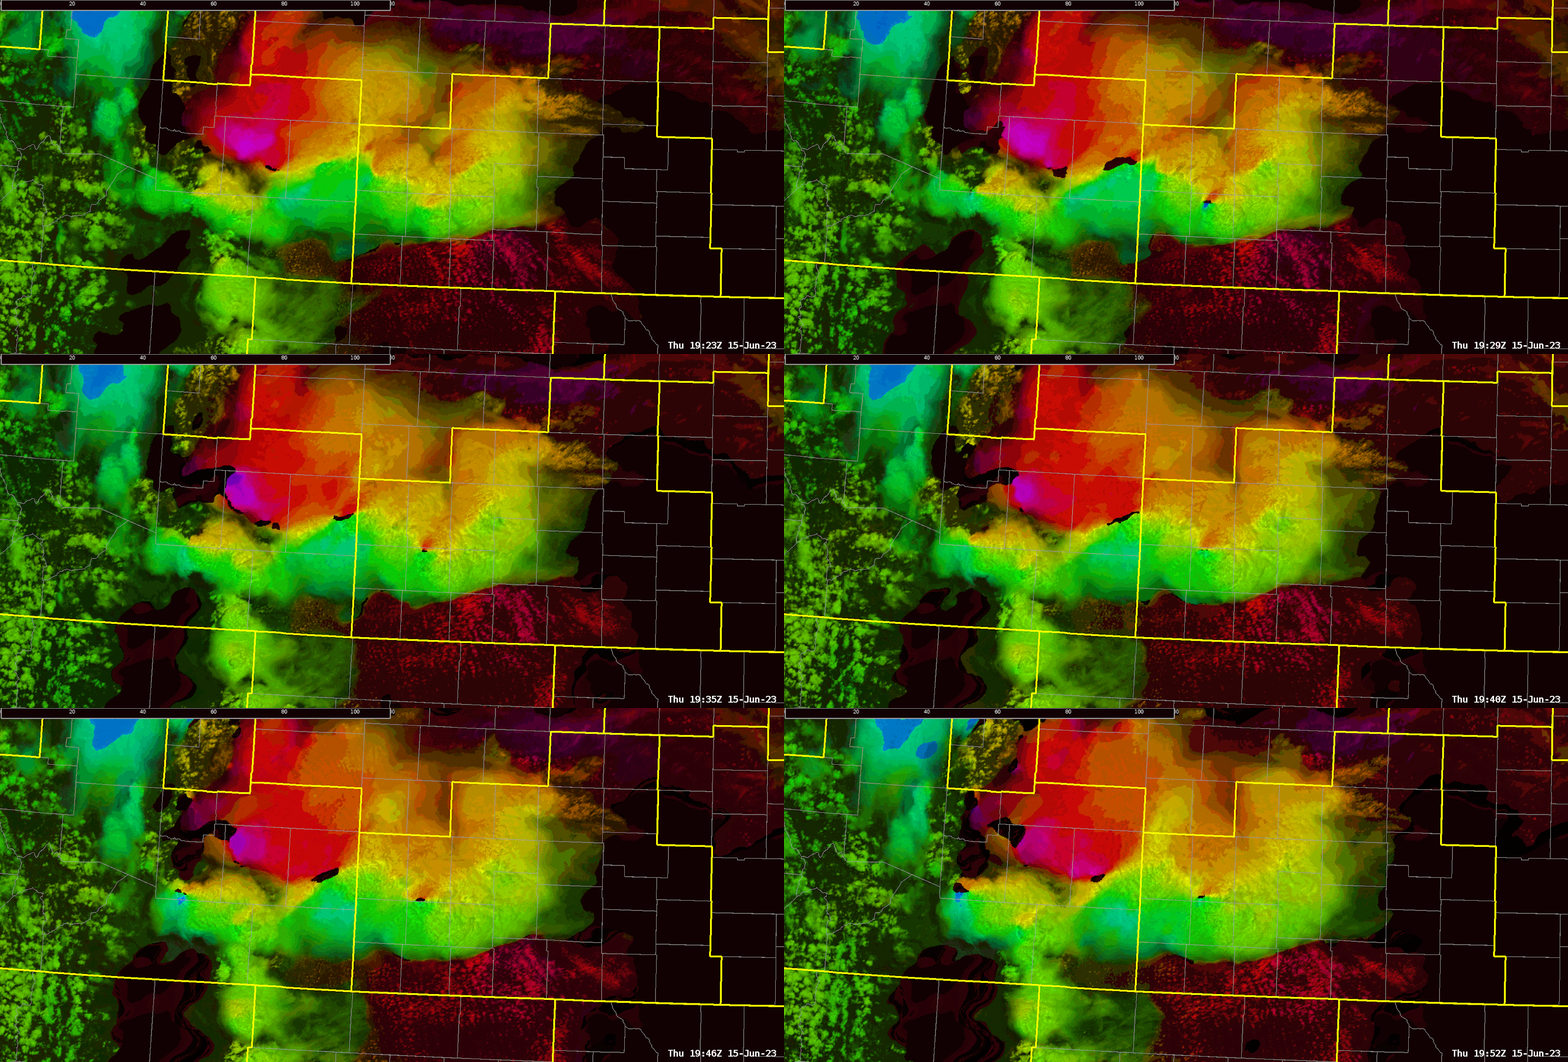
4 Panel with Octane on the top row; appears to be two distinct divergence signatures occurring

Radar Loop of storm splitting shortly after Octane signature…. Notice how the left mover dissipates.

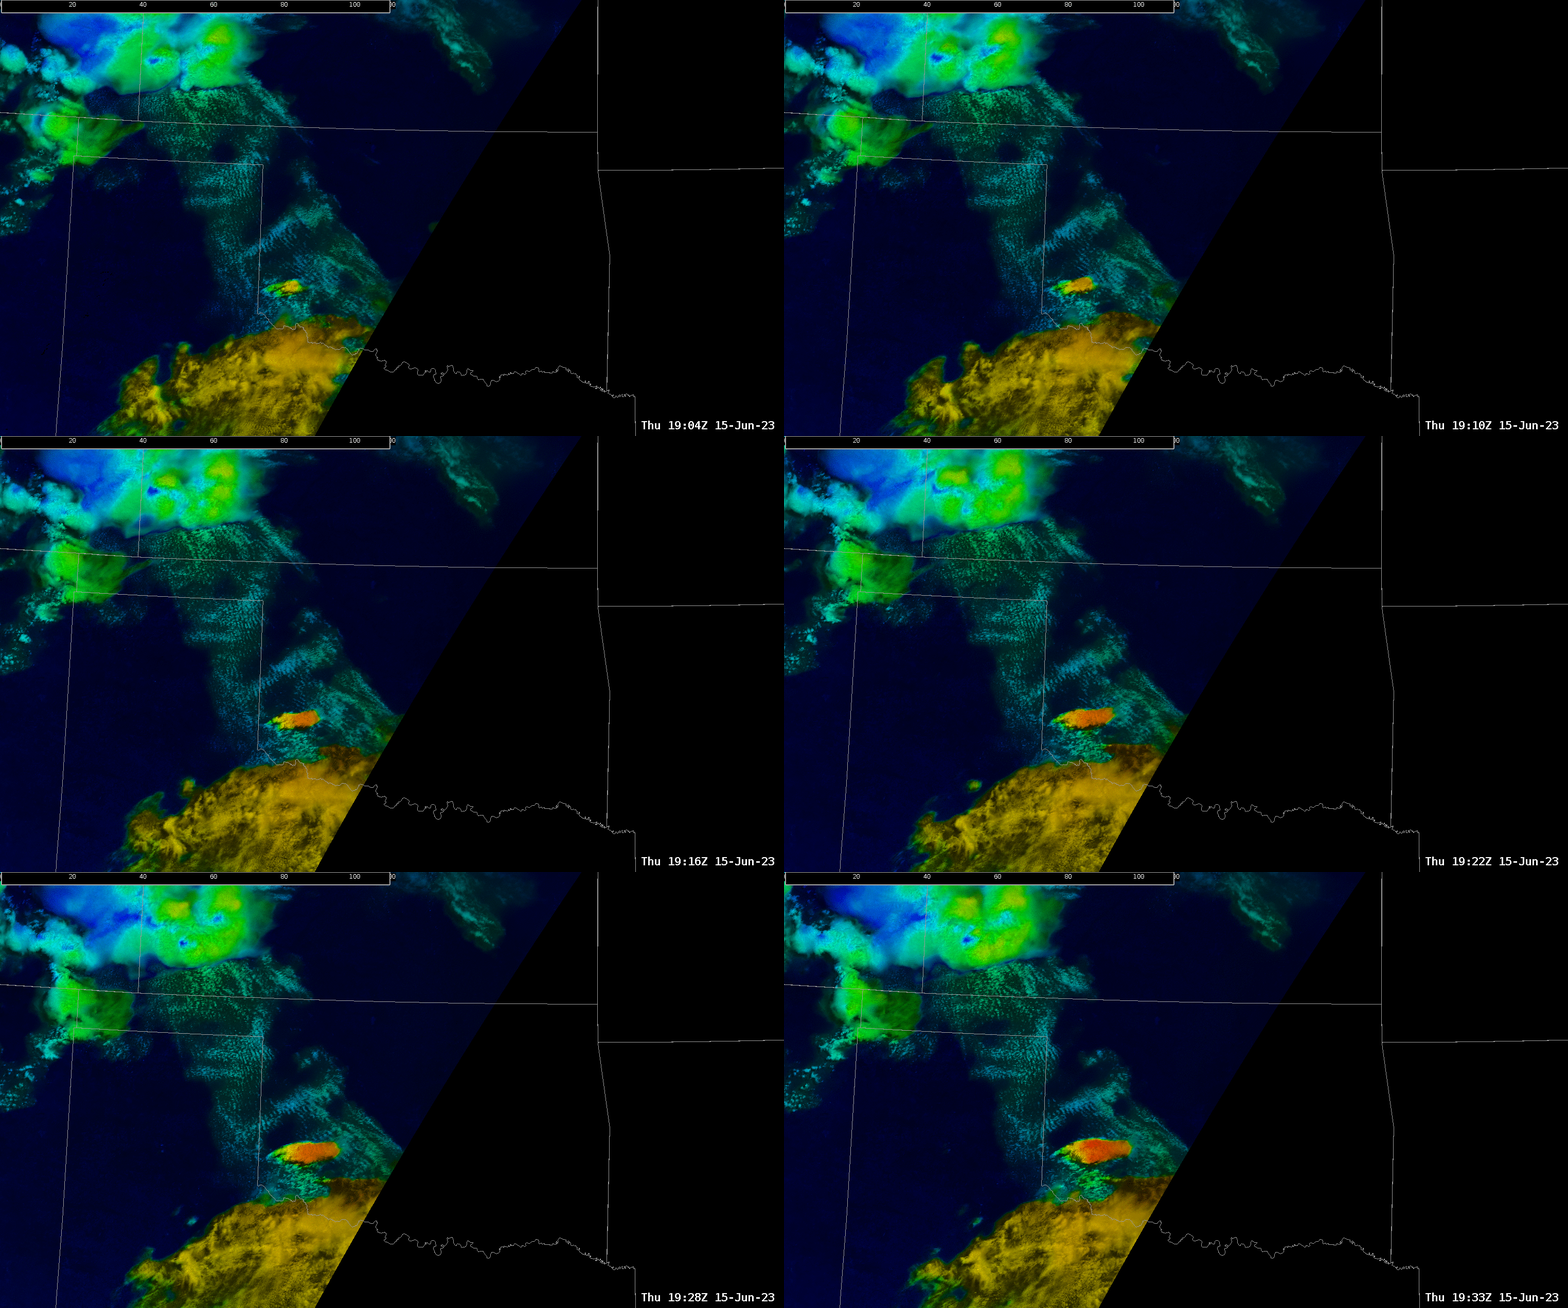
Using the 4 panel with Octane, IR and Day Cloud Phase it was also beneficial to see the upper divergence signature on Octane correlate with the cooling cloud tops of IR and Day Cloud Phase. Although it didn’t seem to create any additional lead time with that aspect; at least that I was able to notice. It was overall a very interesting storm to watch for this experiment.

4 Panel Intensification of storm.  Note the rapid color gradient to blue (upper level divergence)on Octane towards the end of the loop.

Radar loop around the same time as the 4 panel above   

- Tor Nader

6/15/23 HWT - AMA

 What appears to be a nice distinction between sheared / lesser sheared convection across the Octane window. Stronger shear across SW OK producing much different appearance versus SW KS convection.  Nice quick visual distinction for operational use. The idea of a quantifiable divergence contour and/or grid would be welcome also.

Octane data from Goes west meso sector was zoomed in along the inflow region across the SW OK supercell (not our CWA but I had to look). The upper right panel is the directional component and the color scale was changed to highlight approximately 210 - 150 degree range. The increasingly warm colors represent a backing of flow at approximately 4.5 kFt. This level of storm integration (if appropriate) would be advantageous to warning operations.

ProbSevere time series plots do not sample. I would like sampling tied to the cursor as in the parent CAVE window. The element assignment within ProbSevere did cause a problem with the time series information with a storm that strengthened on the southern end of a developing line. The storm initially had a defined area for the region of interest but once ProbSevere assigned it to the larger line the probabilities became much less representative. This impacted ProbTor values which were being monitored ahead of an eventual tornado warning in the Tx Panhandle. I was the warning forecaster today and used ProbSevere extensively for my decisions. It is not the deciding factor but it certainly weighs into the decision process.

PHS model output was interesting and the Updraft Wind element was noted as something not usually seen with model output. It was viewed initially but I didn’t monitor the model output once storms developed and warnings were being issued.

NUCAPS forecasts were unavailable until the very end of the operational window. I did view the 19z overpass soundings and found the familiar  trends of errors at the boundary layer when compared to nearby surface observations. This limitation continues to impact my confidence in the product.

- jbm

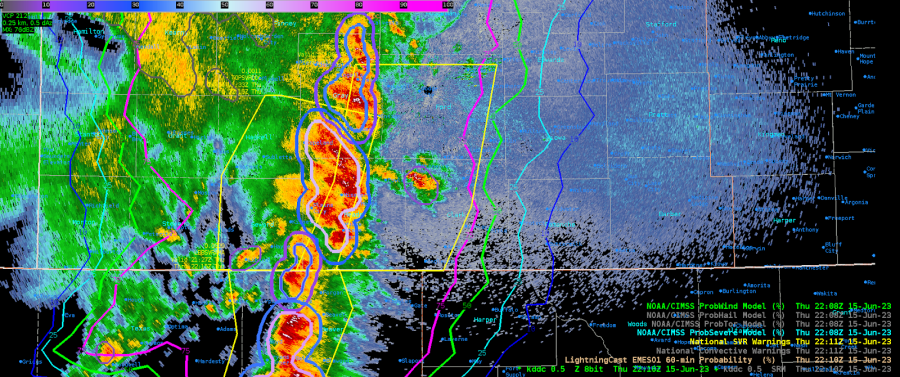
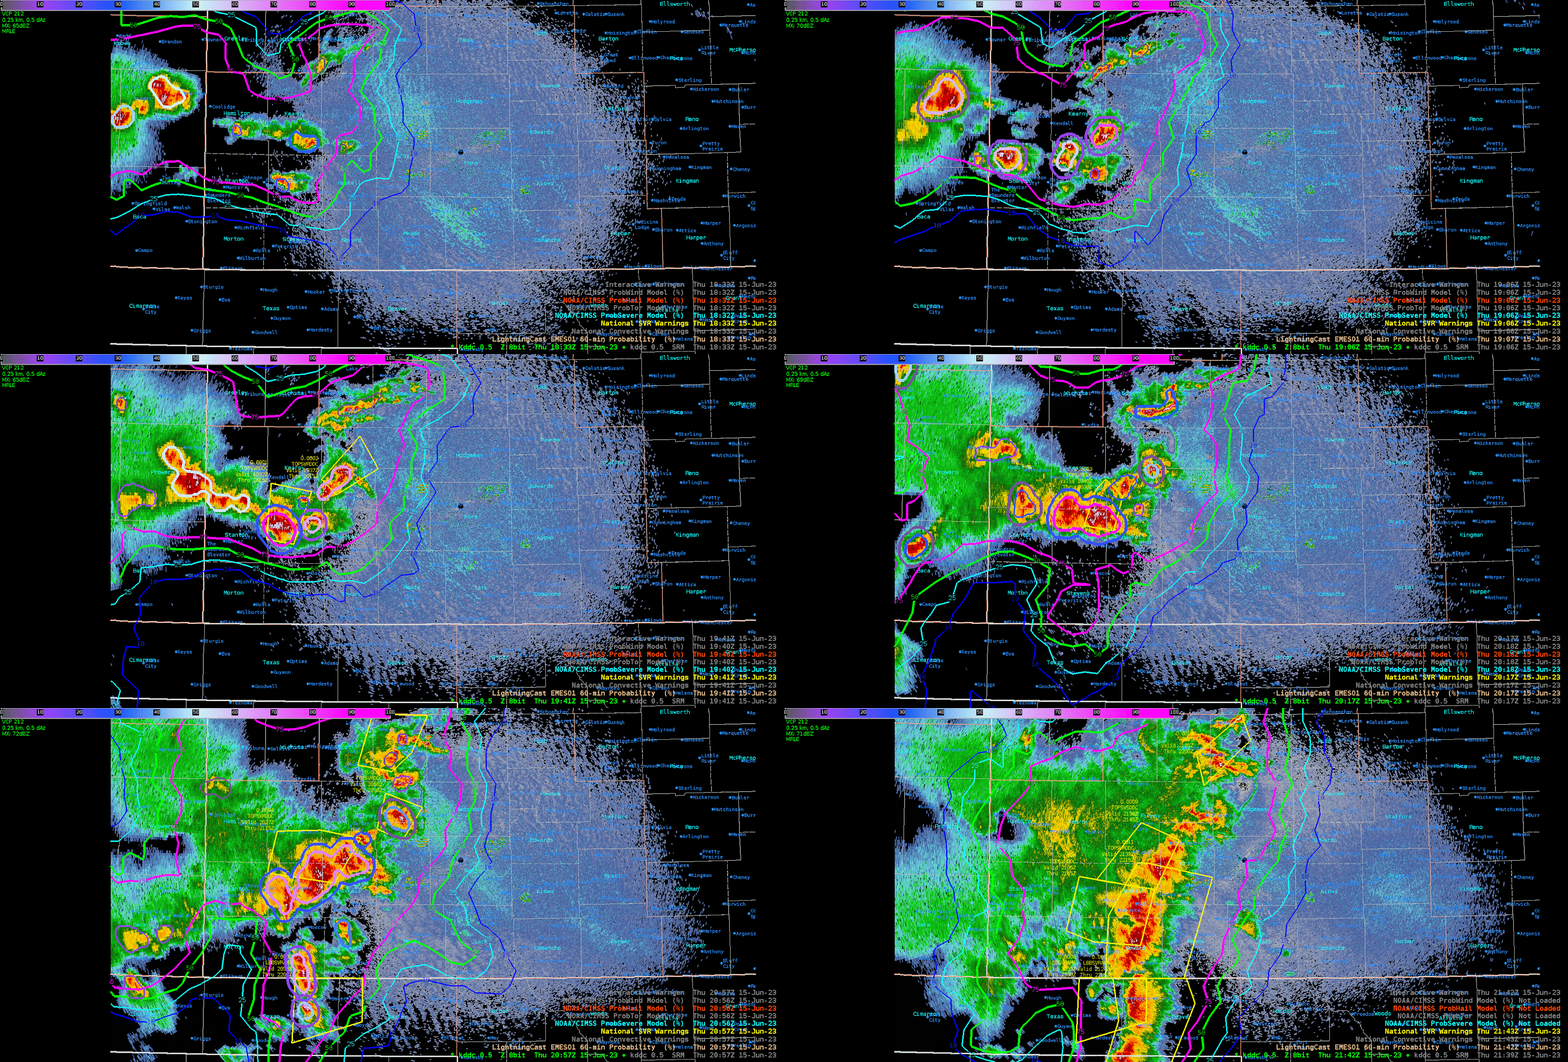
ProbSevere and LightningCast During Severe Warning Operations

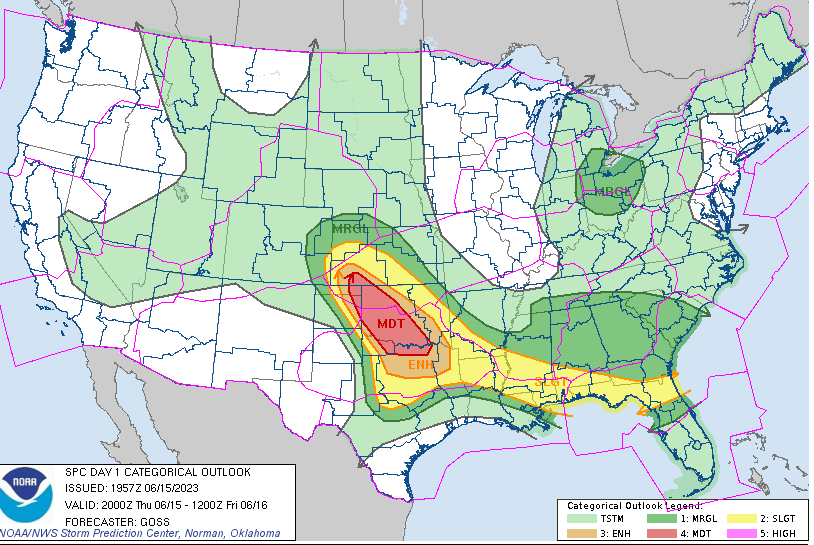
 A moderate risk for severe storms was forecast for the Southern Plains with hail, wind, and tornadoes as significant threats.  Storms quickly initiated in southwest Kansas (See Figure 2) and were ongoing when the testbed started at around 19z. Primarily used during warning operations were ProbSevere, LightningCast, and radar. Thrown in for good measure I used OCTANE to aid in storm motion and direction.  ProbSevere was helpful in issuing warnings but was vital in assisting in the hail size mentioned in the warning text.

Figure 1: SPC Day 1 Outlook for June 15, 2023.

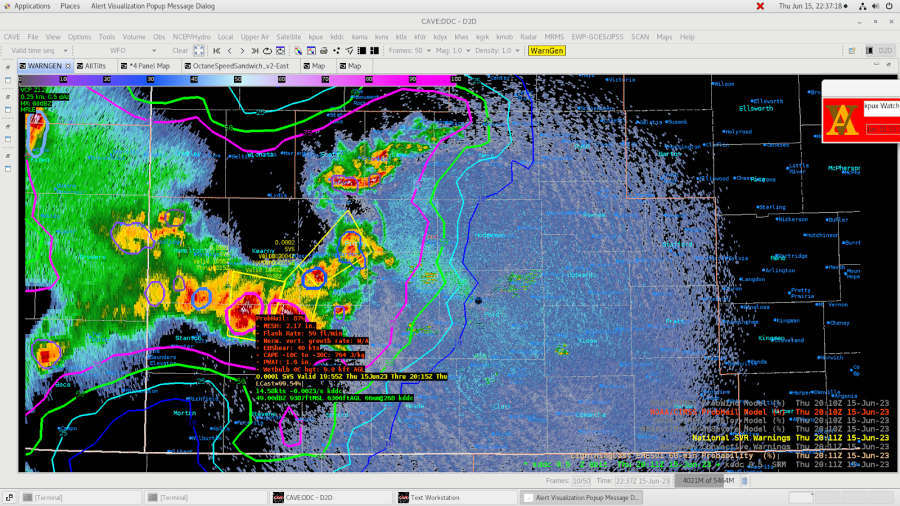
Figure 2: 2011z showing ProbHail with a MESH of 2.17” provided the confidence to mention 2-inch hail in the text.  There were two separate storms that eventually merged later in the afternoon.

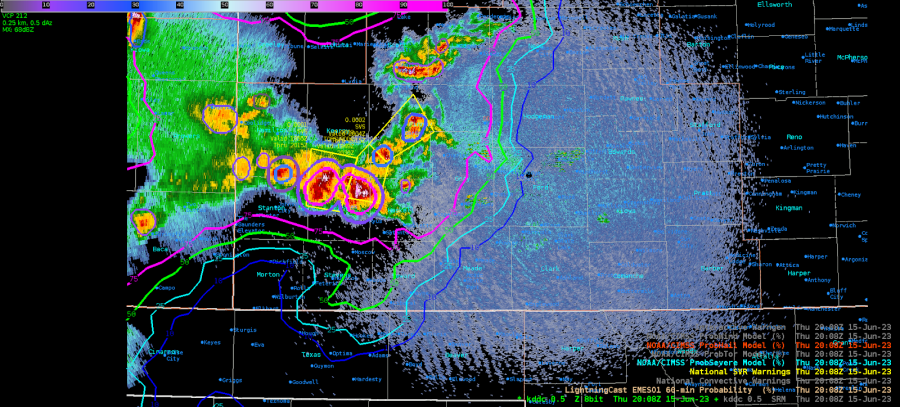
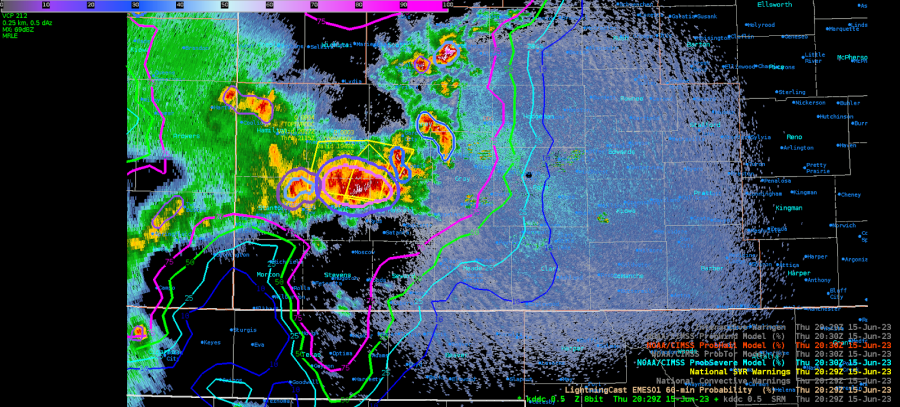
Figure 3: storms were beginning to merge and ProvSevere was as well and thus prompted just one warning instead of two.

Figure 4: New warning with ProbSevere now depicting just one storm.

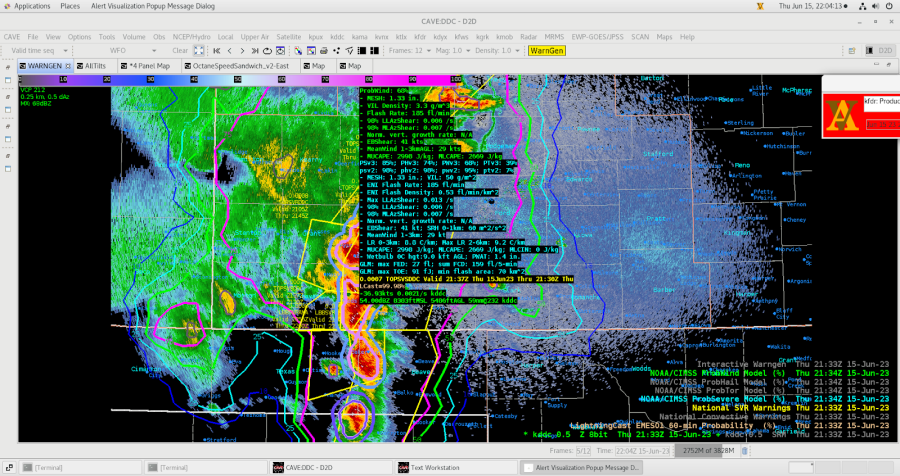
Figure 5: Storms continued to merge and evolved into a wind signature more than a hail producer.  Thus the ProbWind had a nice uptick to 68% at 2133z.  Before this time it never rose bout 40%.

Figure 6: Once the convection evolved into a linear wind producer, LightningCast became helpful in how far east to extend the polygon.  I used the 75% contour and issued a 60-minute warning.

Figure 7: Captured much of the event to show the evolution of convection and ProbSevere.

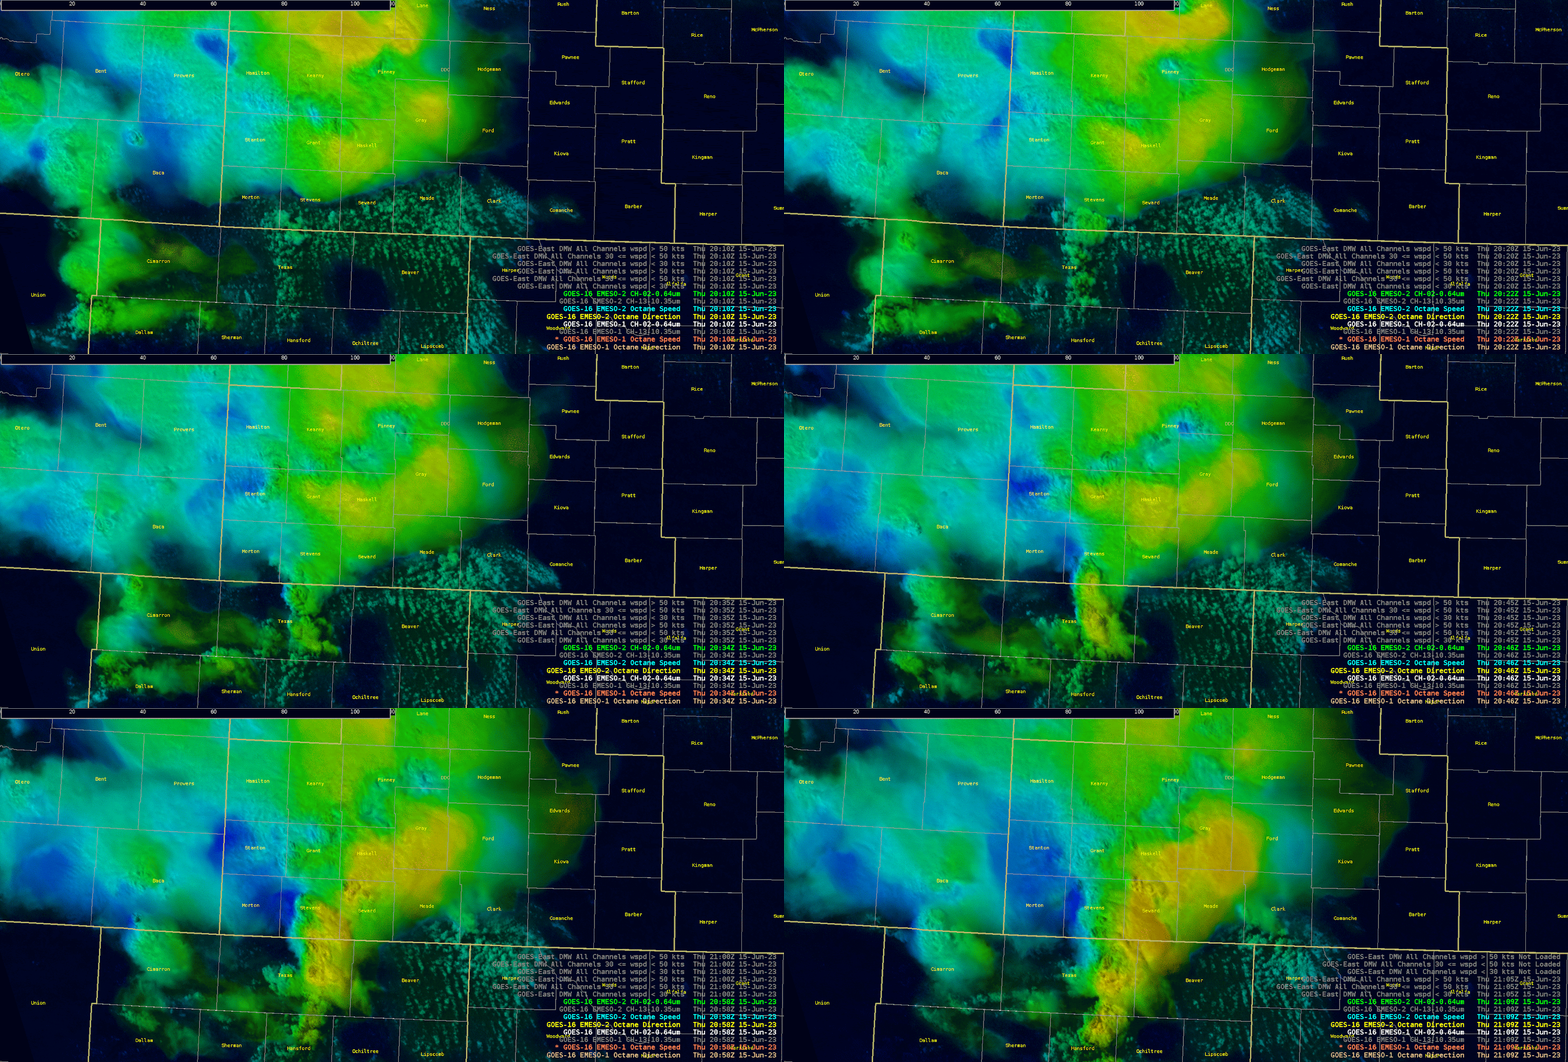
Figure 8: OCTANE aided in determining the area of cell merger in southern Grant and portions of Stevens Counties. 

- Podium       

Wednesday, June 14, 2023

Probsevere and Octane

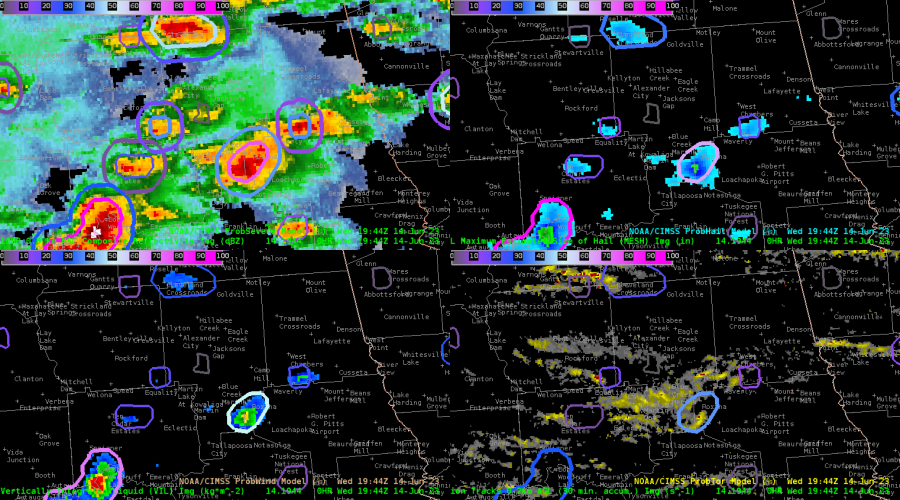
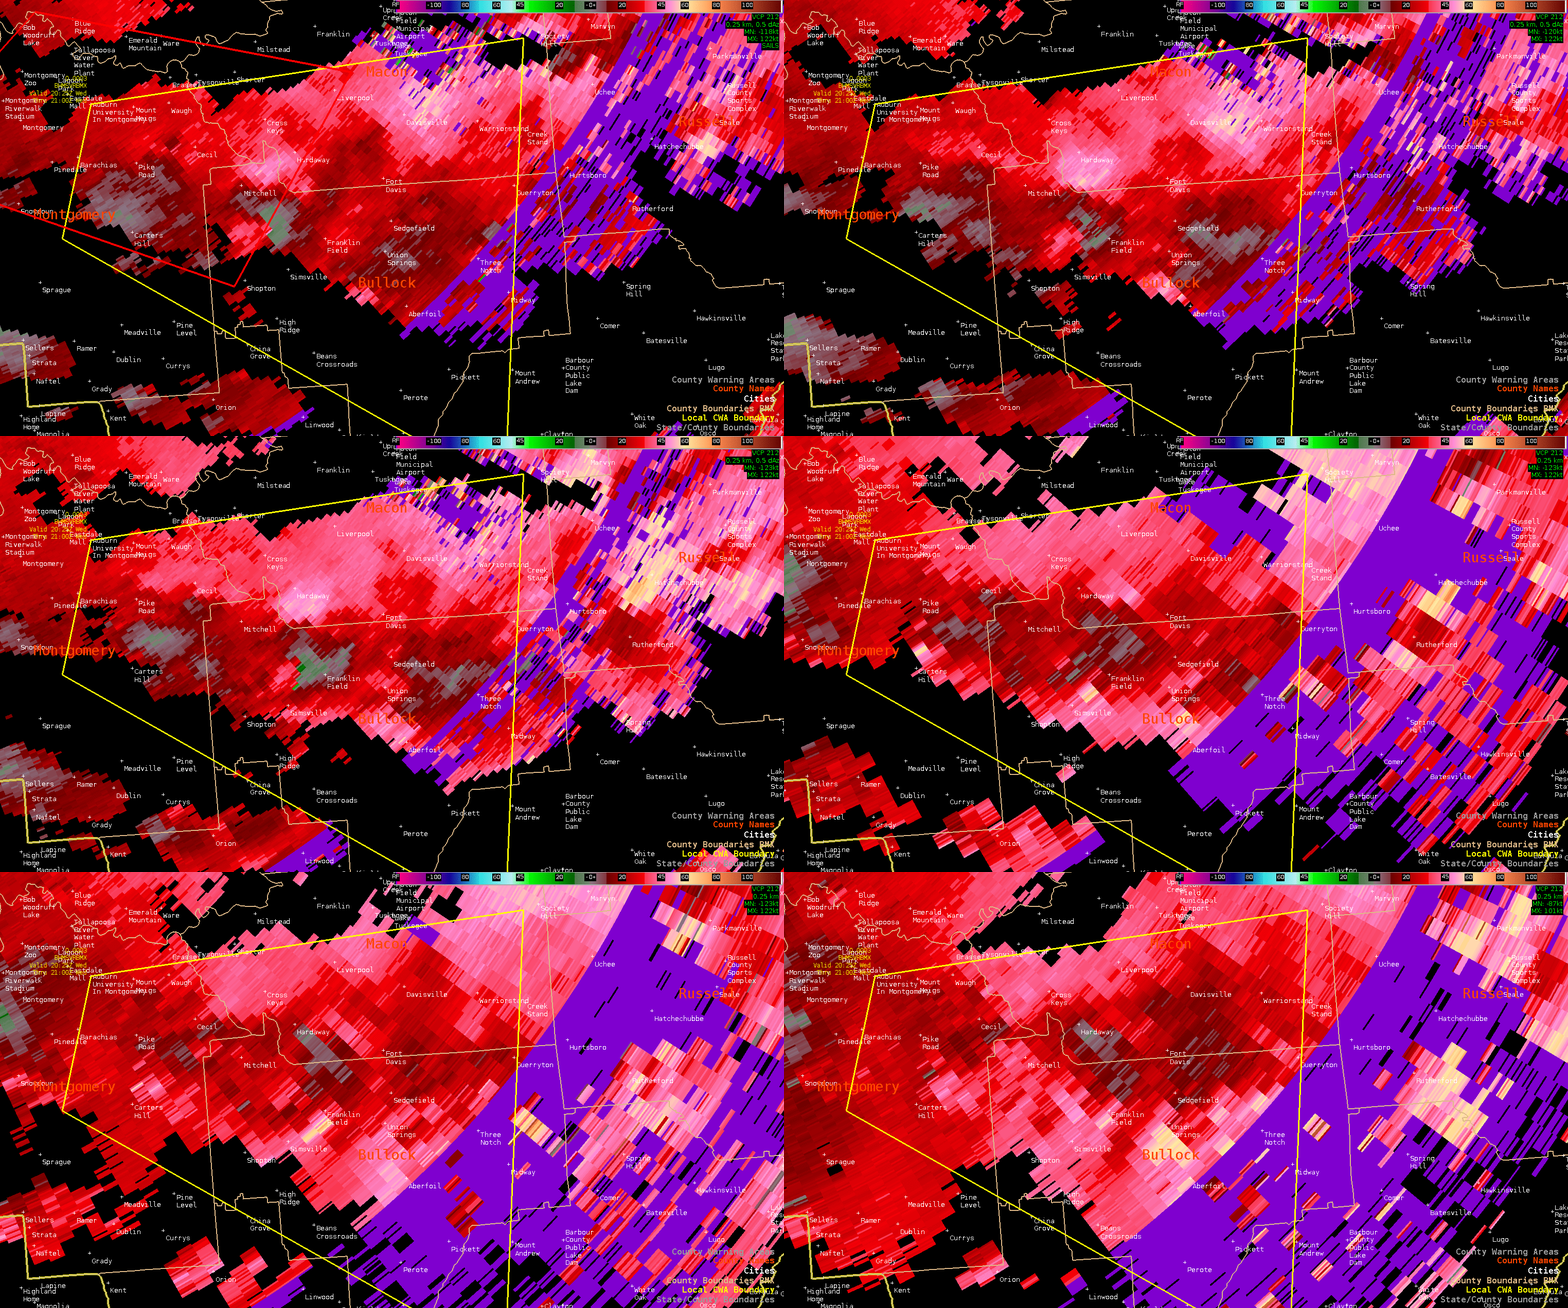
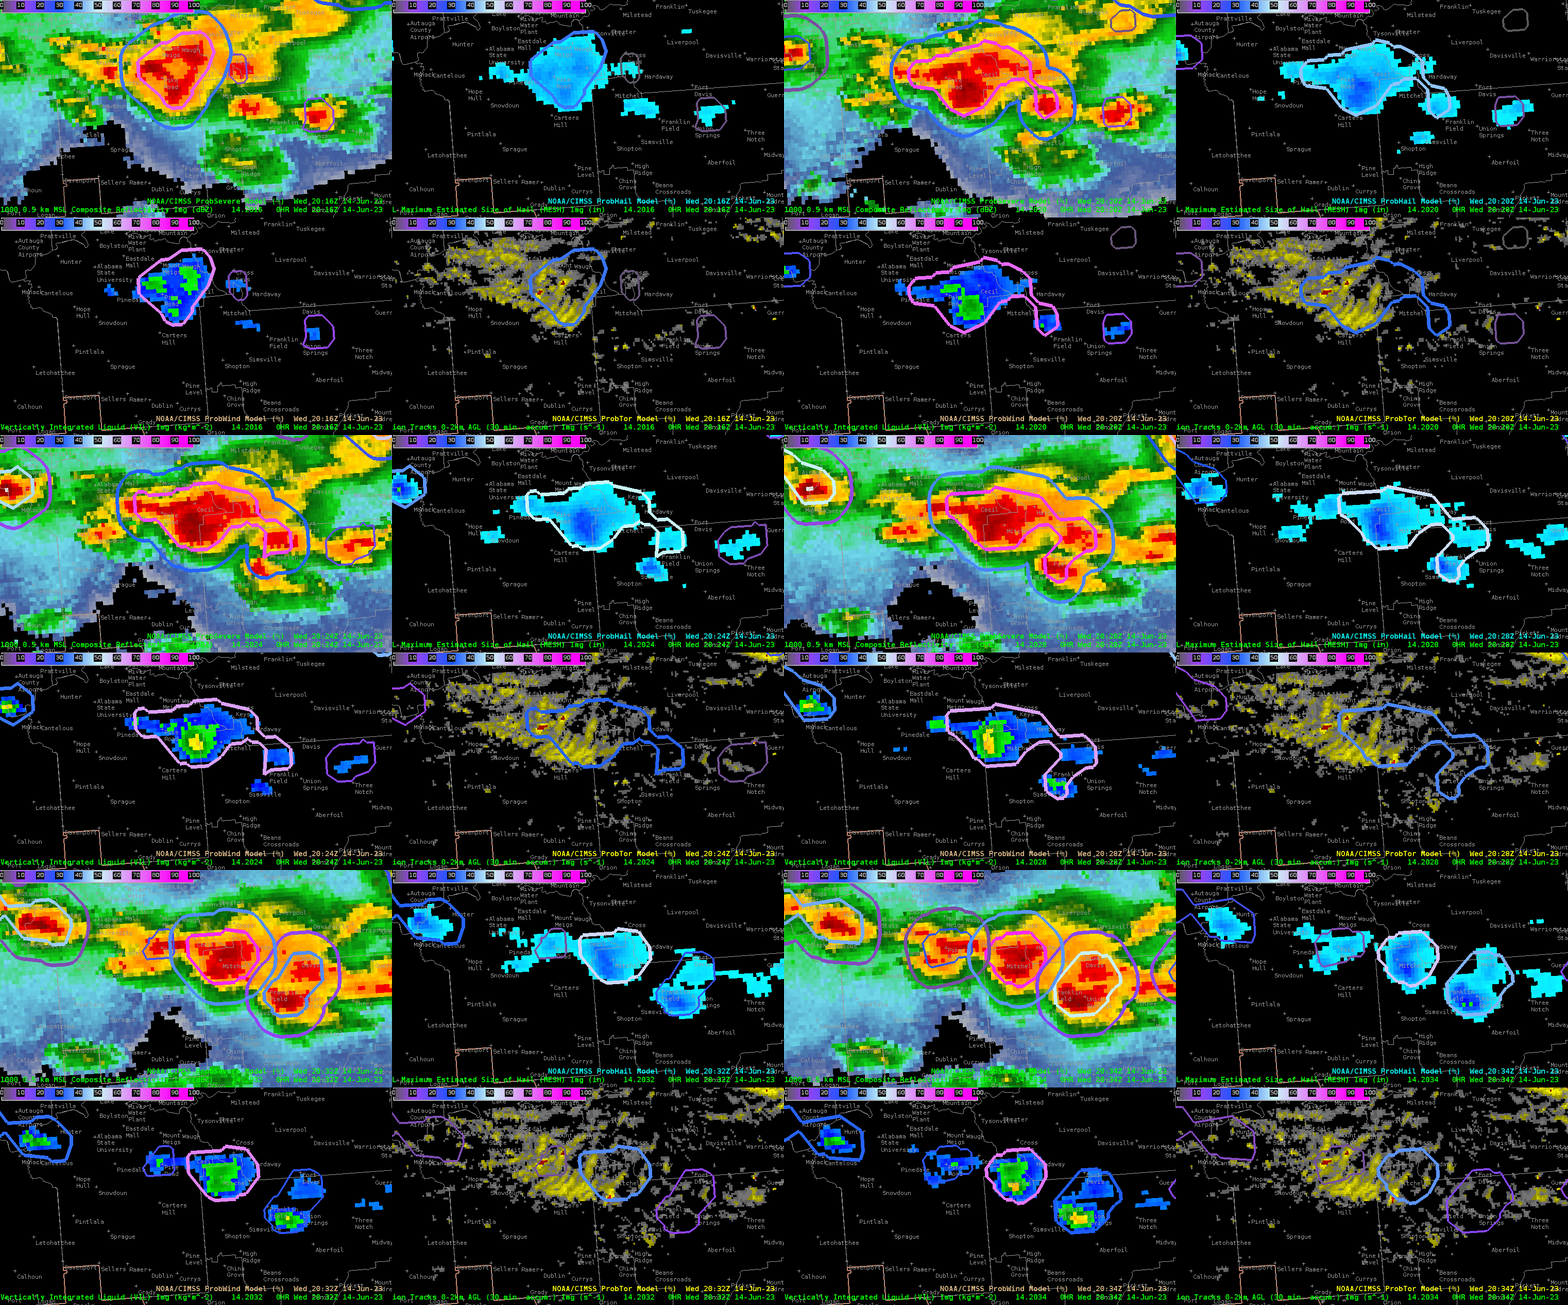
Widespread severe storms have been ongoing over portions of the southeast CONUS nearly all afternoon. ProbTor was doing a decent job with picking up on a couplet in Montgomery county Alabama around 1950Z. Overall it seemed that ProbTor V3 was giving higher tornado probabilities than V2. It was noted that V3 is based off of the HRRR whereas V2 is based off of the RAP. So that was rather interesting to me that the HRRR was potentially picking up on better areas of rotation.

Image of ProbSevere with ProbTor in the bottom left

Loop of tight couplet that ProbSevere V3 was picking up on

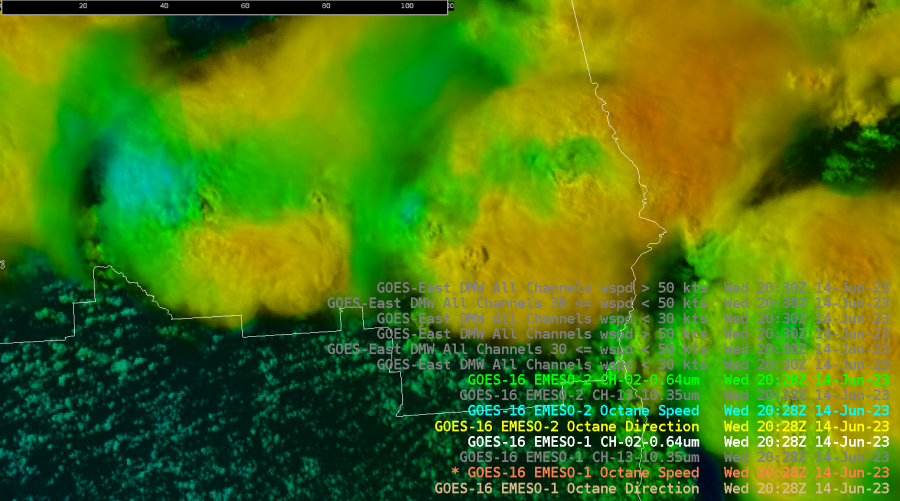
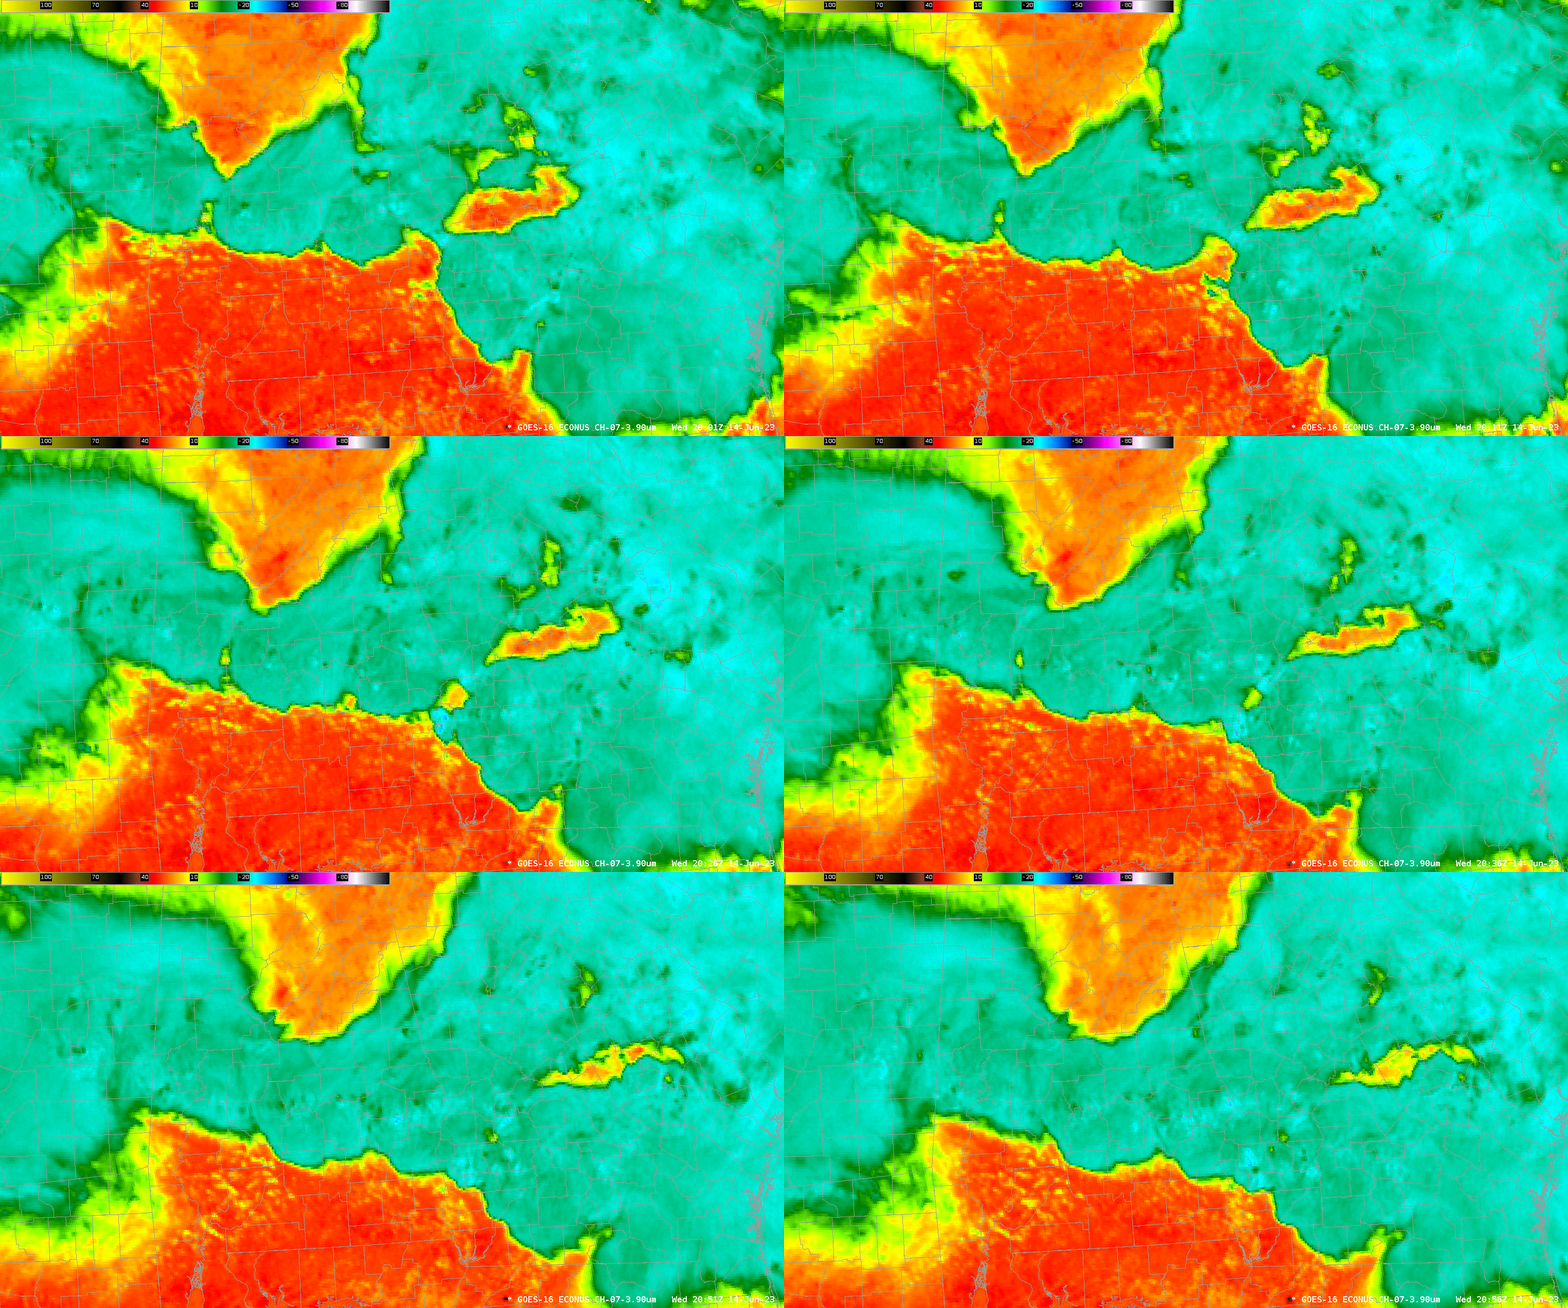
The other really interesting feature I noticed on the part of Octane. The Octane vertical divergence fields which is noted by a sharp gradient of blue in the coloring. This was occurring around the same times as cooling cloud tops that were seen on IR imagery. This also seemed to be a precursor to when storms began to intensify on radar. Along with that intensification was when a better couplet began appearing on radar and an increase in ProbTor V3. Overall I thought that those three correlations were rather neat to see in real time. If this correlation does continue to show up then this has the potential to be another important feature of the Octane product.

Loop of Probsevere with intensifying cluster of storms

Still image of Octane showing the “Blue” Divergence aloft features

Loop of cooling cloud tops via IR

- Tor Nader    

6/14/23 HWT - SHV

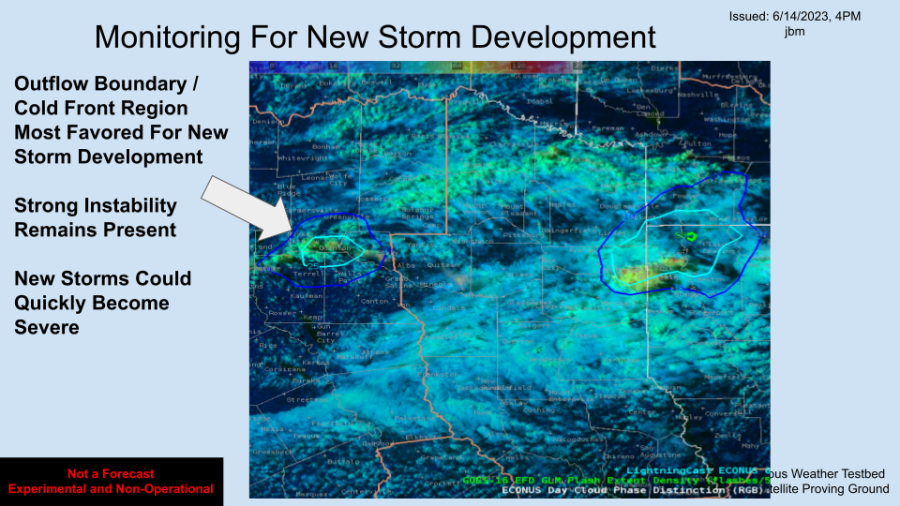
 Operational window encompassed ongoing severe storms at the start of the period which moved eastward out of the CWA by mid afternoon. The resultant outflow boundary / cold front intersection to the west of the CWA become the focus regions for potential for renewed storm development.

NUCAPS 6/14/23 19z sounding south of the outflow boundary of interest compared to nearby surface observation showed a large discrepancy in observed surface conditions (90/72 at nearby ASOS). This raises considerable questions on how these soundings are to be best utilized in operations.

OCTANE was useful in monitoring the attempted updrafts along the outflow boundary. It seems to show updraft growth more clearly than the day cloud phase product. I would like to see these data incorporated into the LightningCast model as this product is also very good at highlighting potential areas for CI.

OCTANE output was also viewed  in a region of a splitting supercell across western AR. Good conversation with developers on further development of the wind retrievals with observational data constructed hodographs being an operational request.

Utilized LightningCast to highlight the region of concern for new storm development. The storms did develop but it was a more gradual evolution. The highlighted region did verify as the region of development.

ProbSevere did a great  job as a safety net for radar warning operations. The element trend window is a helpful addition.  Talked with the developer on potential marking times along the time series where the element changes ID or grows in area to show when ProbSevere has merged or separated elements as this impacts resultant probabilities.

PHS model output from the 16z run was viewed online and compared to the corresponding HRRR. At the time of the exercise conclusion its solution had verified better on composite reflectivity than did the HRRR. A product in AWIPS highlighted regions where the fusion data is different than a zero hour model output would be beneficial for situational awareness and potentially for model output utilization.

- jbm