Showing posts with label Optical Flow Winds. Show all posts

Friday, June 17, 2022

Observations from BUF on Thursday June 16th

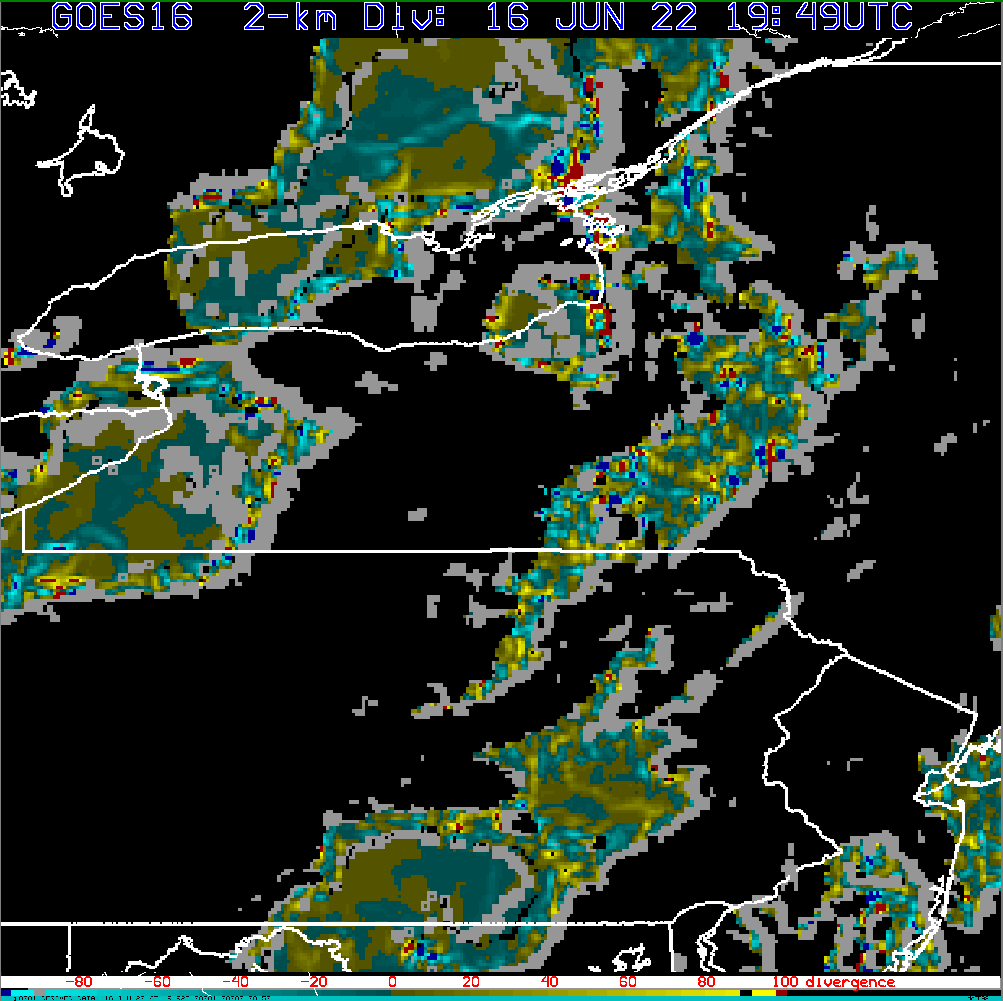
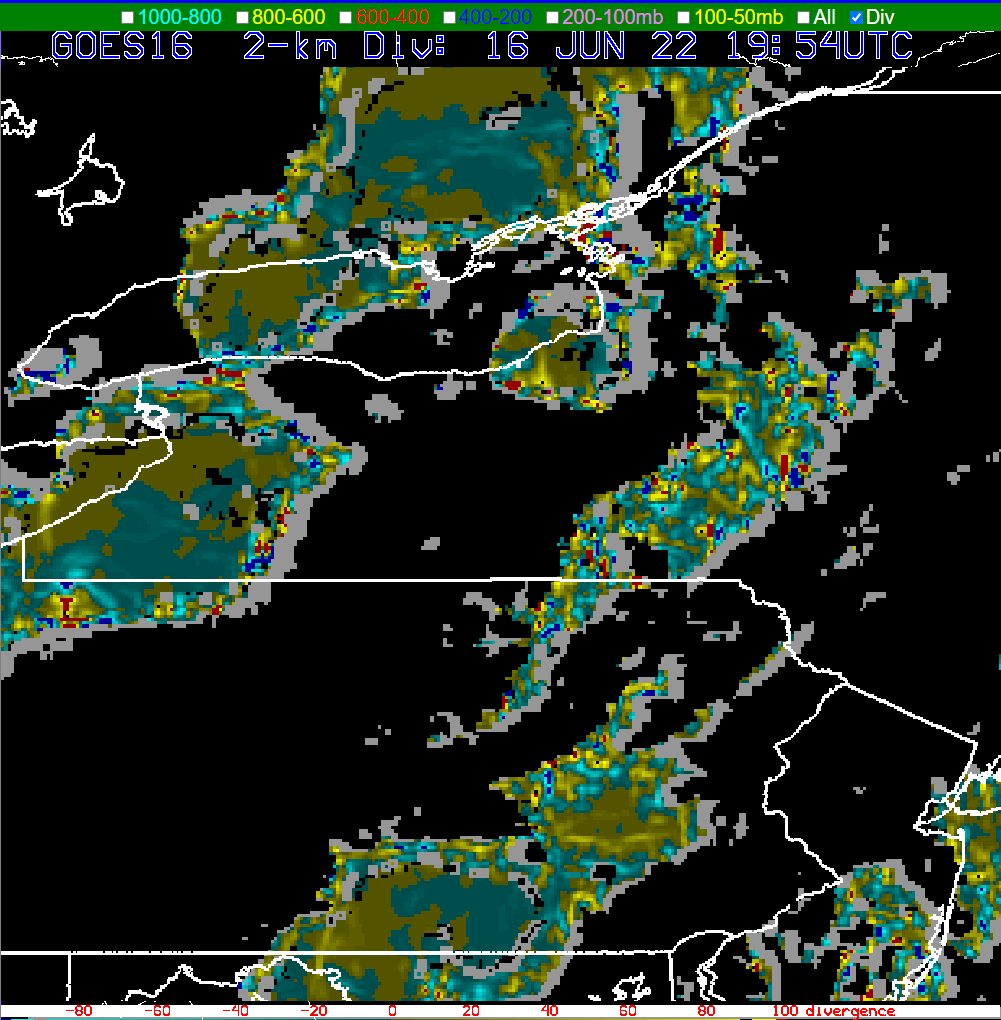
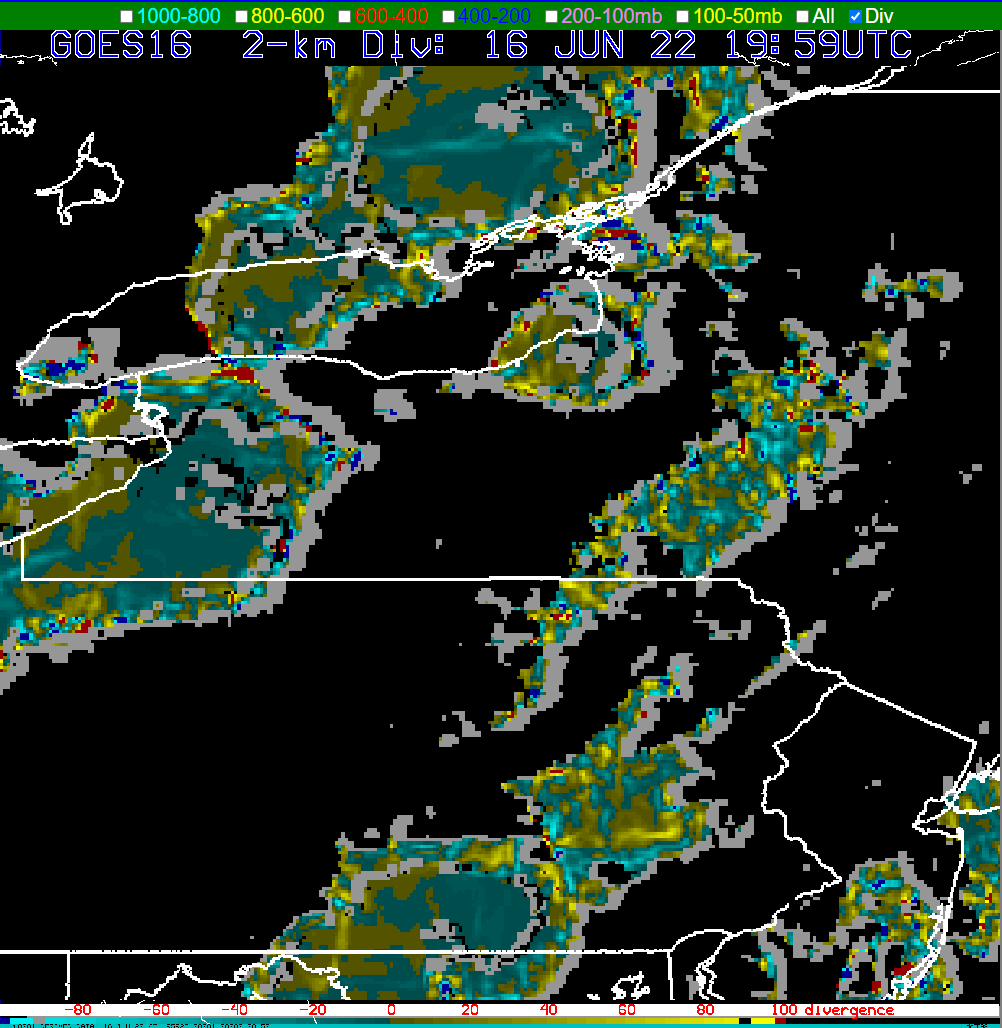
 Optical Flow Wind Storm Top Divergence Can Aid in Warning Operations

The storm of the day produced a 2.5” hail stone near Cato, NY.
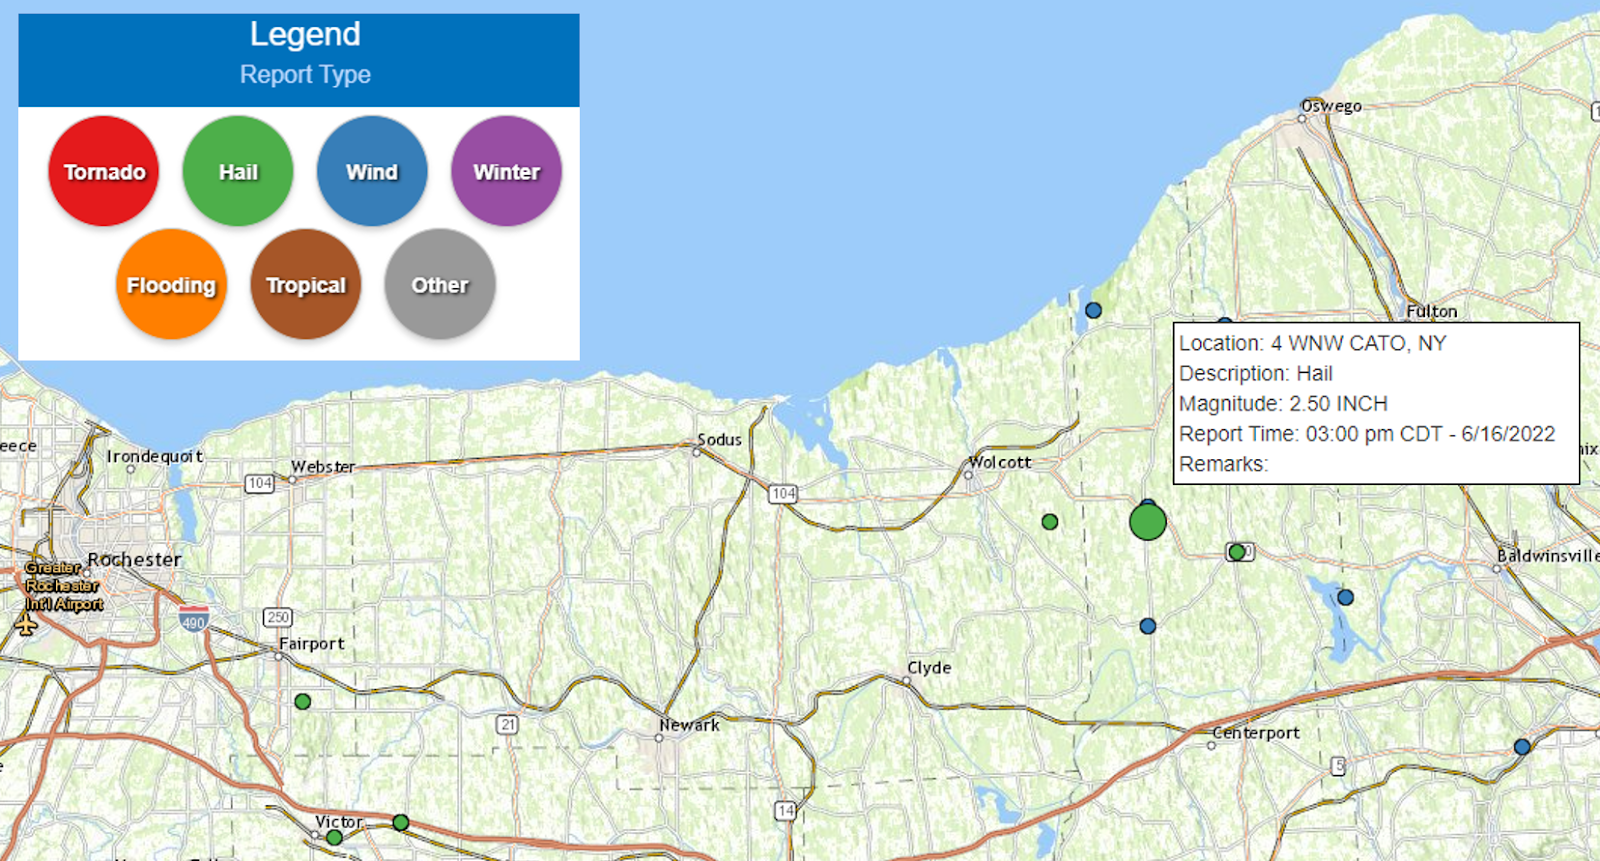
Strong storm top divergence signals an intense or intensifying thunderstorm. Matched with upper level radar scans, satellite interrogation (clean IR), and ProbSevere, optical flow wind products may be another tool to aid the warning forecaster and/or storm scale mesoanalysis,  Below are the corresponding optical flow wind storm top divergence images approaching 4 PM EDT (3 PM CDT) when the sig severe hail was reported. The thunderstorm of interest is centered just south of eastern Lake Ontario.
LightningCast as Graphical Messaging/IDSS Tool

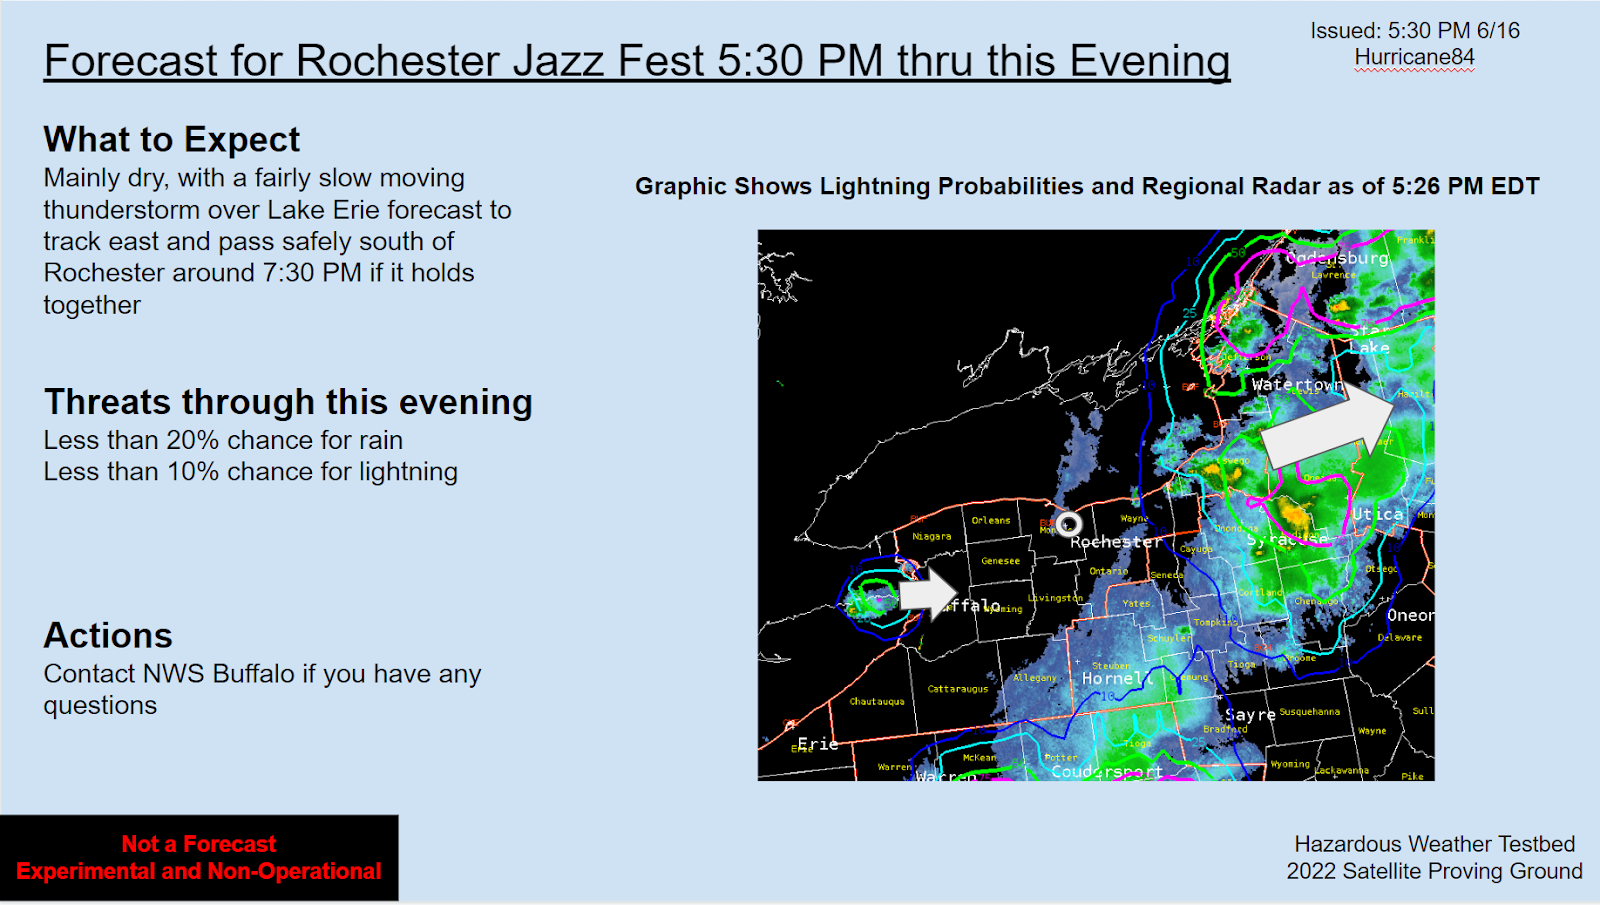
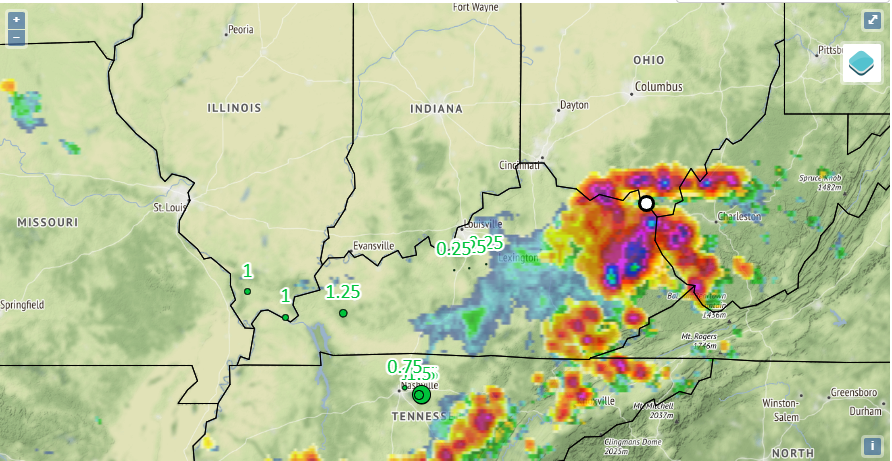
As the DSS and graphics person for BUF, I took the opportunity to highlight the utility of LightningCast for Graphical NowCasts and DSS graphics. The fairly broad brushed nature of the lightning probability contours at the timesteps utilized for graphics I think is a positive for a few reasons: they show actionable probabilities (10+, 25+, 50+, 75+) that users can understand; the contours are akin to annotations on a radar graphic, so would be a time saver; and finally, broad brushed is a way to prompt users and partners to seek out more information, like real time zoomed in radar data, perhaps calling or sending us a chat on NWSChat, or even simply keeping an eye on the sky and listening for thunder. The parallax corrected product in the images below I feel would be more useful for graphics of the nature shown below. Ultimately, for operational use, there would probably need to be some work done to ensure they are not confusing to the user and aesthetically pleasing.
Graphical NowCasts for our websites and social media
Graphic for IDSS Event

A Case for the Sharpened GLM FED Color Scale Used this Week

Over the course of satellite product interrogation this week, the GLM FED stood out as one of the most useful products.  Below are examples from in/near the BUF CWA at 2043z and 2047z. Note that the top of the color scale was set to 128 flashes/5 min over the grid point vs. the default 256 flashes/5 min in AWIPS. The FED also paired well with the MFA and TOE on this 4-pane procedure.

The color curve used this week really popped and correlated well with frequent ENTLN detections. Another example below from shortly after 6 PM EDT (2202 and 2207z)  shows that there will be instances where perhaps an even small color bar range would be useful.
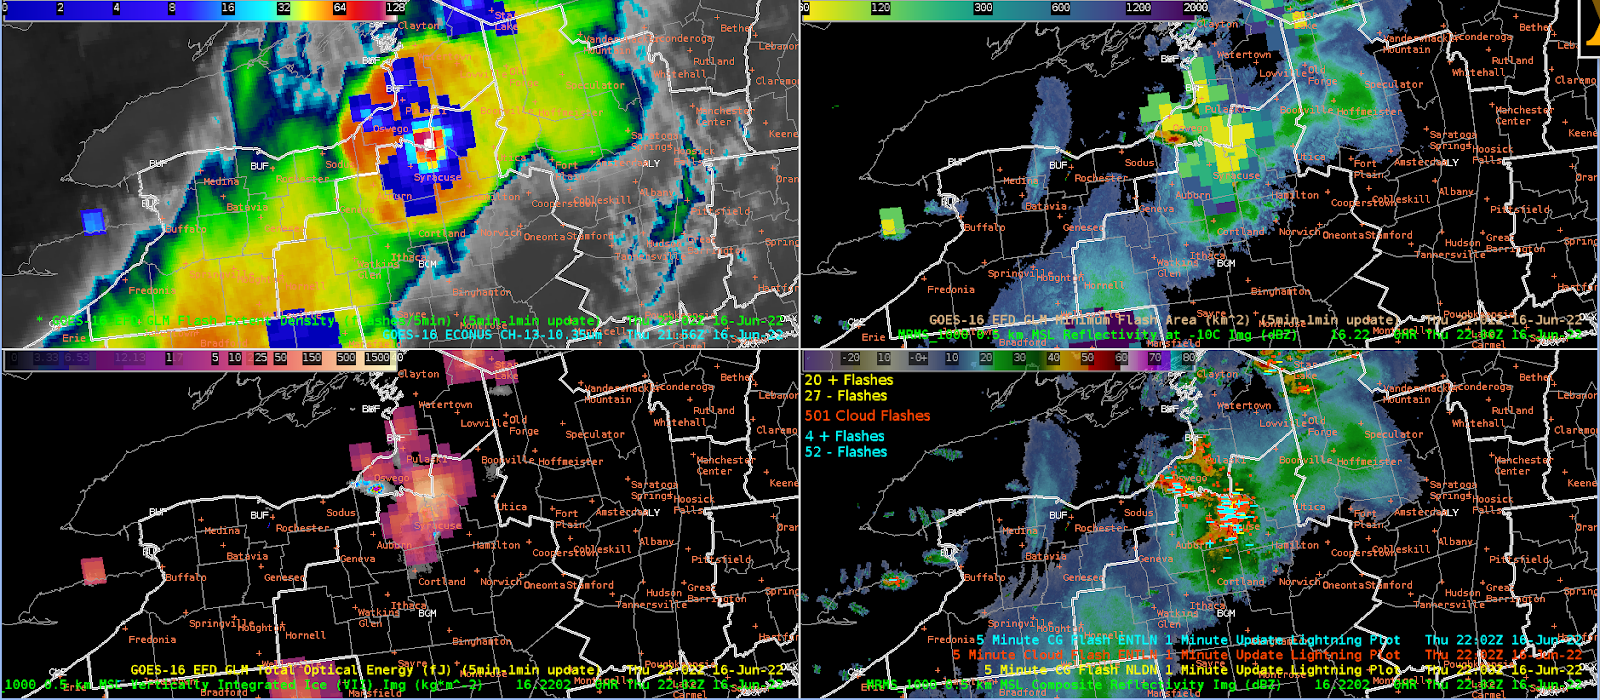
While the strongest storm at this time still showed up well on the AWIPS default color bar range, the 128 flashes/5 min top end of the range (top right) helped it pop even more and corresponded well conceptually with the ENTLN cloud flash detections. Furthermore, the thunderstorms to the north of the strongest thunderstorm showed up better from an SA perspective, if you have been focusing on the strongest storm for warning ops. The smallest color bar range on the bottom left further enhances the above described effect.

Addendum: GLM Flashes and a more smoothed FED

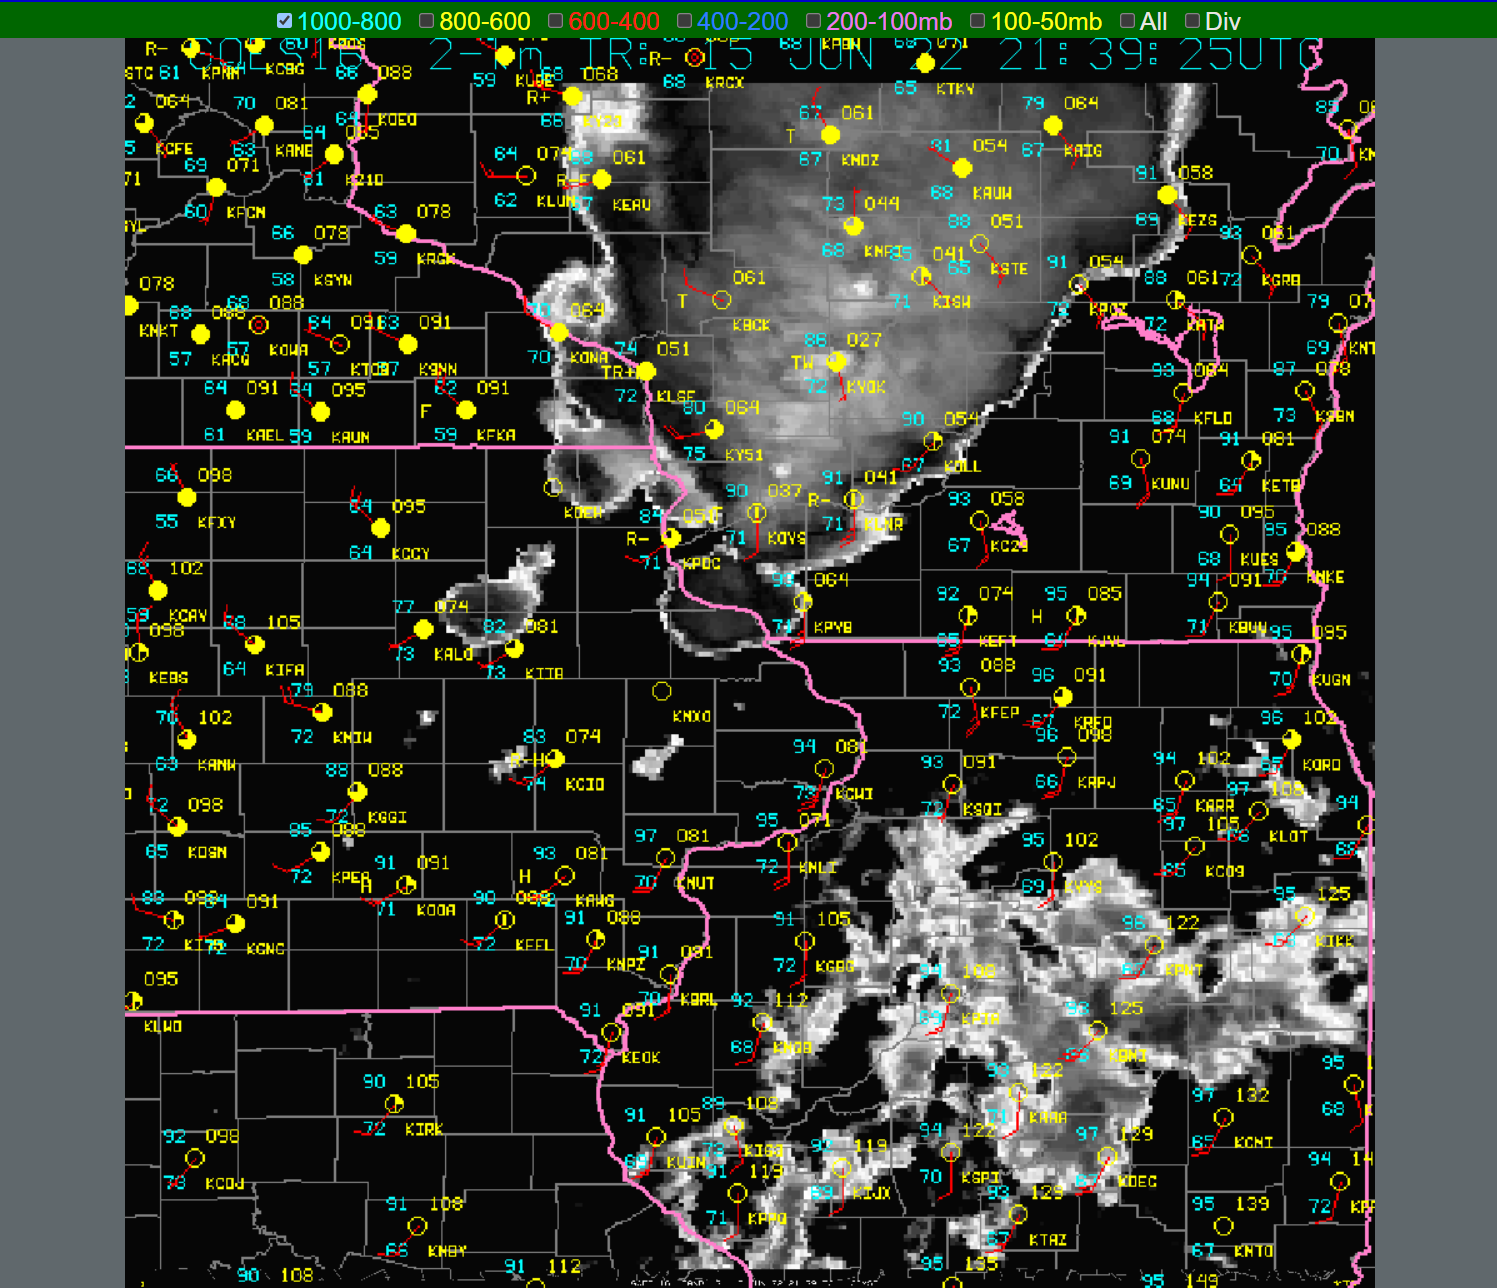
The excellent COD NexLab Satellite and Radar page added within the past year the GLM flash centroids to their GOES derived overlays. From an apples to apples perspective with respect to the ground based lightning detection network displays, this may be a useful product to add into AWIPS.
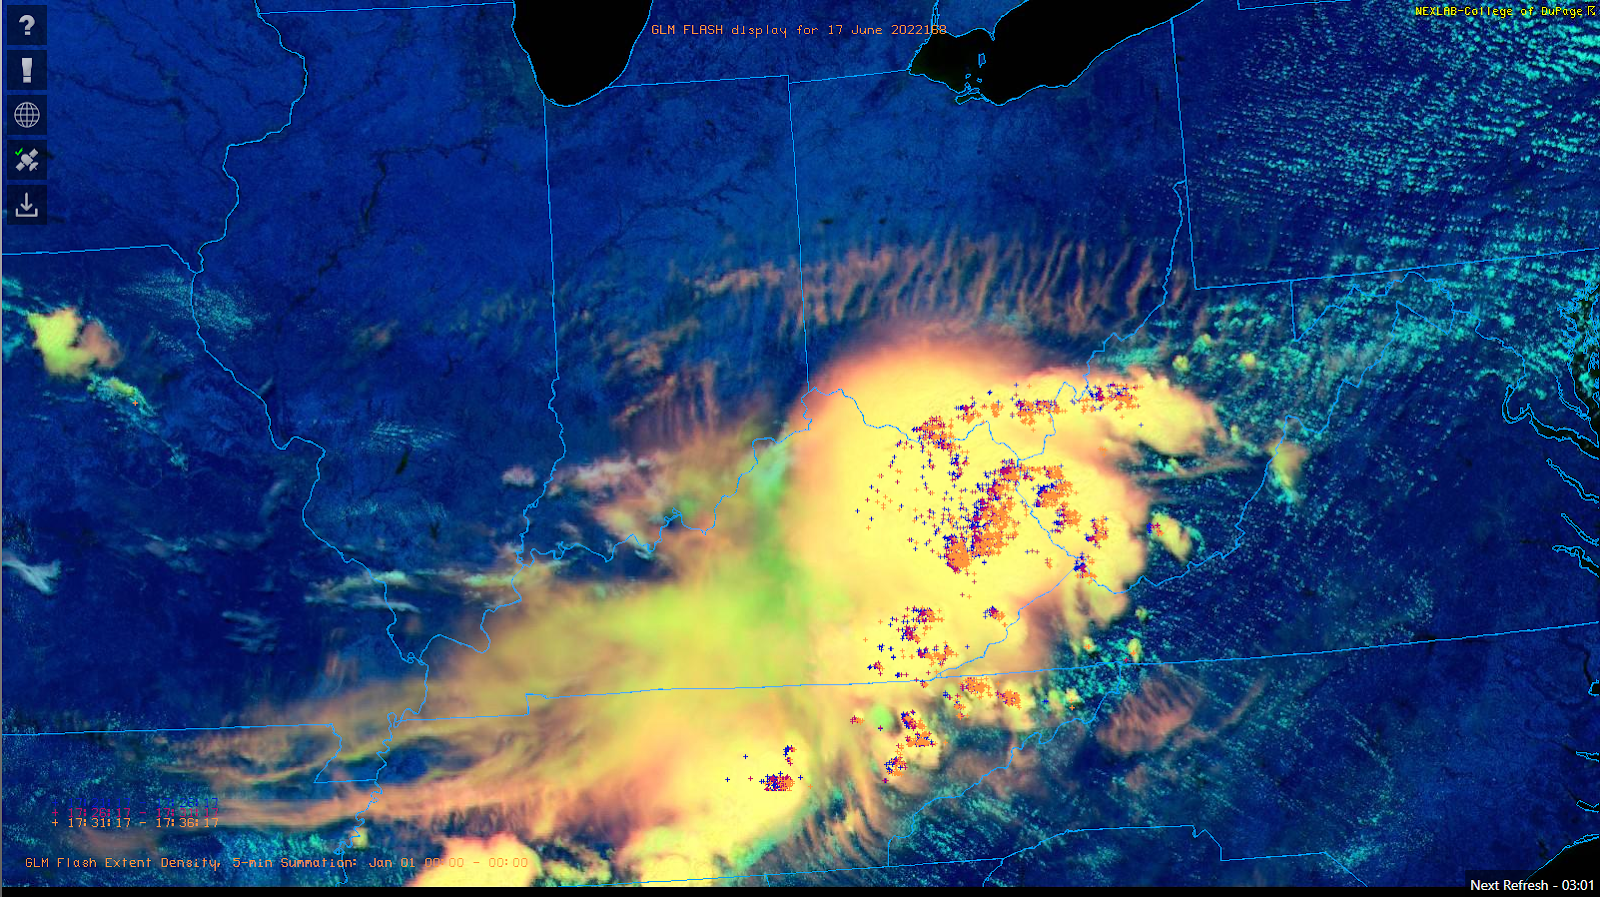
\

Addendum 2: Would a more smoothed FED be preferable?


Below are a few web based examples of FED displays.


A case can be made that these smoothed FED examples would be somewhat less obtrusive than the default AWIPS FED display, especially for storm scale interrogation by the warning operator or storm scale mesoanalyst.


- Hurricane84
Thursday, June 16, 2022

Supercells and Optical Flow Winds

 With the storms moving out of La Crosse’s CWA, I’ve got a bit of time to finally take a look at the Optical Flow Winds.  I’m intrigued by the product to say the least.

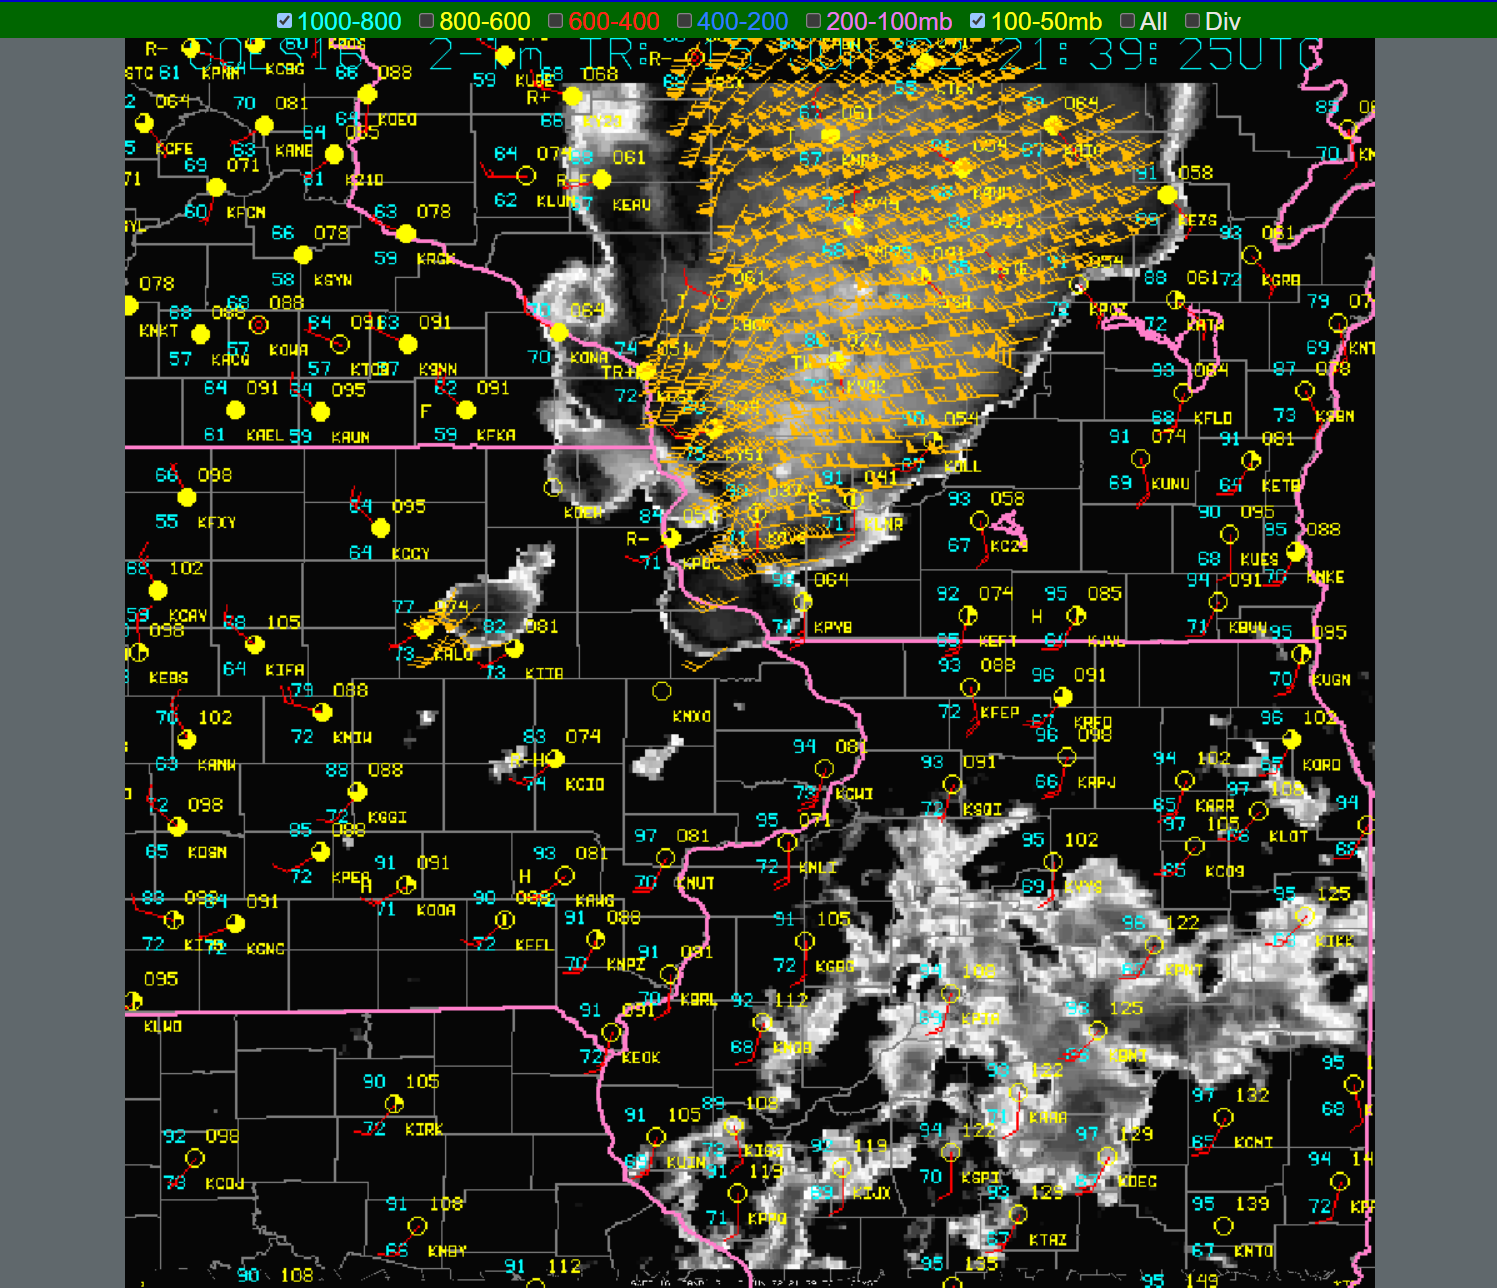
Here is a still image of the GOES-East Meso1 sector today with the string of supercells ongoing (and tail-end charlie in NE Iowa).  One thing I was curious about was how well this could detect storm top divergence.  The radar data was pretty noisy in AWIPS so it was hard to see this in those products.

Here is what the “base” product shows.

Now let’s overlay the upper-level winds as detected by this product (roughly the 100-50 hPa layer although I wouldn’t be surprised if some storm tops are going above this:

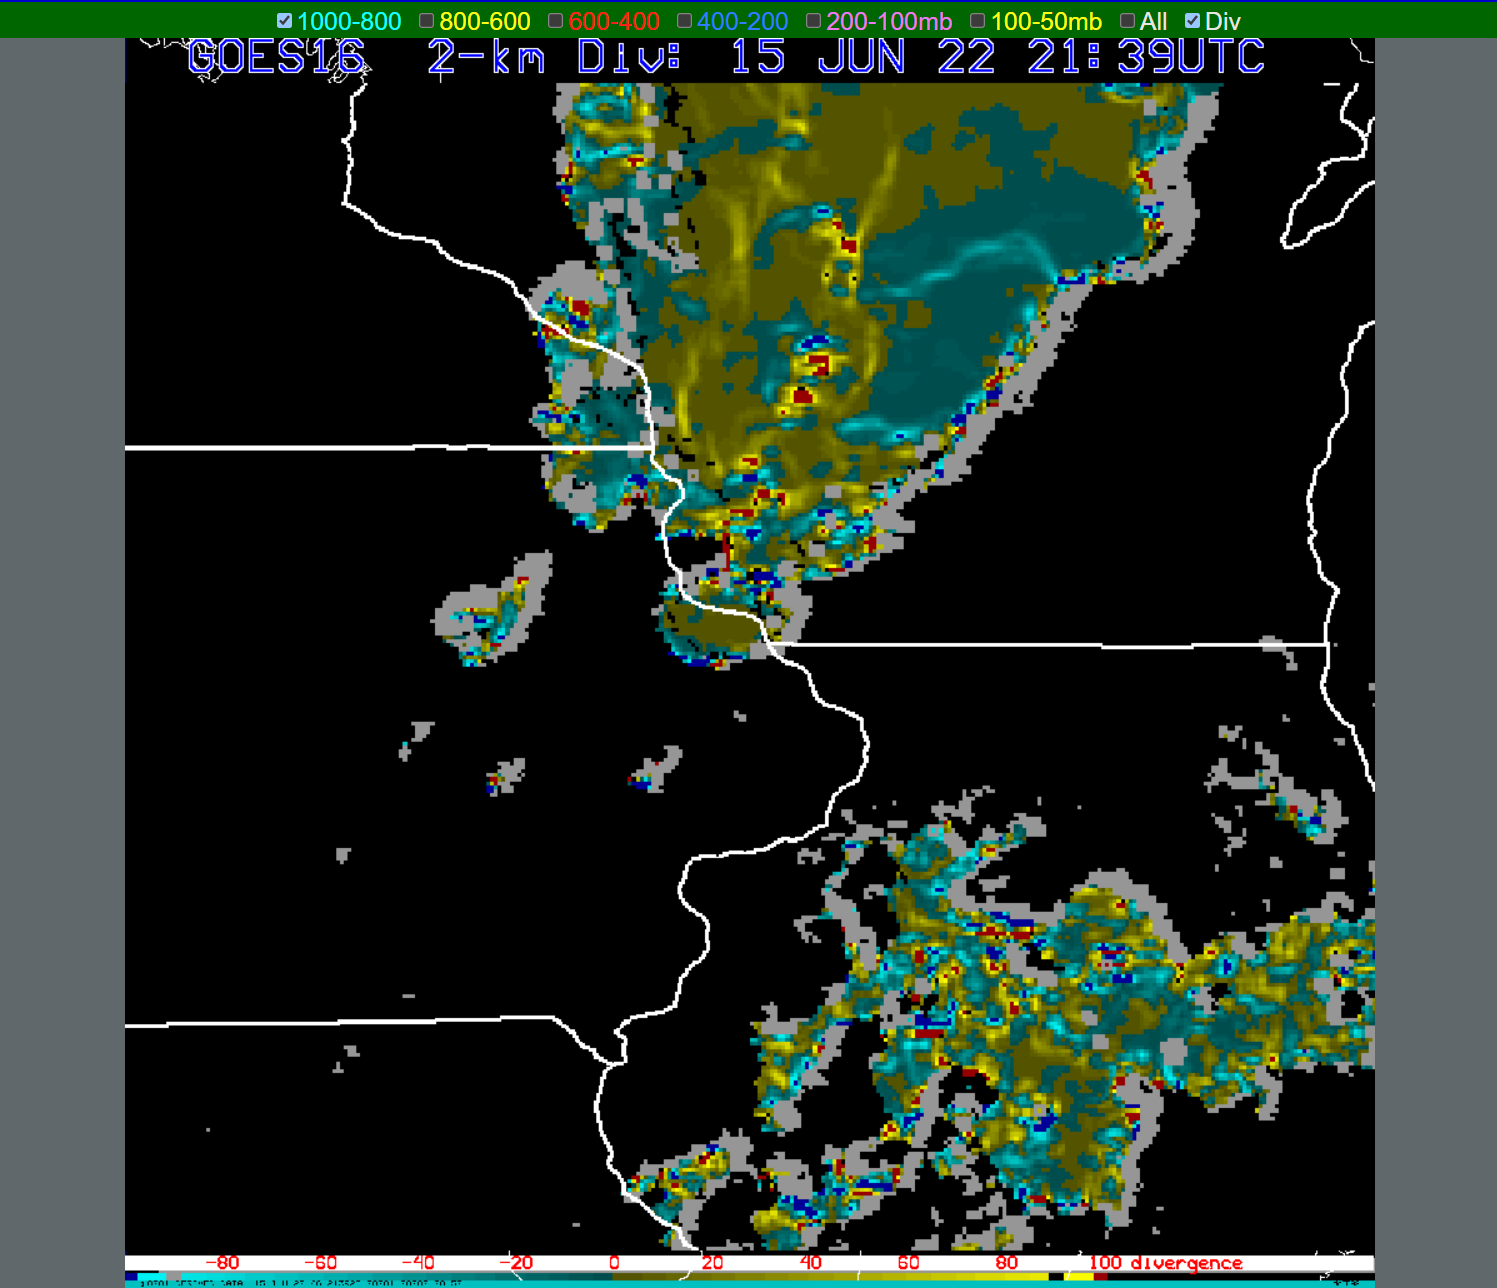
A user can also overlay lower layer wind fields to see what could be happening in those areas.  The key thing was though to see what the storm-top divergence may look like:

And that’s pretty impressive for an optically derived wind field!  Individual turrets may be showing up where there are enhanced area of convergence/divergence couplets not the ones on the edge of the cloud detection).  It isn’t perfect though:

There is a lot of variability from scan to scan on the strength of the divergence field but there is enough of a signal to figure out where the strongest couplets could be and which storm tops they could be associated with.  We couldn’t overlay radar data or the 3.9 micron “Red/visible” channel with a divergence product to make a 1:1 comparison; something to consider would be a grid that could be overlaid on a different ABI image to do a visual comparison to this product.

I’m impressed!

- Hank Pym


Pre-Convective Environment Across GRB

 With a busy day still underway across Wisconsin, the use of the Optical Flow Winds, GLM, Prob Severe, and NUCAPS soundings were a big help in looking at the pre-convective storm environment and in warning operations. 

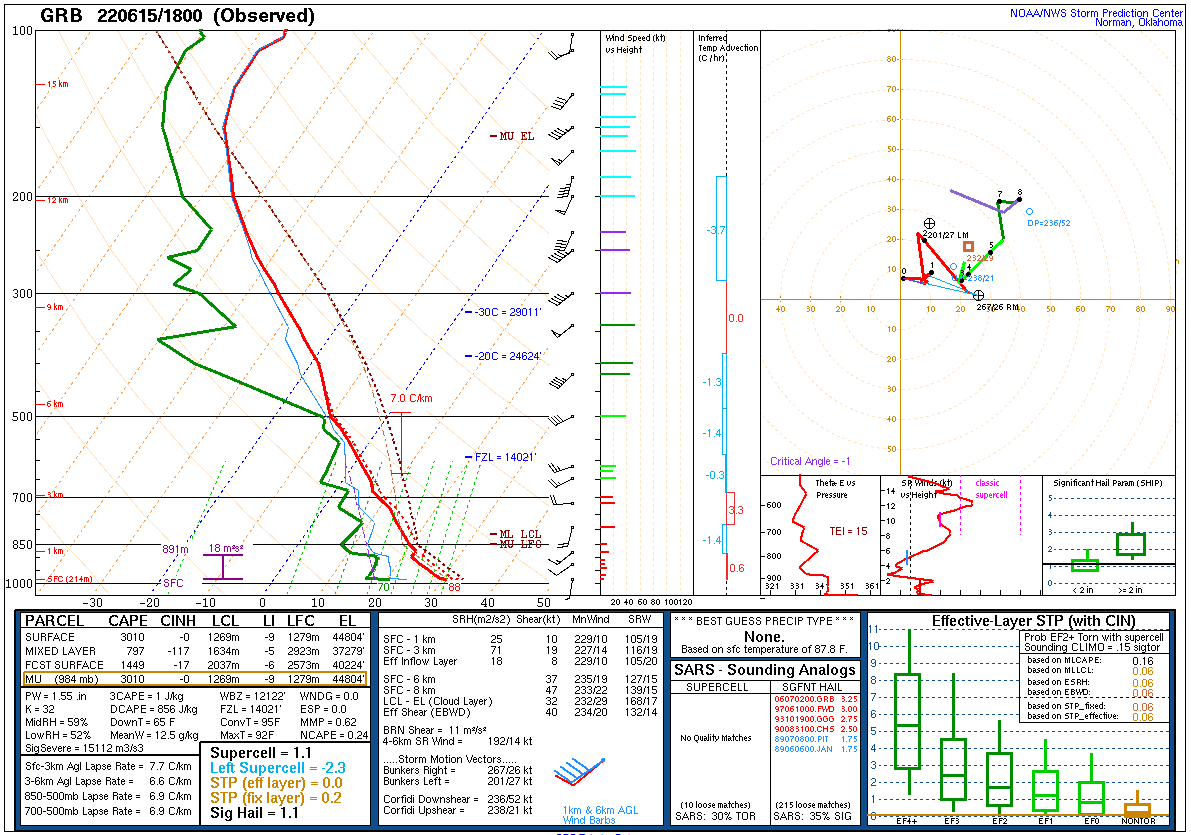
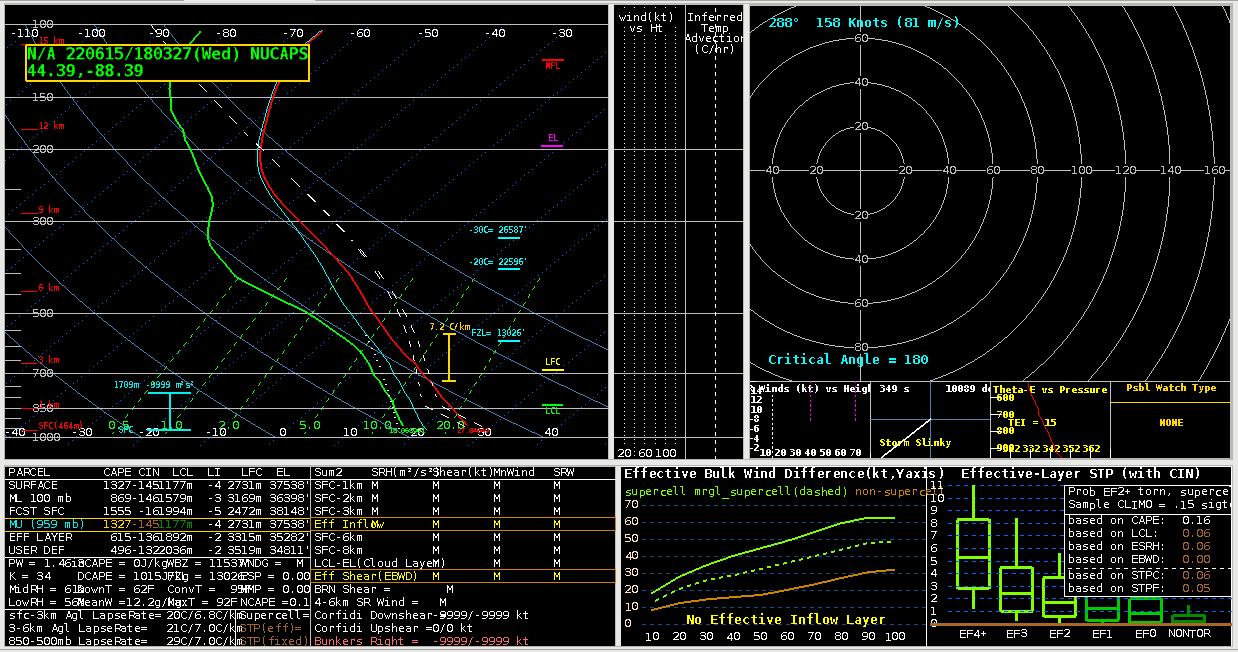
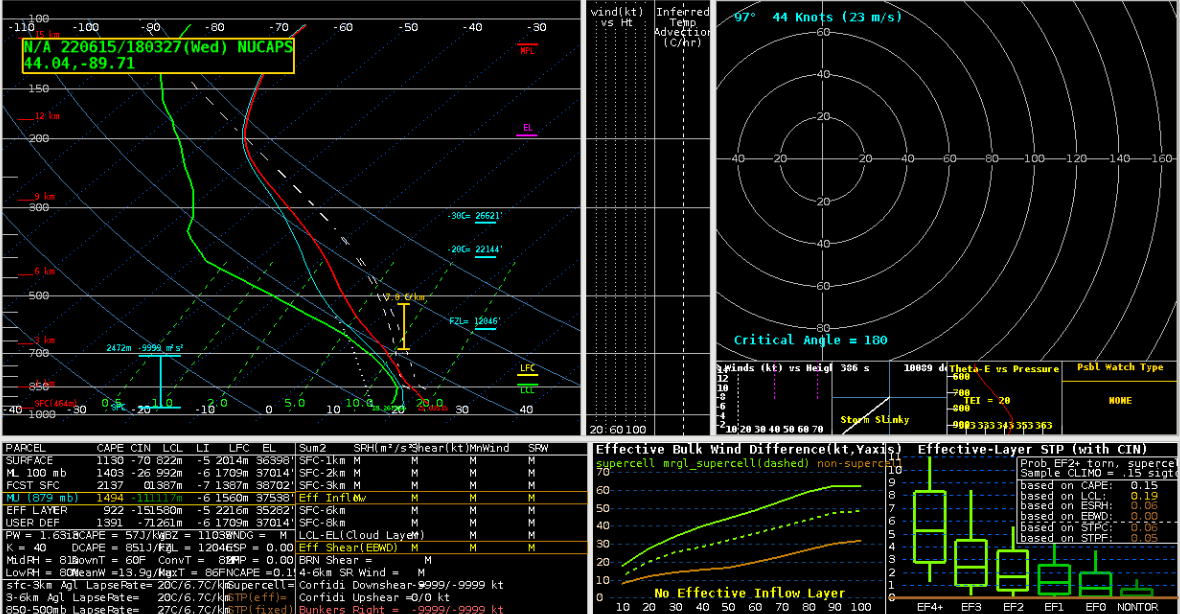
When it came to looking at sounding data we had a NOAA-20, and AQUA pass for the polar orbiting satellites, that we could then compare to the special observed sounding from GRB. 

There are some spatial differences in the locations since each satellite doesn’t pass over the exact location and the observed sounding came from the GRB office. I ended up grabbing NUCAPS soundings from west of the office where I thought the better storm environment would be. Regardless of this they do show great information over a temporal and spatial scale.

Just between Aqua (bottom image) and NOAA-20 (middle image) you can see that the environment becomes much more moist over time (AQUA came around 19Z and NOAA-20 came around 18Z). The increase in temperatures and dew points in the low levels between the two NUCAPS soundings show that there was increasing low level lapse rates and increasing CAPE through time. Then compare both of these to the special sounding sent out by GRB, you can see AQUAs vast improvement in the low level over NOAA-20. The one caveat seems to be the smoothing of the values in the mid levels. Smoothing seems to have decreased the values almost too much for both satellite soundings. It is fairly within reason given that there is a dry layer in the mid levels on the observed, but the smoothing looks to have slightly overdone it.

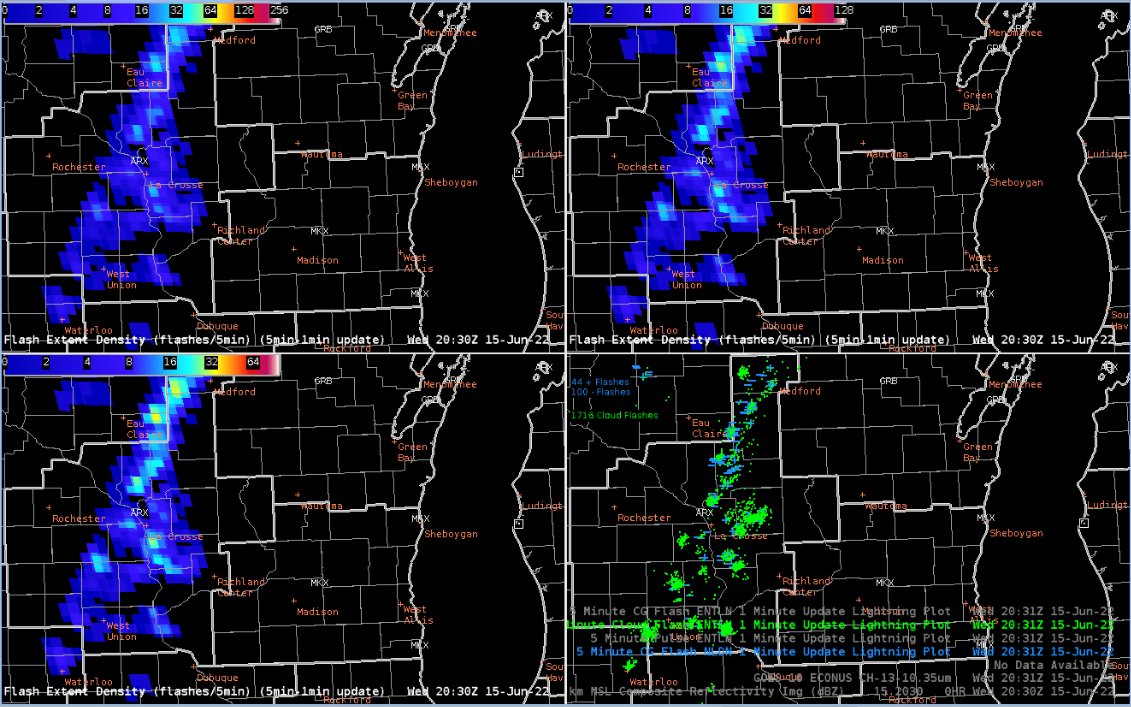
Moving on to the GLM, it was very helpful when boosting confidence in the warning operations. There were lightning spikes collocated with increasing rotation and reflectivity. The one things worth mentioning is to have a reminder or maybe even have offices lower/change the color curves for FED prior to the start of an event. It could even be a permanent change that some offices make.


Since I was the only one in the group to check, compare, and lower the FED color curve accordingly it was much easier to pick out lightning jumps. From the graphic above alone, 0-65 was much more informative than 0-128 or 0-260.

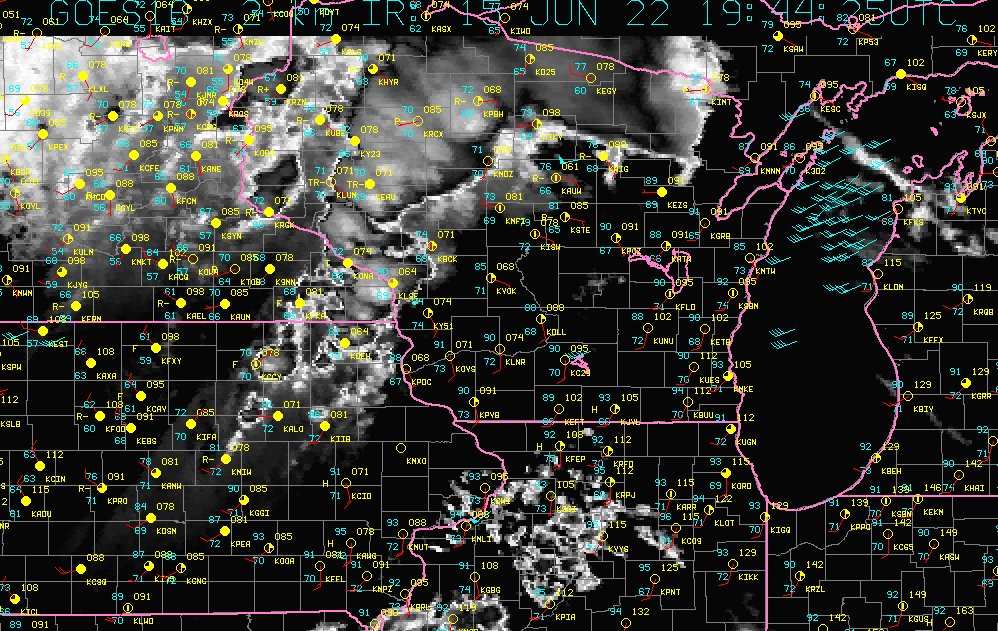
The last thing worth mentioning for the day was the Optical Flow Winds. While this was helpful in a warning environment to look at storm top divergence and speed of the winds at the tops of clouds, I was able to find another great use for it. In the pre convective environment I had pulled up the Optical Flow Winds and noticed that it was tracking winds and speeds of clouds over Lake Michigan. In an area where any wind information and observation data can be very sparse to near non-existent. The optical flow winds could be very helpful for open waters forecasting.


-Cirrus Fields

Wednesday, June 15, 2022

A Comparison of the Optical Flow Winds “Divergence” Product and KMVX Radar Storm-Top Divergence

By 2200z, a strong cluster of storms was ongoing in northwestern Minnesota ENE of the KMVX RDA while moving northeast. Below are a set of 4 figures showing the divergence at the cloud top of the ongoing cell, with a cyan circle outlining the updraft area.  
Here is a comparison of the Optical Flow Winds divergence versus storm top divergence provided by traditional means:

OFW – STD

>100 – ~115 kt

~80 – ~105 kt

>100 – ~150 kt

> 100 – ~130kt

While the divergence output wasn’t as high, it seemed to behave consistently below the traditional storm top divergence which means it could be adjusted up in the forecaster’s head. I’d love to see a little more discerning from the color curve for divergence, as it shows little difference, and when it goes over 100, it is all red. Also, it would be nice to see the exact unit that it uses, as it seems assumed that it’s kts.


-aerobeaver

Friday, June 10, 2022

GLM FED vs ENTLN | ProbSvr on Pulse High Plains Convection | LightningCast DSS

 GLM FED vs ENTLN → Impacts on ProbSevere??

Spreading anvils from strong to severe storms over far southeastern CO east of Trinidad, likely caused an obscuration of lightning activity into the GLM product. The ENTLN ground network picked up a strong spike in cloud flashes associated with this cell SW of Kim, CO going up from ~150 to ~350 in ~5minutes. Whereas the GLM FED from both GOES-16 and GOES-17 only showed a few flashes observed. Could this be from both GOES satellites having an obscured view of the updraft? Image 2 below shows the anvils spreading in nearly all directions, or far enough in all directions to obscure the light emanating from lightning flashes within the updraft.

GLM GOES-16 vs ENTLN near Kim, CO at 2020Z

GOES-16 Day-Cloud-Phase Distinction RGB - Anvils spreading in all directions from convective updraft core.

Did this lightning obscuration impact the readout from the ProbSevere v3 model? Image 3 below shows a drastic difference in ProbSevere at the 2020Z timeframe of the Kim, CO storm, 29% on version 3 compared to 72% on version 2. More specifically, ProbHail on version 3 was only at 14%. There are other possible causes to this low percentage, notably a low EBShear value of 19kts, and low 715 j/kg CAPE within the -10C to -30C hail growth zone. So while low GLM values may not have had a large weight on bringing down the ProbHail percentage, other unimpressive model or mesoanalysis values may have played the bigger role. The high sun angle and the brightness of surrounding cirrus anvils may have also contributed to the lower GLM FED values. GLM FED from both GOES-16 and GOES-17 were observed to pick up on increased lightning activity more easily later in the afternoon.

These factors went opposite of what radar interrogation yielded for this storm, which included a tall convective updraft with 40+dBZ well above 30,000’ at storm top, and MESH reaching to or just above 1.00” during the 2015Z-2025Z timeframe.

ProbSevere v3 Low ProbSevere and low ProbHail for severe warned storm SW of Kim.

 
Optical flow winds in the image below picked up on strong storm top divergence from severe warned storms just east of Raton, NM. This coincided well with observed storm top divergence signatures seen from the PUX radar velocity product in the second image below.

Optical Flow Winds | 50-70kts southerly wind barbs evident on cell near Raton, NM


Radar Velocity signature showing storm-top divergence of 85-95kts.

The PUB WFO had an example DSS event in Trinidad, CO, the Santa Fe Trail Days event which had events going on all day. The threat of lightning impacting the outdoor event, and the threat of severe weather was the main area of concern. There was already ongoing convection in the area at the start of the day’s trial run, so a nowcast graphic was produced utilizing LightningCast to show where the highest threat of lightning was. Coupled with an underlying satellite image, a brief forecast over the next hour showing storm motion and what the continued threat of lightning was going to be was also included. The display of LightningCast in percentage was an easy way to display the lightning risk. An ad-hoc Low/Slight/Moderate/High description of each threat tier was added in, but in no way reflects a sound or thorough best practice for a description of lightning risk.

DSS Graphic using LightningCast to showcase the risk of cloud-to-ground lightning at the hypothetical Santa Fe Trail Days Event in Trinidad, CO.

After the short-fuse nowcast graphic was sent, a longer fuse DSS graphic was issued to give a sense of the lightning risk will be through the rest of the day. For this, the PHS Sfc CAPE field was used to display the potential thunderstorm strengths. This would likely not be used in an actual DSS event, given the lack of understanding the intended audience would have of surface based CAPE and instability. But it does highlight the potential use if communicated properly.
Second longer fuse DSS graphicast showcasing the days thunderstorm risk for the Santa Fe Trail Days at Trinidad, CO.

A third DSS graphicast was issued later in the afternoon highlighting the progression of storms toward the ESE away from Trinidad, CO. The message focused on their still being a cloud-to-ground lightning risk in the area of Trinidad, via display of LightningCast, but a lowering risk moving in from the west. Further messaging of the expected end time of the lightning risk was also conveyed in this graphic.

Third short-fuse DSS graphicast showcasing current MRMS radar overlaid by LightningCast

- TRIP


Thursday, June 9, 2022

PHS, NUCAPS, Optical Flow, Prob Severe Fun

 PHS and NUCAPS

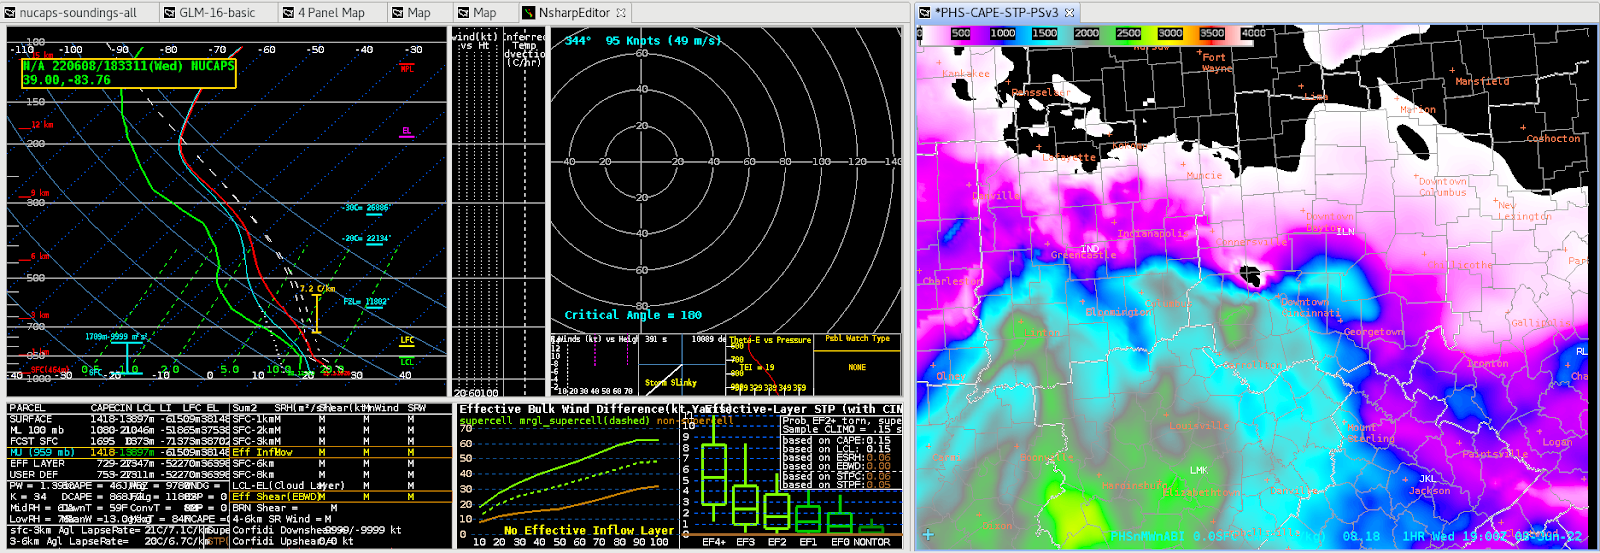
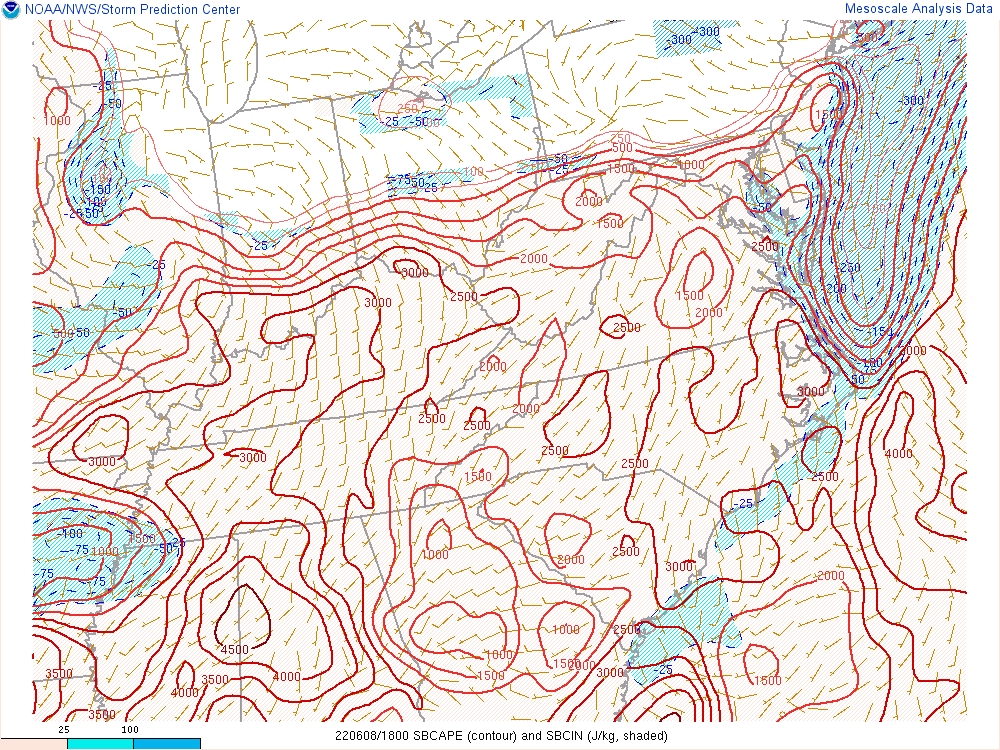
Today worked out well with PHS and NUCAPS. NUCAPS data came in shortly after opening up our work stations. We decided to compare the output between PHS, NUCAPS, and SPC mesoscale analysis. The variable that we chose was surface CAPE.


They all seemed to match up well highlighting the higher instability to the south that would gradually  push north this afternoon. It was definitely a confidence builder in each product to see the agreement between them.

Optical Flow

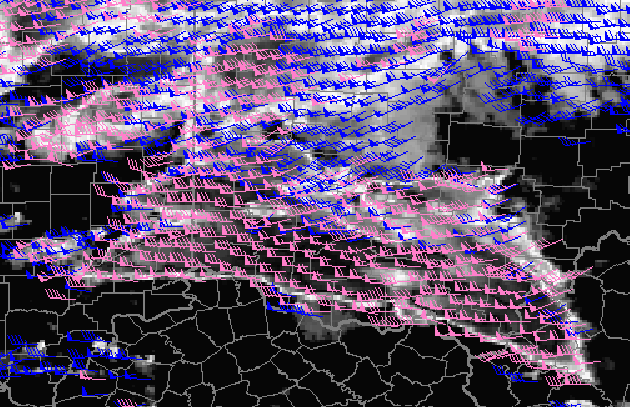
We also decided to compare the Optical Flow winds to SPC mesoscale analysis. Once storms developed a bit more, you can pick out a slight directional divergence signal in the flow. Looking at SPC mesoscale analysis there is also directional divergence is present in the mesoscale analysis.


Overall looking at these two examples, using these tools together can be a way to verify information and give the meteorologist more confidence (or less) in a specific product to help them with forecasts, DSS, and warning operations.

Prob Severe

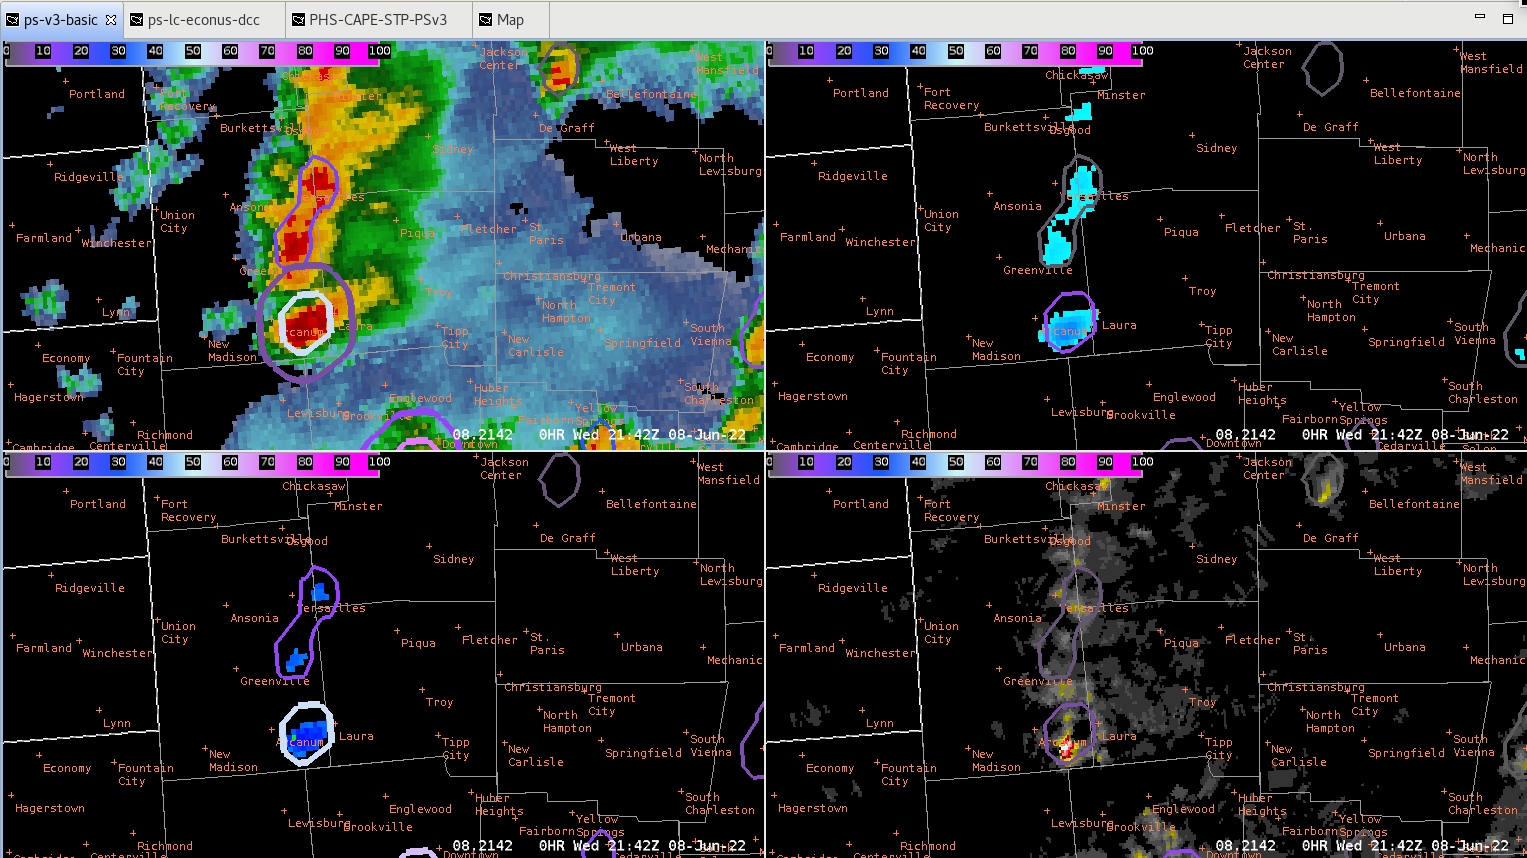
We were able to compare Prob Severe V3 to the time when there was an observed report and when the new tornado warning came with a radar observed tag due to a CC drop. The first image is when there was a twitter report of a tornado around 2142Z in SE Darke county.
At 2144Z the Prob Severe V2 tornado jumped to 21% while V3 only went to 6%.

The next image below is when the radar confirmed tornado was reported.


- Noctilucent & Matador


PHS CAPE localized maximum compared with storms developing in the area

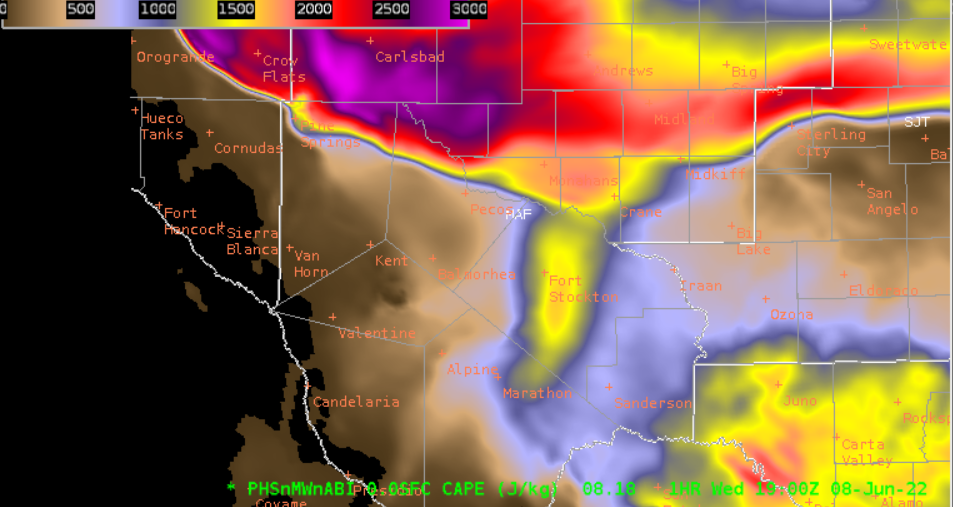
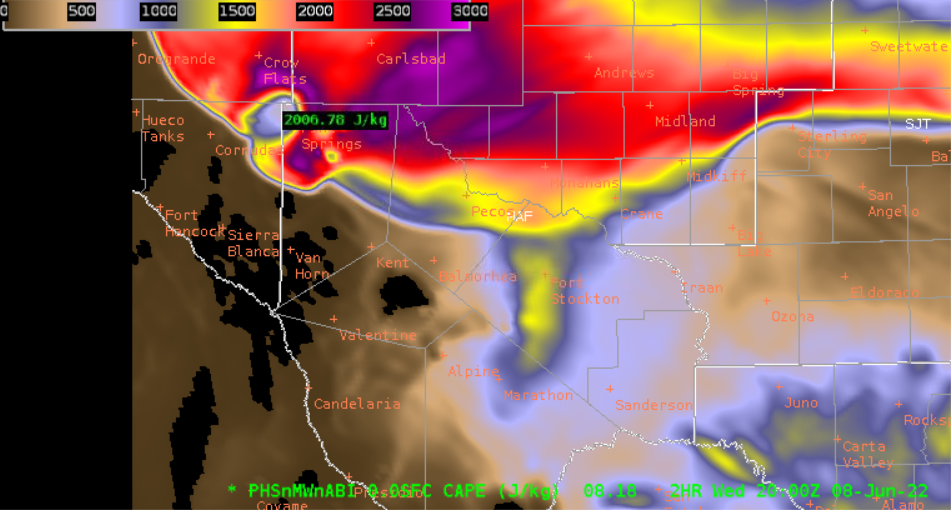
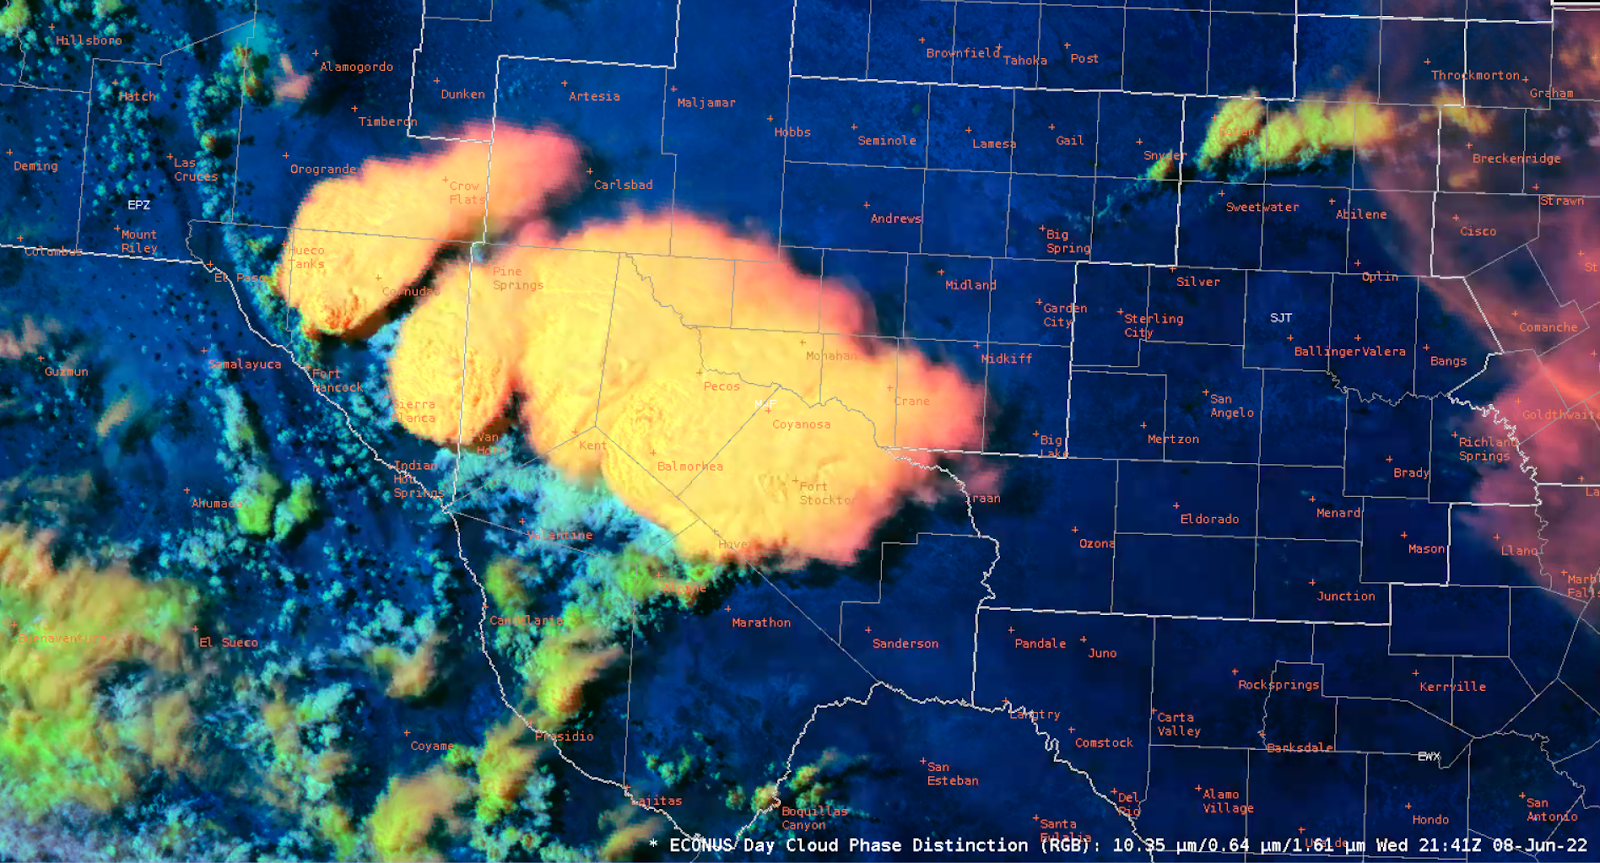
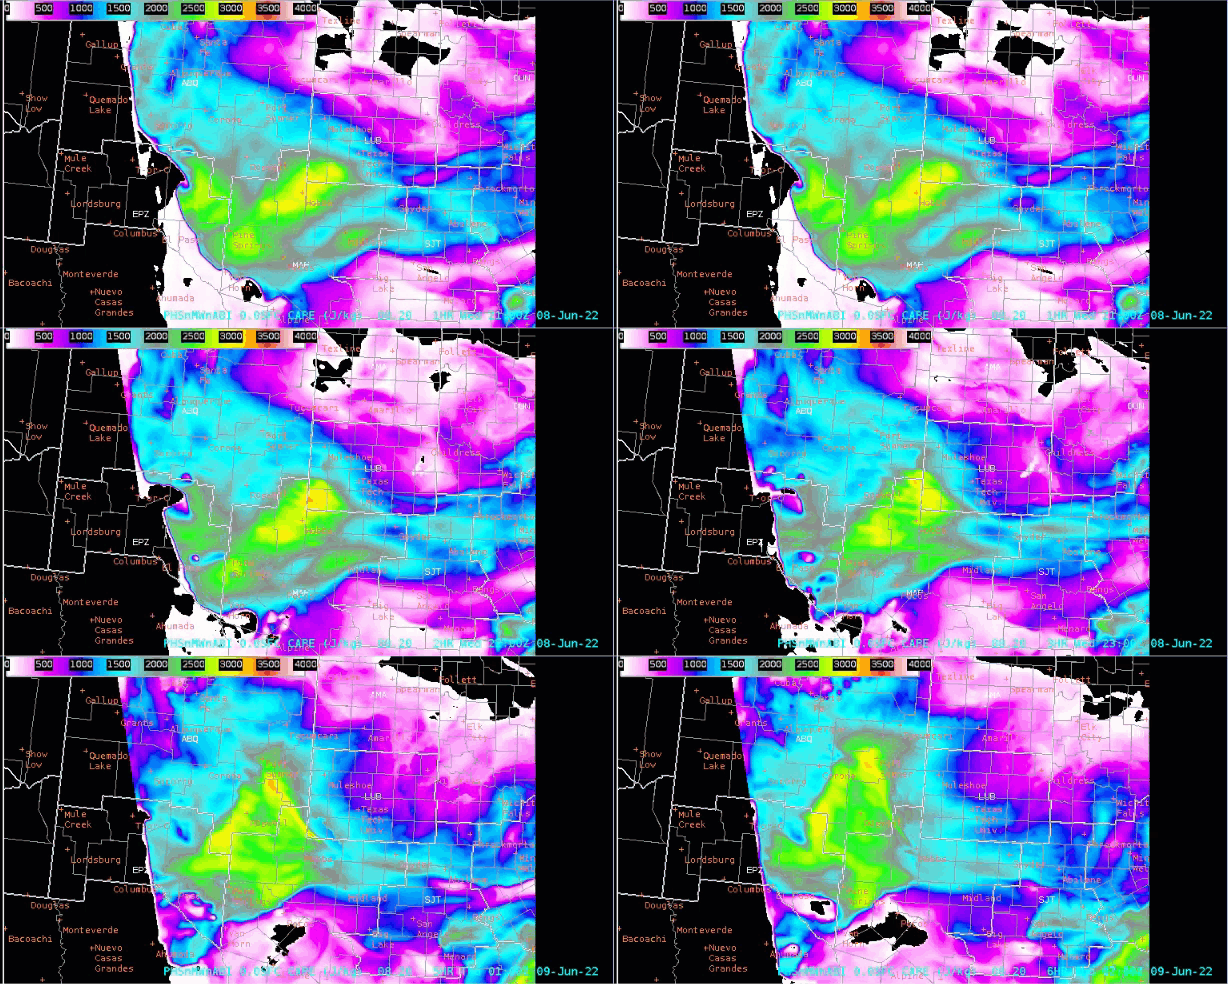
 PHS CAPE values increase from north to south over Fort Stockton. This correlated well with RAP mesoanalyzed SB CAPE on SPC webpage. Storms actively going up along this gradient as an outflow boundary pushed south during the early afternoon from overnight convection over Oklahoma.  

PHS CAPE 18Z 1 hour forecast for 19Z

PHS CAPE 18Z 2 hour forecast for 20Z.

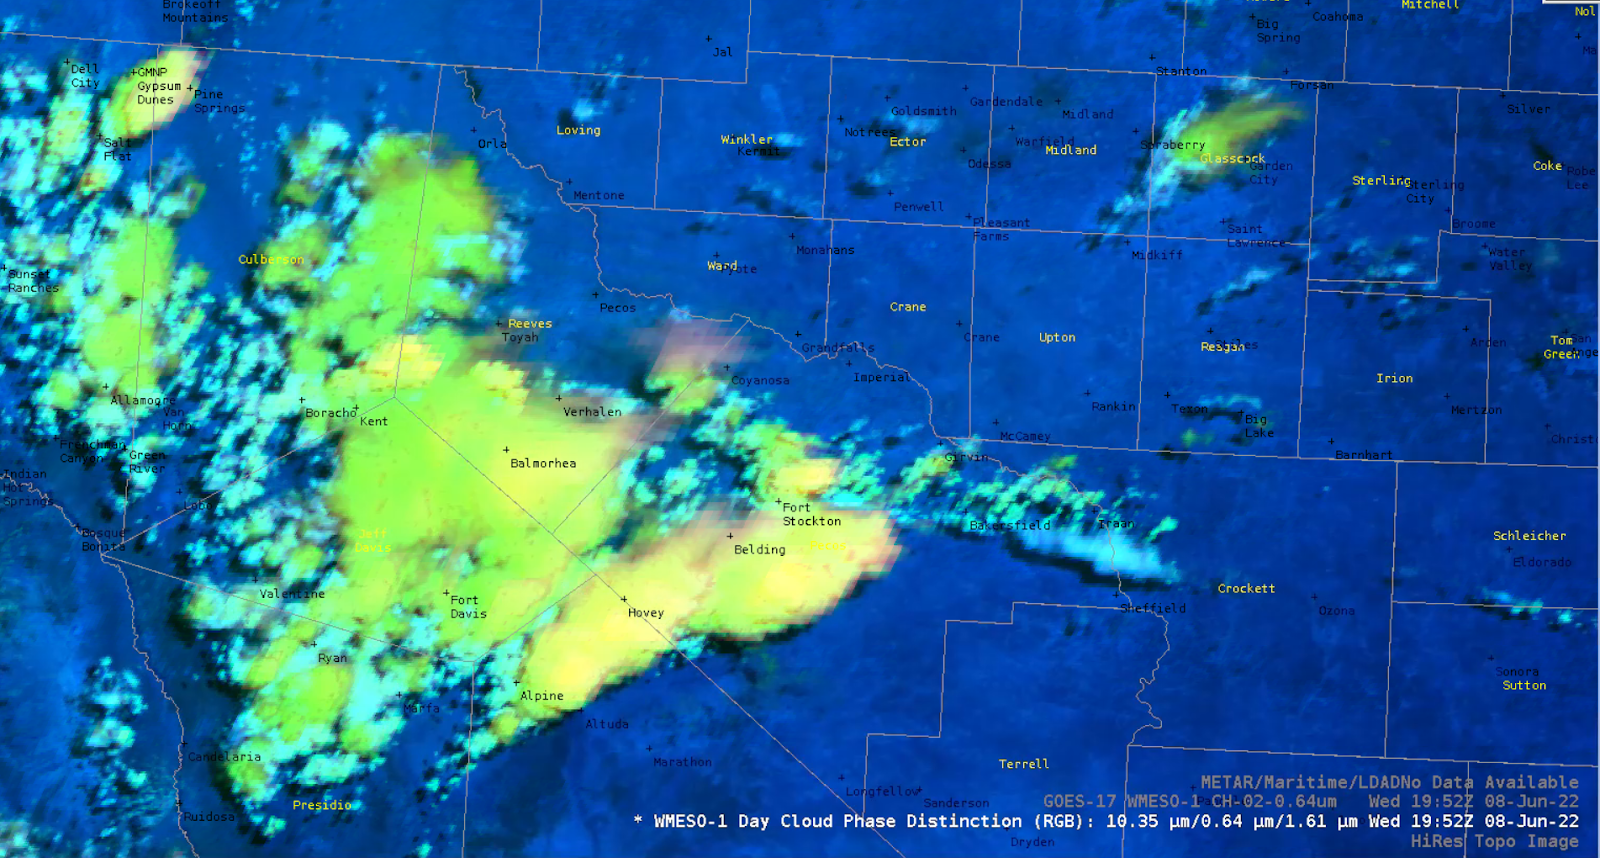
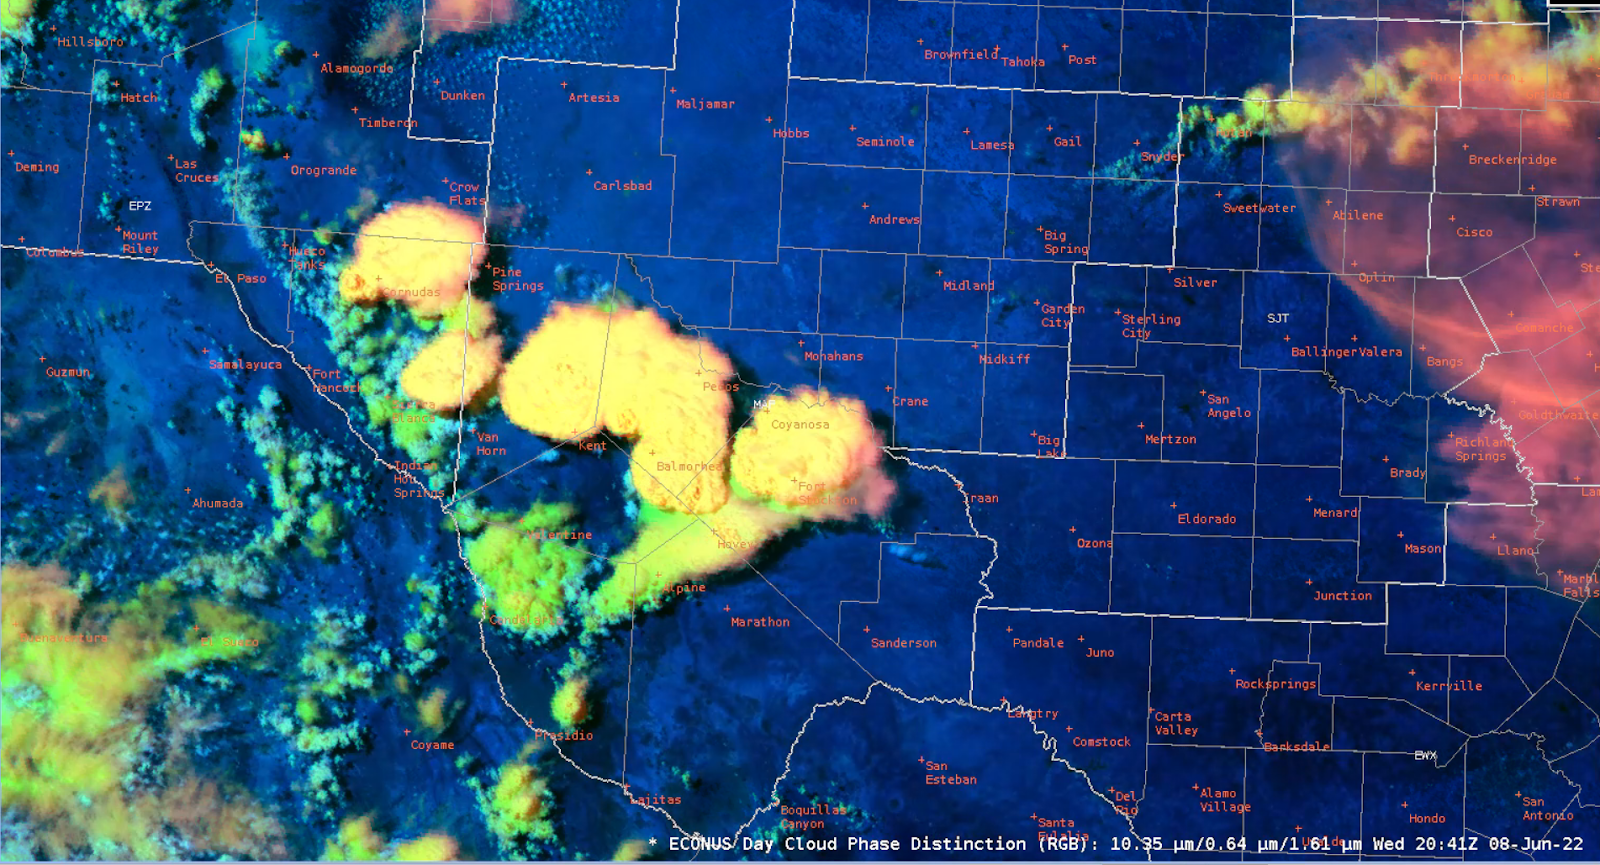
Storms developing over Fort Stockton via Day Cloud Phase Distinction on GOES 17 Mesosector

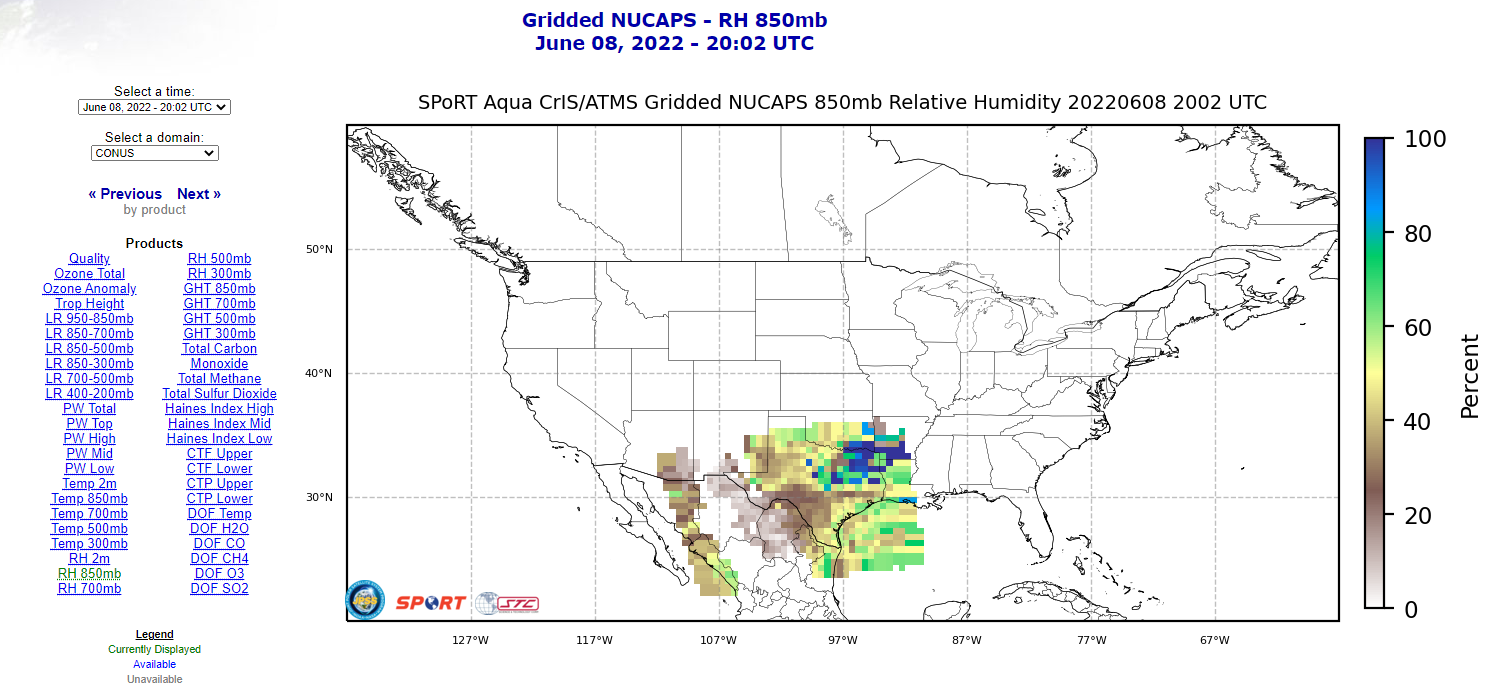
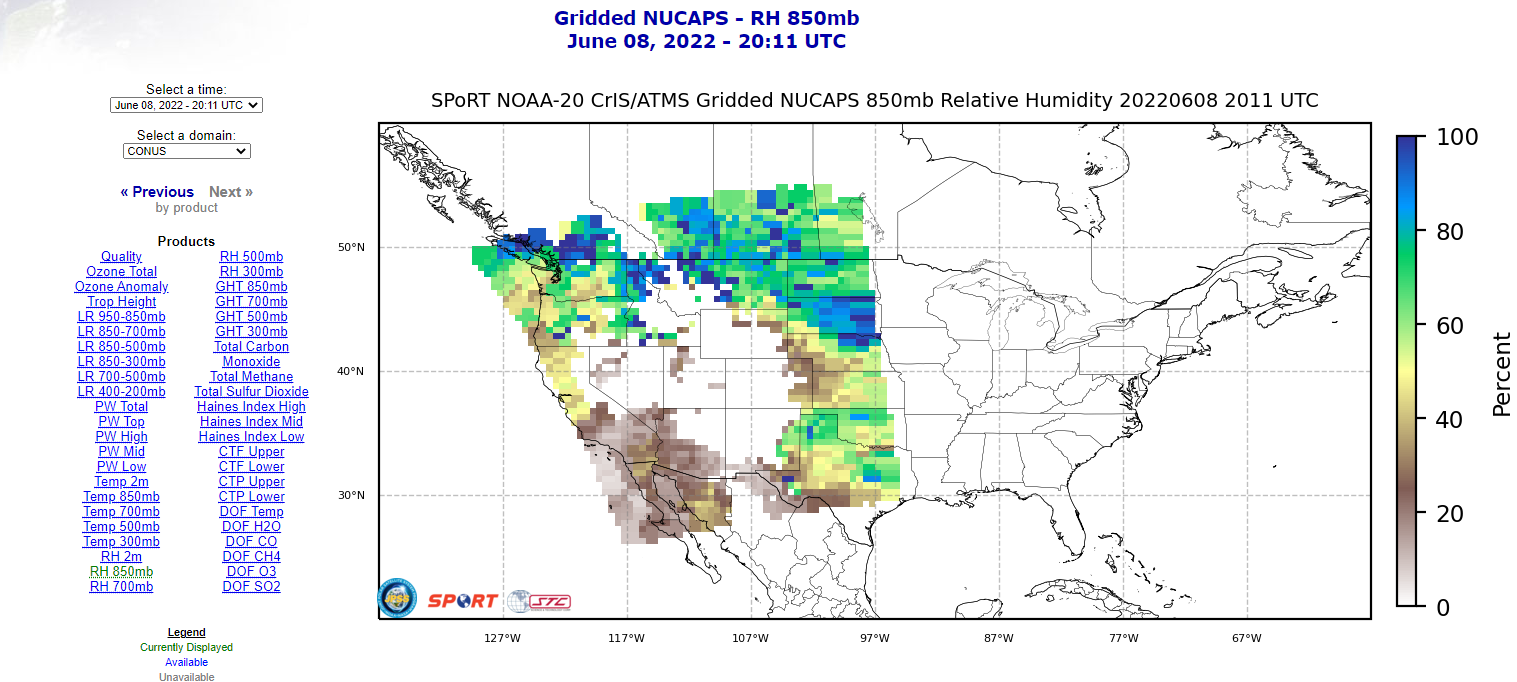
We showed above that the north side of the outflow would contain more instability - which is directly related to the moisture from the morning MCS outflow. The Gridded NUCAPS provides additional insight using the 850mb moisture fields from both AQUA and NOAA20 respectively - validating our hypothesis.


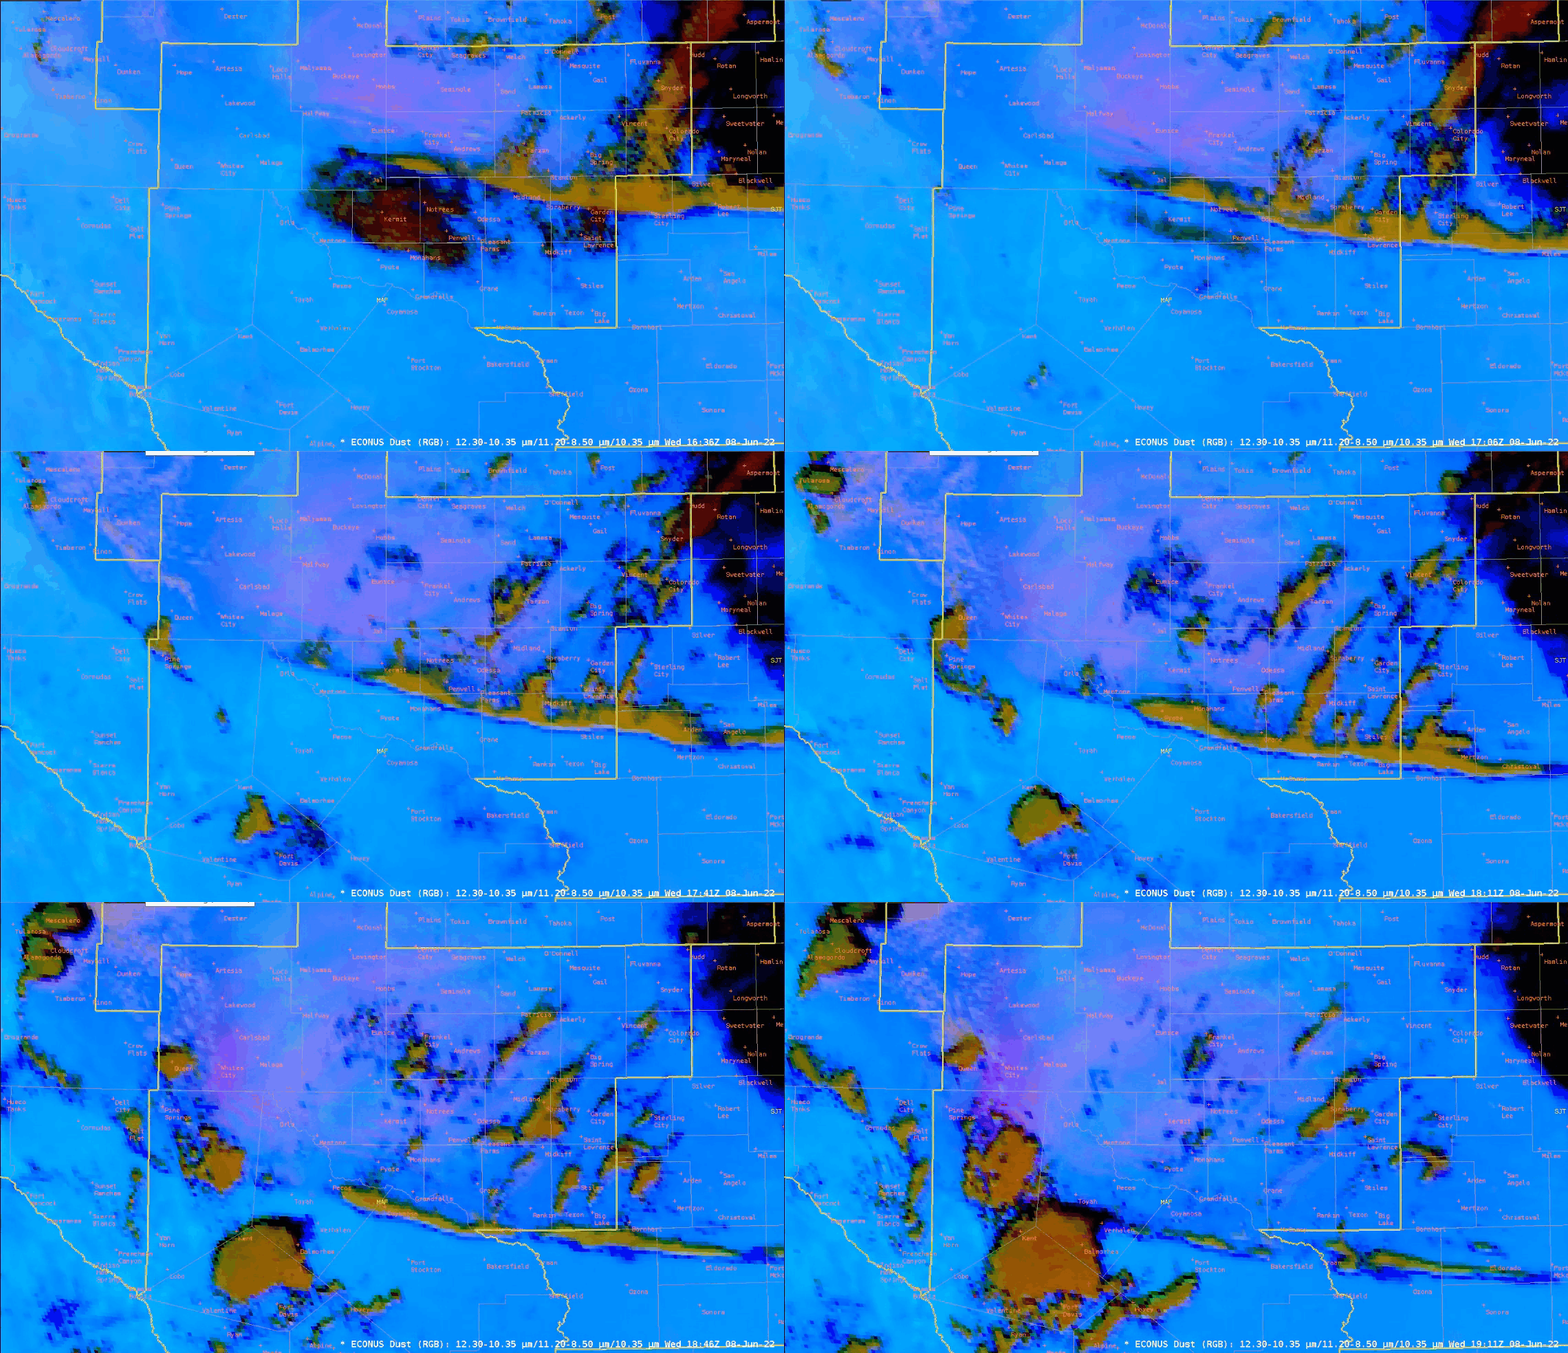
We double checked since there was a dust advisory/dust in the forecast and yes - Dust

Don't warn if pop = 0

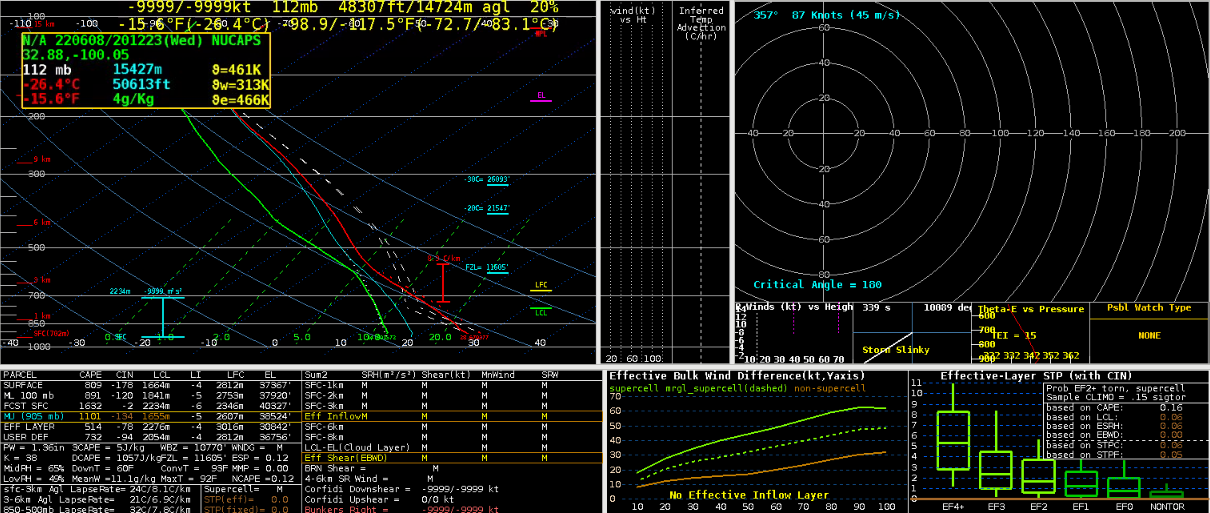
Convection was skirting the northeast portion of the CWA so we’ll use the recent pass of NOAA-20 to view the potential for convection redevelopment to the west and affecting the forecast in our CWA. Here are the Modified NUCAPS soundings:


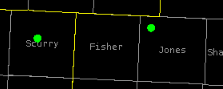
The top image is for the sounding in Jones county, below is Scurry - which shows a capping inversion still in place.

Storm Motion

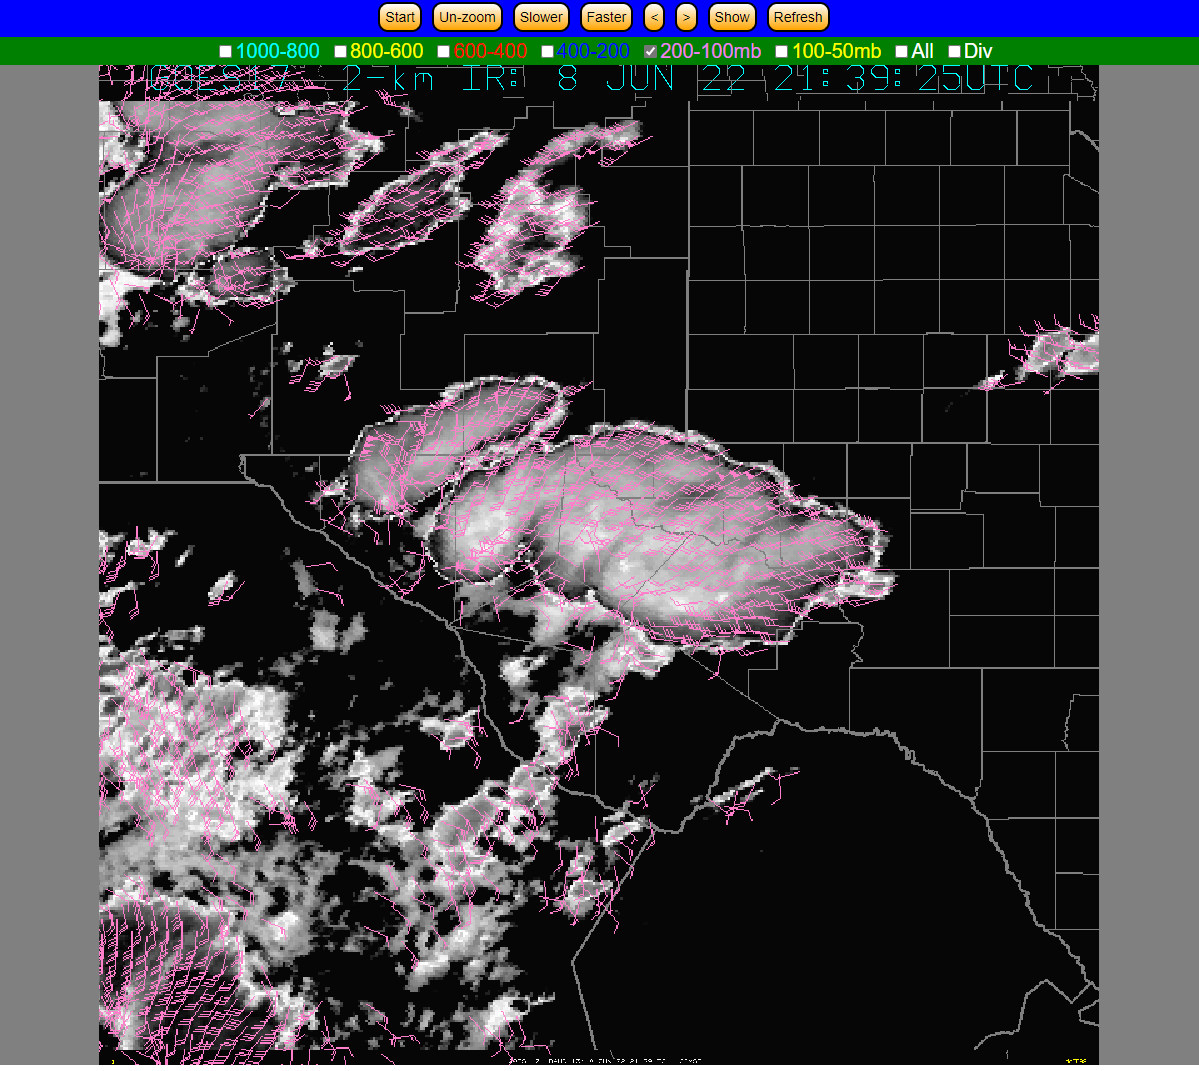
Weak winds aloft and throughout the atmosphere have contributed to very little in the way of storm motion. Hence, locally heavy rainfall may begin to evolve, even over an area that has received very little rainfall in the last 6 months.

Optical Flow Winds in the 200-100 mb level.

Day Cloud Phase valid 2041Z.

Day Cloud Phase valid 2141Z.


PHS depicts this plume of moisture and associated instability will back into New Mexico this evening. Could it play a part in tomorrow's severe weather risk?

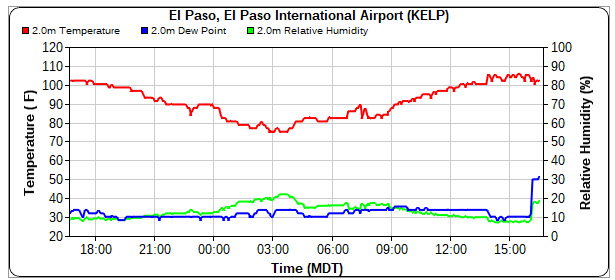
Here is what happened at El Paso when the front backed into the area - Dewpoint jumped from 30F to 50F

- David Spritz

- Mr. Bean