Friday, June 3, 2022

Scourge of Jersey

A short-wave trough departing the U.S. east coast spawned numerous storms in the Mid-Atlantic states yesterday. One storm politely waited until crossing the Delaware River to start producing severe wind gusts, toppling numerous power lines and trees, some onto homes and cars.

ProbSevere version 3 (PSv3) had a better handle on this storm than version 2, being consistently 30-40% higher in the 30 minutes prior to the first NWS severe thunderstorm warning being issued. PSv3 is being evaluated by NWS forecasters in the HWT this year, its second year of evaluation.


Figure 1: ProbSevere v3 contours, MRMS MergedReflectivity, and NWS severe weather warnings for a storm in Pennsylvania and New Jersey.


Figure 2: Comparing ProbSevere v3 and v2 shortly before the first warning was issued.


Figure 3: Time series of ProbSevere v3 probabilities, local storm reports, and NWS severe weather warnings for this storm.

At 20:08 UTC (in Figure 2), the top six contributing predictors in ProbSevere v3 were the ENI lightning density (0.76 fl/min/km^2), effective bulk shear (47 kt), 0-3 km lapse rate (7.2 C/km), mid-level azimuthal shear (0.007 /s; moderate), the significant tornado parameter-effective (0.15), and the satellite growth rate (1.5%/min; weak). The machine-learning models in PSv3 are able to better discern complex predictor interactions than the models of PSv2.

Tuesday, May 31, 2022

GLM and Minimum Flash Area

 Lightning energy during the HWT was introduced in several different ways. Three of these were:

  1. Flash Extent Density
  2. Minimum Flash Area
  3. Total Optical Energy

For monitoring severe thunderstorms, Flash Extent Density seemed to be the most useful of the three.

However, all of the GLM products were what we focused on.

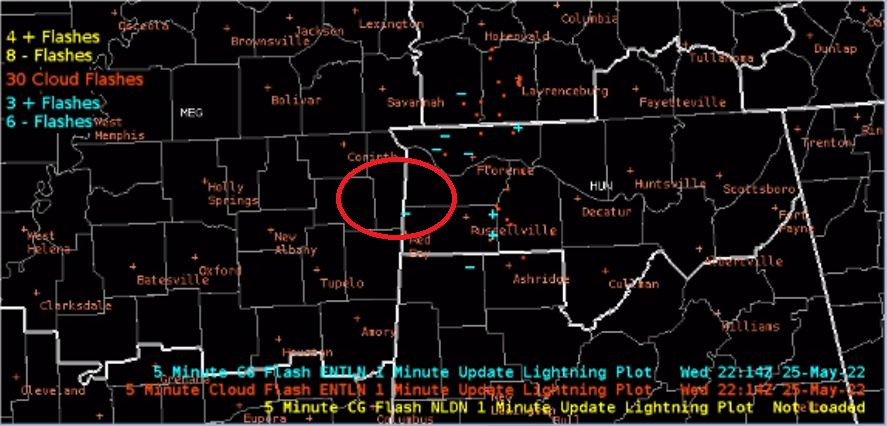
In order to obtain GLM lightning data on the grid or map, you had to obtain a Minimum Flash Area. It was interesting in the stratiform type storms that a wide area was displayed compared to the small area where the flash took place. In this case it was one cloud-to-ground lightning strike (CG).

This image is from the Bottom-Right panel (CG and Cloud Flashes):

This is the top-right panel (Minimum Flash Area):
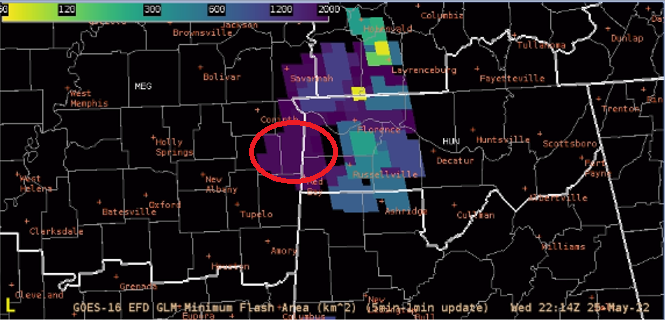
This shows that one CG Flash can plot a large area on the Minimum Flash Area product. It seemed that this was necessary for other products to plot, such as the Flash Extent Density, but it may be a little bit of a distraction for the operational forecaster as it would seem to flash a bit (on and off if looping it) and for a much larger area than what was shown compared to the cloud Flash and CG plots.

- WeatherTed