Showing posts with label ICP. Show all posts

Monday, May 20, 2024

IntenseStormNet in Kansas and Oklahoma

ProbSevere IntenseStormNet is not being evaluated at HWT this week, but it is a unique application of satellite data for severe weather. On the eve of the 2nd week of the 2024 HWT, severe storms were ravaging the Plains.

IntenseStormNet is an AI model that uses patterns in ABI and GLM image data to predict a probability of "intense" convection. The strongest probabilities are often correlated with strong overshooting tops, bubbly texture in the visible band, storm-top divergence, and lightning cores.


In the movie above, you can see several MCSs traversing the state, producing severe hail, wind, and tornado reports. One the convection becomes cold-pool driven, the probabilities often diminish, sometimes significantly (see eastern Kansas at the end of the period).


Meanwhile in Oklahoma, a monster supercell progressed steadily through the western half of the state, dropping tornadoes, hail, and producing severe wind gusts. One interesting aspect about the product was the drop in probabilities from about 01:40 - 02:10 UTC. This drop corresponded to a short gap in severe weather reports produced by the supercell. Visually, the main overshooting top appeared to diminish.

IntenseStormNet is used in ProbSevere v3, feeding in satellite information at the mature stage to the severe-weather models.

Thursday, April 14, 2022

Salado Tornado

A supercell quickly developed on the southern flank of an arc of storms in central Texas on Tuesday, April 12. High CAPE (≥ 3000 J/kg), effective shear (≥ 50 kt) and effective SRH (≥ 170 J/kg) all contributed to an elevated probability of tornado from ProbTor v3 (PTv3) by 22:00Z. About 30 minutes later, the supercell produced an EF-3 tornado west of Salado and south of Killeen, TX. 

Figure 1: ProbSevere contours, MRMS MergedReflectivity, and NWS severe weather warnings in central Texas. The storm that produced the EF-3 tornado traveled south of Killeen, Texas. 

In the critical early stages of storm development, PTv3 probabilities exceeded PTv2 probabilities, which is noteworthy given PTv3's better-calibrated guidance. From Figure 2, we see that prior to the initial NWS tornado warning, PTv3 was consistently 10-20% greater than PTv2. Because PTv3 is better calibrated than PTv2 (i.e., probability value better match tornado occurrence), PTv3 will rarely exceed 60%, whereas PTv2 regularly hits 80-90% (but PTv2 over-predicts in that range).

Figure 2: Time series of PTv3 and PTv2 for the tornadic storm west of Salado, TX.

At 22:14Z, PTv3 = 30%, while PTv2 = 7%. In a post-mortem analysis, we found that the MESH, mid-level azimuthal shear, and effective bulk shear were the top-3 contributing predictors. The 4th leading predictor was the probability of intense convection produced by the ProbSevere IntenseStormNet. A rapid increase in this value from 29% to 99% occurred from 21:52Z to 22:14Z (see "ICP" in the meteograms). IntenseStormNet is a GOES-ABI and GOES-GLM-based convolutional neural network, which picked up an a developing cold-U signature and increasing lighting to produce a very high probability of "intense" convection (see the animation below). In this way, it provides a holistic method of leveraging important values, textures, and spatial features found in geostationary imagery. In ProbSevere v3 models, IntenseStormNet computes one value per storm per time step, which is used as a predictor. 

Figure 3: Intense convection probability contours overlaid GOES-16 "sandwich" imagery from a 1-min mesoscale scan. Note the rapidly developing supercell on the south flank of the developed convection.

ProbSevere v3 infuses spatially important satellite information into its predictions. This example shows that forecasters should pay especially close attention to developing storms when PTv3 is exceeding PTv2.

Wednesday, April 13, 2022

Storms pummel the Midwest

An energetic short-wave and attendant surface low rapidly intensified on April 12th, bringing quickly developing storms to a number of regions in the Midwest U.S. Large hail, severe wind gusts, and potent tornadoes were reported from Wisconsin to Texas.

Figure 1: SPC categorical outlook at 06 verification.

In the middle of the afternoon, a lone elevated storm along a stationary boundary traversed the state of Wisconsin, causing a 67-mph wind gust in La Crosse, WI, and dropping hail ranging from 1" to 1.5". ProbSevere version 3 (PSv3) had a pretty good handle on it over the course of several hours. 


Figure 2: ProbSevere storm-based contours, MRMS MergedReflectivity, and NWS severe weather warnings for a storm in Wisconsin.


While the MRMS products contributed positively to the PSv3 probabilities (e.g., MESH, Reflectivity -10C, AzShear), the IntenseStormNet probability (a predictor in PSv3 models) also contributed in the models. IntenseStormNet uses images of visible and long-wave infrared channels from GOES-R ABI, as well as images of flash-extent density from GOES-R GLM to detect intense parts of storms. From the animation below, we see that IntenseStormNet "probability of intense convection" for the storm in Wisconsin largely stayed between 50% and 90%.


The storm of the day spawned in northeast Iowa, ahead of a cold front. From ProbSevere hover-output in AWIPS, we saw that it had a strong normalized satellite growth rate at 21:31Z. PSv3 was 32% when the NWS issued its first severe thunderstorm warning, at 22:00Z. The probability of severe then soon increased to 70% by 22:18Z. The storm produced its first 1"-diameter hail report at 22:25Z. 

Figure 3: An animation of ProbSevere contours, MRMS MergedReflectivity, and NWS severe weather warnings for a tornadic storm in Iowa

A tornado warning was issued at 22:59Z, coincident with ProbTor v3 rapidly increasing to 49%. ProbTor v2 was at 13%. There was an increase in the MRMS azimuthal shears at this time, along with an increase in the significant tornado parameter (a predictor in PTv3). v2 was likely underestimating the threat due to too much contribution from stout MLCIN (-86 J/kg), dampening the probability. The machine-learning model of PTv3 (gradient-boosted decision trees) appears to better incorporate the MLCIN information than it's predecessor, in this case. 

Figure 4: ProbSevere contours, MRMS MergedReflectivity, and NWS severe weather warnings for a tornadic storm in Iowa. The ProbSevere time series window can be activated by double-clicking inside a storm object.

The IntenseStormNet's probability also contributed to the higher probability of tornado. See in the animation below how probabilities ≥ 90% are well-correlated with the most vigorous portions of the convection.


Later, the cold front zipped down from Nebraska into Kansas. Very strong satellite growth rates were observed, as the PSv3 values regularly exceeded 80%. The cold front was essentially warned continuously from western Iowa to southern Kansas.

Figure 5: ProbSevere contours, MRMS MergedReflectivity, and NWS severe weather warnings for a cold front from Iowa to Kansas.

The intense convection probability from IntenseStormNet quickly went from < 10% to ≥ 90% for most of the line, which later produced numerous hail and wind reports.


Wednesday, April 6, 2022

Allendale, SC tornado

Allendale, South Carolina sustained much damage after a major tornado tore through parts of the town on April 5th, 2022. The NOAA Storm Prediction Center issued a 10%-hatched risk of tornadoes through parts of Mississippi, Georgia, and South Carolina the morning of the storms. Strong low-level flow and destabilization led to supercells forming ahead of a squall line, such as the tornadic supercell that hit Allendale.

Figure 1: SPC tornado outlook and 06Z verification. 

A ProbSevere v3 (PSv3) model, ProbTor, tracked this storm from Georgia into South Carolina. The probability of tornado rapidly increased about 30 minutes before and again 15-20 minutes before a tornado was reported around Allendale. Increasing azimuthal shear, radar reflectivity, and lightning were noted prior to tornadogenesis. See here for meteograms of different predictors for this storm.

Figure 2: ProbSevere v3 (storm contours), MRMS MergedReflectivity, and NWS severe weather warnings. The outer PSv3 contour is colored by the probability of tornado.

One new feature at the HWT last year was the ProbSevere time series or meteogram function in AWIPS, which can be activated by double-clicking a ProbSevere time object. The window displays the latest 2 hours of probability history for the featured storm for all four ProbSevere models (hail, wind, tornado, any severe). The meteogram updates automatically as new data are processed. This feature helps forecasters more quickly interrogate storm trends and will again be available to forecasters at the 2022 HWT. 

Figure 3: The ProbSevere time series window for the tornadic supercell in Allendale, SC.

ProbTor v3 uses a different machine-learning model than ProbTor v2 (gradient-boosted decision trees vs. naive Bayesian classifier). While the maximum CSI for PTv3 is about the same as PTv2, the PTv3 probabilities are much better calibrated. What this means is that the output probability values much better match the observed frequencies of tornadoes, for any given probability value. Users should see much lower false alarm rates at higher probability bins. Given the inherent noise in doppler radar velocity data (and downstream MRMS azimuthal shear), and inherent uncertainties in detecting tornadoes, this also means that PTv3 values over 60% are exceedingly rare.

Compare the attributes diagrams for PTv3 and PTv2 below. A perfectly calibrated or "reliable" model will have predictions follow the 1:1 line. Notice how PTv2 over-predicts, while PTv3 is very close to the 1:1 line, except for some under-prediction around 50-60%. The most-skillful (i.e., highest CSI) probability range for PTv3 is 20-40%. The University of Wisconsin / CIMSS is actively working on improving ProbTor, experimenting with additional data and methods that make better use of the spatial patterns found in satellite and radar data. 

Figure 4: Attributes diagrams for PTv3 and PTv2 on a validation dataset from 2021.

The IntenseStormNet detects particularly intense storms from a satellite-only perspective, using deep learning and images of ABI and GLM data. Using GOES-16 one-minute mesoscale scans, IntenseStormNet reached over 90% on this storm about 10 minutes before the first tornado report. The higher IntenseStormNet probabilities corresponded well to a GLM lightning jump and overshooting tops in ABI imagery. While a tornado warning was already in effect, seeing this feature could add confidence to the warning forecaster. The output of IntenseStormNet is also used in the ProbSevere v3 models.


Monday, May 4, 2020

ICP in an MCS

The Intense Convection Probability (ICP), the product of a convolutional neural network (CNN) trained with ABI 10.3 µm brightness temperature, 0.64 ABI µm reflectance, and GLM flash extent density, highlights intense parts of a MCS that began in Kansas and traveled through the mid-Mississippi Valley. Below, the product was contoured at the 25%, 50%, and 90% levels (blue, cyan, and magenta, respectively), and overlaid 10.3 µm and 0.64 µm sandwich imagery from ABI.

In the movie below, higher ICP is generally found with cold, "bubbly" cloud tops as the MCS propagates, and corresponds well to regions of numerous severe hail and wind reports. Part of the MCS decays in south central Tennessee and northern Alabama, producing many wind reports. The storms in this region had decreasing reflectivity, a dearth of total lightning flash rates, and warming 10.35 µm brightness temperatures, diminishing the ICP. This part of the MCS was becoming decoupled from its source of MUCAPE and forcing, resulting in outflow-dominant storms.

We are hopeful that the ICP will improve ProbSevere by leveraging important satellite information during the mature phase of a storm's lifecycle, as well as quickly identifying developing intense convection emerging from thick ice clouds (e.g., anvil clouds).

Intense Convection Probability product in Kansas and Oklahoma

A shortwave trough is forcing some intense convective storms in Kansas and Oklahoma this morning. With a warm and moist air advection response at 850 mb, and ample deep layer shear (45-55 kts of effective shear), the storms are taking on supercellular characteristics.

UW-CIMSS has developed a convolutional neural network model trained to identify intense convection from geostationary satellite imagery. The model is trained with ABI 10.35 µm brightness temperature, 0.64 µm reflectance, and Geostationary Lightning Mapper (GLM) flash extent density. It was trained to label convection as "intense" as humans would identify intense convection --- with features such as persistent overshooting tops, storm-top thermal couplets or cold-U signatures, above-anvil cirrus plumes, and strong cores of lightning.

The output of this model is the "intense convection probability" (ICP), contoured at 25%, 50%, and 90%  (blue, cyan, and magenta contours, respectively). The NWS severe thunderstorm warnings are also overlaid, showing good correspondence between ICP evolution in storms and human forecaster expectation of severe weather (see Figure 1).

Fig. 1: ICP contours of 25%, 50%, and 90% (blue, cyan, and magenta contours), ABI CH02 + ABI CH13 sandwich product, and NWS severe weather warnings (orange and red box polygons). 

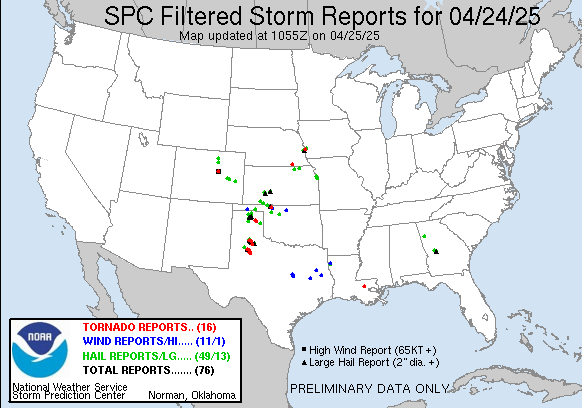
Many hail and wind reports have been recorded in Kansas and northeast Oklahoma, thus far (Figure 2). Work is ongoing to identify other helpful inputs from ABI, enhance the training dataset, and incorporate the ICP product into ProbSevere.

The ICP can be viewed in real-time using this temporary link, powered by SSEC's RealEarth software.

today Filtered Reports Graphic
Fig. 2: Severe weather reports, as of 1455Z on 05/04/2020


Monday, October 21, 2019

Fall severe weather outbreak over the Southern Plains

A strong, negatively tilted, diffluent short wave trough forced severe thunderstorms in the Southern Plains ahead of and along a potent cold front yesterday. Figure 1 shows a high-level evolution of the storms and ProbSevere v2 (PSv2) from discrete to more linear storm modes as the event proceeds.

Fig. 1: GOES-16 IR, MRMS MergedRef, ProbSevere storm contours, and NWS warnings.

One supercell that traveled through downtown Dallas, TX dropped a strong, EF3 tornado which produced much damage, which an NWS survey marked 01:58 UTC as the initial touchdown time. The storm went on to produce an EF1 tornado, starting at 02:36 UTC.


This storm was the right moving supercell after a left split (see Figure 2). Figure 3 shows the time series of PSv2 model output before the split, while Figure 4 shows the time series after the split, including NWS warnings and preliminary storm reports. The storm initially exhibited a strong satellite growth rate and a spike in MRMS MESH, which contributed to the rapid increase in ProbHail and ProbWind.

Fig. 2: ProbSevere, MRMS MergedRef, and NWS severe weather warnings in AWIPS2, depicting the storms affecting the DFW metro area.

You may find the time series of PSv2 model predictors for Figure 2 here and Figure 3 here
Fig. 3: Time series of ProbSevere models for a tornadic storm prior to it splitting. NWS warnings and preliminary storm reports are on the lower axis.
Fig. 4: Time series of ProbSevere models for a tornadic right-moving supercell after it split. NWS warnings and preliminary storm reports are on the lower axis (EDIT: tornado report times are the start times of tornadoes from an NWS survey).

An experimental convolutional neural network, which uses ABI channels 02 and 13, as well as flash extent density from the Geostationary Lightning Mapper, was deployed on this scene. The model produces an "Intense Convection Probability" (ICP). The 50% and 90% contours correspond well with robust satellite signatures, such as overshooting tops and enhanced-Vs. While there is also good correspondence with reports, probabilities of < 25% are present for some hail reports early in the event and some wind reports late in the event, showing that all severe weather is difficult to detect with a satellite-only approach. Regardless, such a model may be able to enhance ProbSevere, especially in regions with no radar coverage. See this CIMSS blog post for more information and examples from this model.