A shortwave trough is forcing some intense convective storms in Kansas and Oklahoma this morning. With a warm and moist air advection response at 850 mb, and ample deep layer shear (45-55 kts of effective shear), the storms are taking on supercellular characteristics.
UW-CIMSS has developed a convolutional neural network model trained to identify intense convection from geostationary satellite imagery. The model is trained with ABI 10.35 µm brightness temperature, 0.64 µm reflectance, and Geostationary Lightning Mapper (GLM) flash extent density. It was trained to label convection as "intense" as humans would identify intense convection --- with features such as persistent overshooting tops, storm-top thermal couplets or cold-U signatures, above-anvil cirrus plumes, and strong cores of lightning.
The output of this model is the "intense convection probability" (ICP), contoured at 25%, 50%, and 90% (blue, cyan, and magenta contours, respectively). The NWS severe thunderstorm warnings are also overlaid, showing good correspondence between ICP evolution in storms and human forecaster expectation of severe weather (see Figure 1).
 |
| Fig. 1: ICP contours of 25%, 50%, and 90% (blue, cyan, and magenta contours), ABI CH02 + ABI CH13 sandwich product, and NWS severe weather warnings (orange and red box polygons). |
Many hail and wind reports have been recorded in Kansas and northeast Oklahoma, thus far (Figure 2). Work is ongoing to identify other helpful inputs from ABI, enhance the training dataset, and incorporate the ICP product into ProbSevere.
The ICP can be viewed in real-time using this
temporary link, powered by
SSEC's RealEarth software.
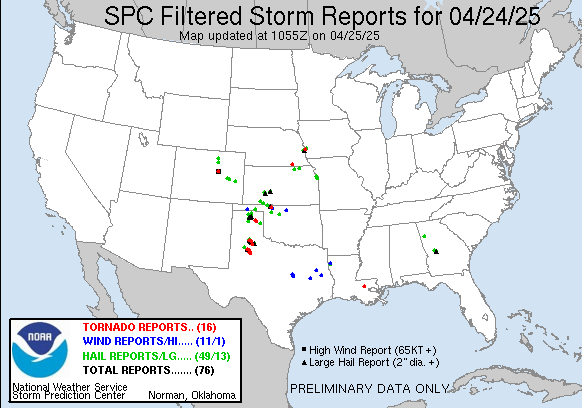 |
| Fig. 2: Severe weather reports, as of 1455Z on 05/04/2020 |
