Showing posts with label DSS. Show all posts

Wednesday, May 13, 2026

SPG Blog Post Template Day 3

Disclaimer: I had alot of internet and AWIPS issues today :-(. So I mostly got experience with DSS procedures. After IT helped me (Thank you!!) I was able to get some warnings out. I’m sorry for the issues!

Today, we looked at a slight risk out in Idaho. A relatively strong low pressure system with an associated cold front moved through, providing decent parameters for wind concerns in the PIH CWA. This event featured some initially shallow pop-up convection, that quickly blew up to storms that were producing 70-85mph winds over eastern Idaho! Very interesting setup, because the only really notable instability initially noticed was the impressive DCAPE (1000-2000 J/kg), and decent lapse rates. Was hard to notice before reports rolled in, since the storms really did not look impressive on satellite or radar.

Figure 1: WVT (left: colored color map, right: greyscale)
  • During the quiet period of the event in Idaho, after sending out Slack messages and a briefing slide to partners, I played around with the color maps for the WVT product. This one is based off of a WV map product that SLC uses. You can see the seabreeze move in pretty well during this time frame (lighter green = moisture).
    • I sent this color map in the Slack group!


Figure 2: LightningCast Stoplight over PIH


  • LightningCast was great today for having multiple DSS events!
    • This is an image where I made the colormap slightly transparent so you can see the imagery underneath the stoplight colors a bit more clearly.
    • What isn’t visible here, was that I had the “0-10” range blinking, to help grab attention quickly.
    • I also used the SuperDashboard today! I really liked it - especially when I had AWIPS issued and had to rely on desktop products more than AWIPS.
      • I oddly enough couldn’t get both events on the dashboard at the same time? Both events existed and had links. At first, it was because they started at different times because I had entered the wrong time zone. But, when both events should have been active, only one appeared. The links themselves sent to my email, however, worked just fine!
-Kelvin-Helm

Severe Weather over western Pennsylvania

 On Day 3 Wednesday of the Hazardous Weather Testbed, we monitored weather for the Pittsburgh CWA (PBZ), and in particular lightning and severe weather that could affect the Pittsburgh Mimosa Festival and the Allegheny Caribbean Carnival. We issued several SVRs that ended up verifying with multiple hail reports of 1.0” in diameter (quarter size) and a few damaging wind reports in northern WV. See SPC reports further below.


The main radar products that were used for severe weather decision making were the 0.5° Base Reflectivity and Base Velocity products, the MRMS @-20C, Vertically Integrated Ice, and MESH. LightningCast V2 and Stoplight V2 were also used to support DSS activities at the two festivals mentioned above. At the beginning of the event at 18Z, thunderstorms were already impacting the two festivals as seen on the Time-Series plot of LightningCast with observed GLM flash counts and near 100% lightning probability at the exact locations.


Figure 1 above shows the probability of lightning at the location of the Allegheny Caribbean Carnival from LightninCast V2 (green line) and the observed flash counts from the Geostationary Lightning Mapper (GLM) instrument. Notice that the second spike in lightning probabilities did not result in lightning activity detected at the exact location as shown by the lack of GLM flash counts. In this second spike in lightning probability, the LightningCast V2 had a small false alarm than the V1 product.


Figure 2 above shows the Pittsburgh Mimosa Festival experienced two rounds of thunderstorms, one between 18Z and 19Z and a second round between 1945Z and 20Z.

We also monitored the Stoplight V2 product to give the all clear message that the lightning threat had ceased.

Figure 3 above shows the Stoplight product indicating the cessation of lightning and when it was good to give the all clear message that activities could be resumed.

Figure 4 above shows the MRMS Isothermal Reflectivity product @-20C which often shows the most significant storms and the storms that might contain hail alongside the Vertically Integrated Ice. SVRs polygons are also shown to indicate where SVRs were issued.


Figure 5 above shows the SPC’s Severe Weather reports from Wed May 13 2026. Four hail reports of quarter size were reported in western Pennsylvania and three wind damage reports in northern WV.

-Hurricane Specialist


Tuesday, May 12, 2026

DSS: Max Road Fire

 During Day 2 of the Hazardous Weather Testbed, we provided mock-DSS to the Max Road Fire located in South FL along the Broward and Miami-Dade county line. Since this was a DSS event, we evaluated the two most important products related to lightning onset and cessation, LightningCast V1 vs V2 and the Stoplight product, at the fire location making sure firefighters had ample lead to time to seek shelter before lightning struck the area. We also requested an on-demand dashboard display of LightningCast V1 and V2 at the exact fire location to help monitor probability trends of lightning activity.

Figure 1 (above): shows an animation of LightningCast V1 (images on the left) vs Lightning V2 (images of the right). Notice the higher probabilities indicated by V2 on the right of up to 70% vs  50% on the left. It turned out that LC V2 provided a much longer lead time of lightning onset just outside the range ring over the fire location.


Figure 2 (above): shows the Spotlight V2 product (GLM FED + ENTLN combined) confirming lightning activity at 1921Z outside of the 8-mile radius from the fire location.


Figure 3 (above): shows a time series plot showing the probability trends of lightning at the exact location of the fire and also the maximum probability of lightning within the 8-mile radius of the fire location. Lightning was detected by the GLM instrument around 2041Z (image below) when the LightningCast probability trends showed a rapid upward trend in probabilities (image above)


Lastly, the Solar Zenith Angle imagery below provided a clearer view of the texture of the clouds right on the coast just north of Miami roughly an hour before sunset when compared to the traditional imagery on the right.

Figure 1: Solar Zenith Angle imagery at 606 PM EDT, almost two hours before sunset. Sunset at Miami (MIA) was at 7: 58 PM as shown on the Climate Daily Report (CLI) from NWS MFL.

Hurricane Specialist


Tuesday, April 28, 2026

Tuesdays HWT

Main issue today was to do IDSS near Delhi MS. We were using lightning cast and lightning stoplight. We were also issued a few warnings. Fortunately, we had a storm move over the region so we were quite busy for at least an hour or so.

Our team created some loops of the data. A long loop of GLM and ltg prob is below …


The blinking circle was our DSS site. Lena was our “emergency manager” for the day.

We had thorough conversations with Lena and Kevin regarding using the tow lightning products in operations. We agreed that the products are very useful, but would not work all that well to send these products directly to our partners.

Note that we had a thorough conversation on the slack channel and you can follow the “blow by blow” discussions there.

We also had a great conversation with Lena regarding how we interact with our emergency managers.

Regarding Lightncast, I believe that the planview products are good. I prefer looking at the imagery like this though >>>>


Note that the data probabilities on the awips image above go from 0% to 100 percent.  Why is it important to show the data this way instead of contours? The reason is you can see the VERY beginning of when the ltg probs start to show up. Using contours, you have to wait until the 10% prob shows up. Note that I do not have sat pix imagery overlaid, The reason why I do this with AWIPS is I can have the sat pix data opened up in another panel and use the cursor to read the data. Also the contours (or the image for that matter) would get “lost” (or buried) within the colors of the sat pix imagery.

We used the Lightning Stoplight product today. This was helpful in letting us know when the last flash occurred in the 10, 20 and 30 increment time frame. However I am hesitant with sharing this directly with the EMs.

I envision that the Stoplight product and the LightningCast product will be married in the future, and this will make these two products more useful.

I can not say enough how valuable the lightningcast product is. Prior to this we did not have a good idea when lightning would be a threat, and would have to carefully watch radar data and do cross sections or monitor to -10C level. With lightningcast, you have the probabilities calculated for you in real time every minute (mesosector) or every 5 minutes for CONUS.(However waiting 5 minutes is wayyyyyyyy toooooo lonnnnnnnnnnnnng.

We talked about the SZA product. This is a no brainer and this satellite product should be implemented operationally as soon as possible. Being able to see the detail in the sat pix data towards sunset is priceless.

-Mesovortex

April 28th Hazmat DSS

 By Blizzard

Warm Sector Growth: Jaxson MS

The day started this morning with thunderstorm development from the overnight outflow boundary that remained in the southeast. This was quickly replaced by 1500 to 2500 j/kg of MUCAPE. There was 40 kts of shear, which would help to sustain any pre-frontal convection. With dewpoints in the warm sector approaching 75° in Northeast Louisiana. A very shallow cap was present, but quickly eroded from solar heating. Once the cap was eroded we got rapid growth of a thunderstorm complex. This complex moved slowly across Northeast Louisiana and Central Mississippi throughout the afternoon.

DSS operations for a Hazmat: Northeast Louisiana

We coordinated with a hazmat cleanup site that was near the Louisiana/Mississippi border. The emergency manager had required the heads up on lightning within a 10 mile radius of the location. In the figure below we see a developed thunderstorm complex that is moving west to east across the segment of the 10 mile radius. The OCTANE product allowed us to build confidence on a strengthening thunderstorm near the hazmat clean up area. We can see a very moist inflow on the southwestern edge of the complex. It was good that we were able to see a very distinct inflow because we received a report of 1.75” hail. This inflow allowed the thunderstorm to continue to strengthen.

Cessation of Lightning:

The biggest question the public or our partners will ask, is when will the lightning end. We used a variety of tools to determine when it is good to give the all clear. They were the lightning stoplight, lightning cast, and radar. With this event we heavily relied on the stoplight and radar, due to a lag in the lightning cast probabilities. While lightning cast had identified lower chances it would still put over 50% probabilities when the threat had been over for 30 minutes.  

The first graphic shows a quick downward response to the cessation of lightning. However, on the second graphic we see lightning probabilities remain elevated for a long period of time. Using other tools like lightning stoplight and radar, it makes no sense that we should be holding the all clear until the probabilities go near 0. While lightning cast may not be perfect, it is another tool in the toolbox.


Thursday, June 15, 2023

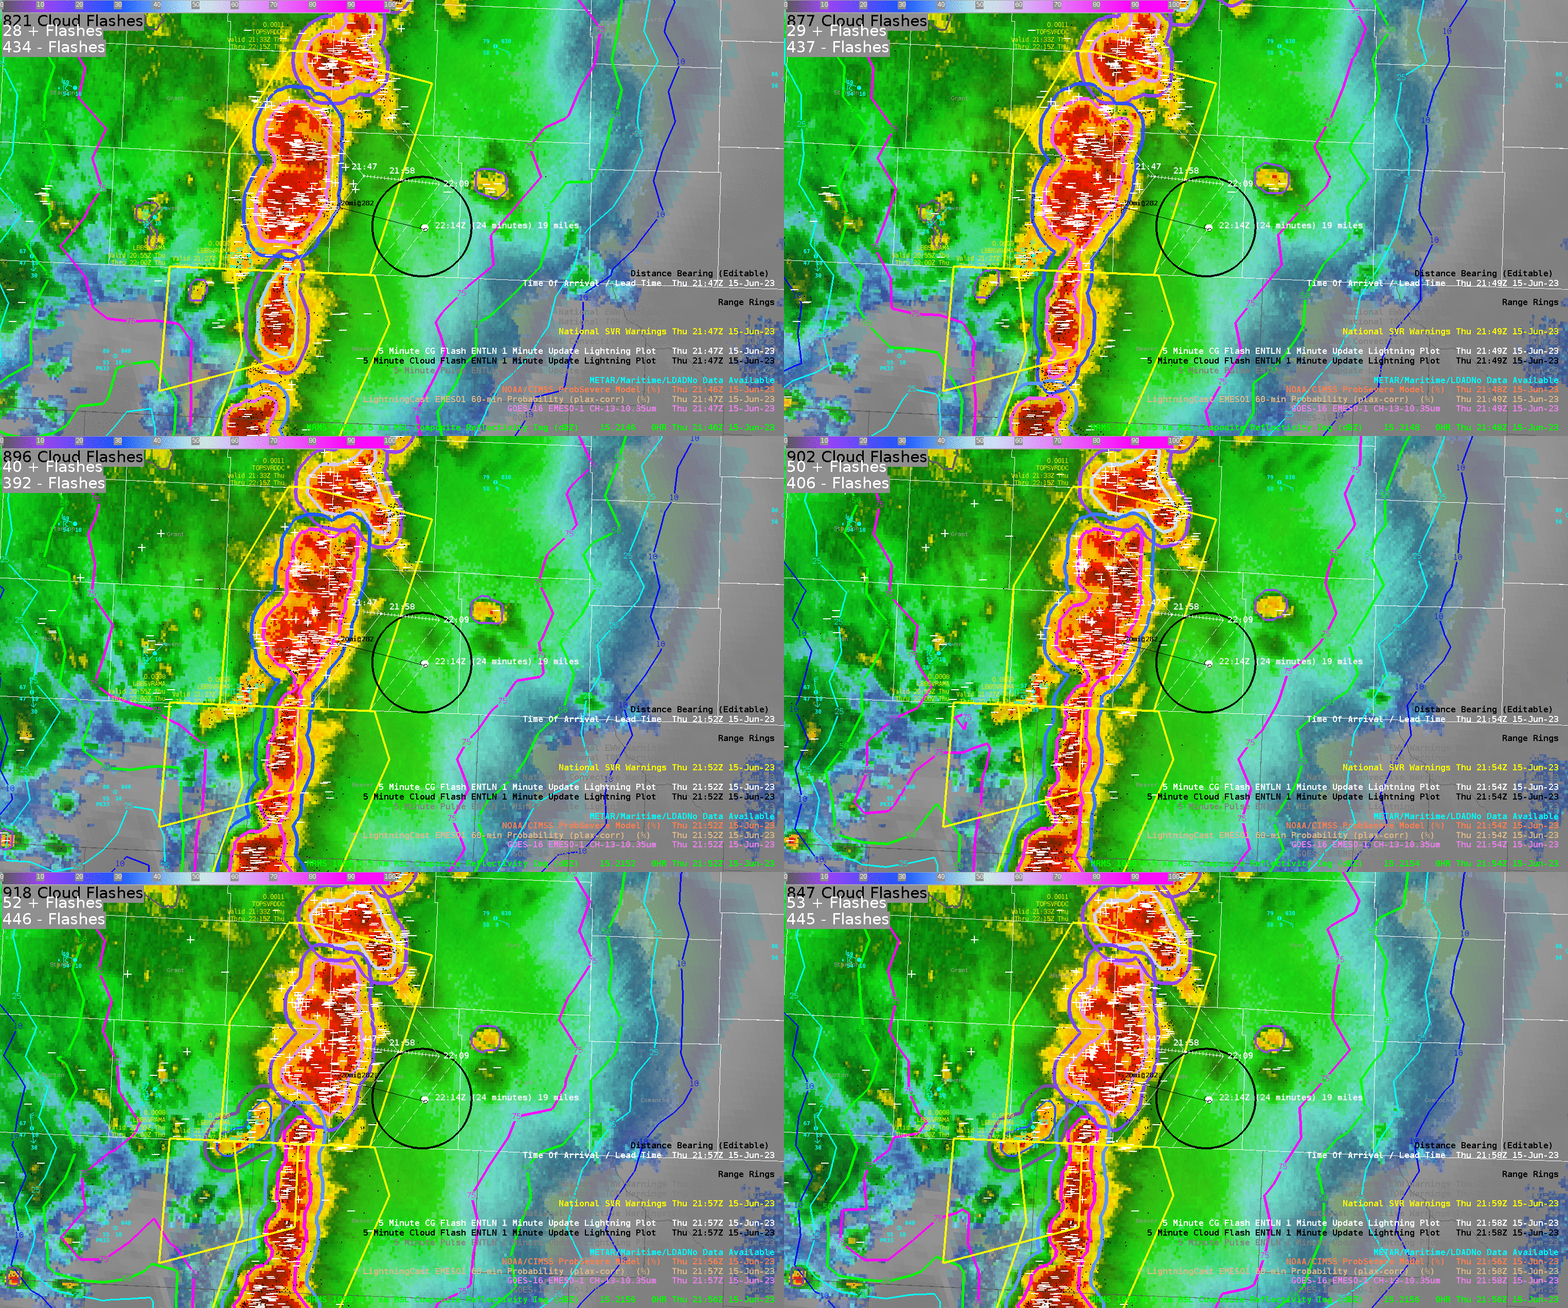
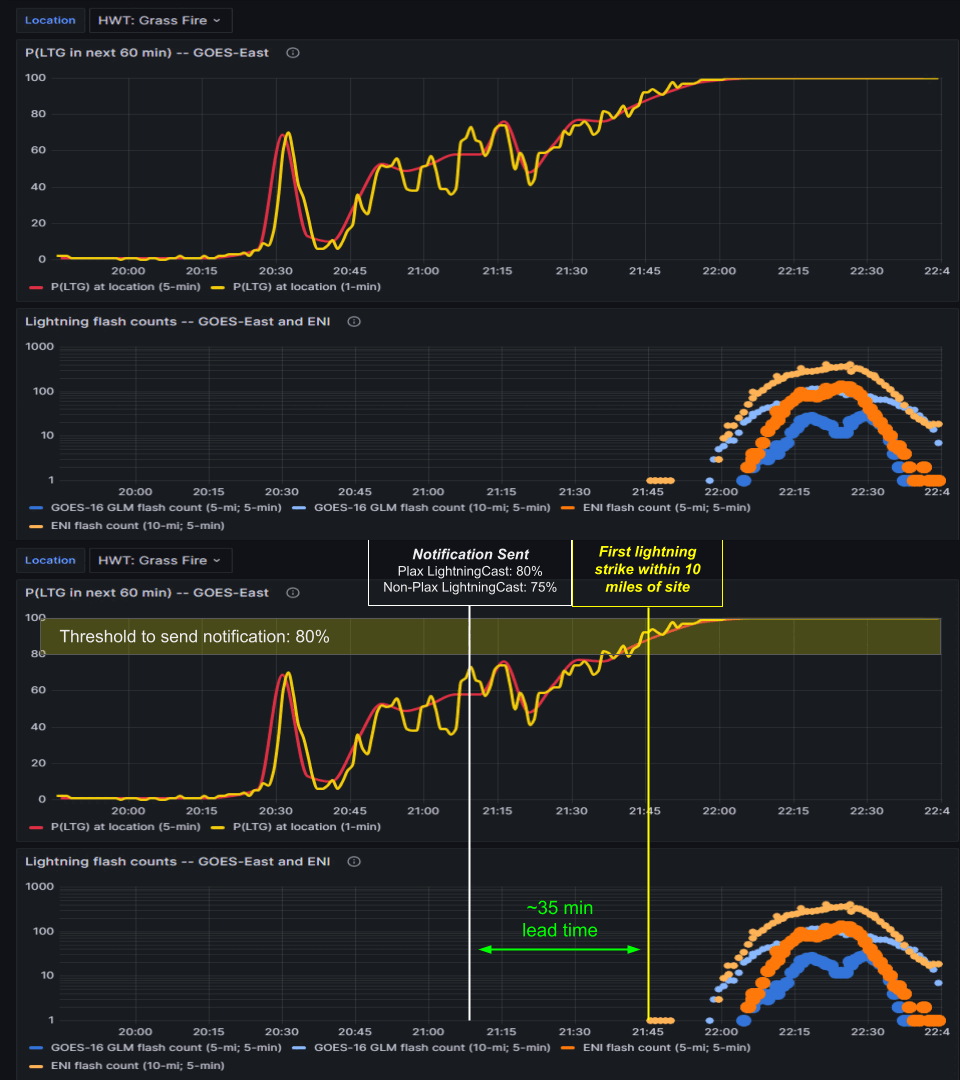
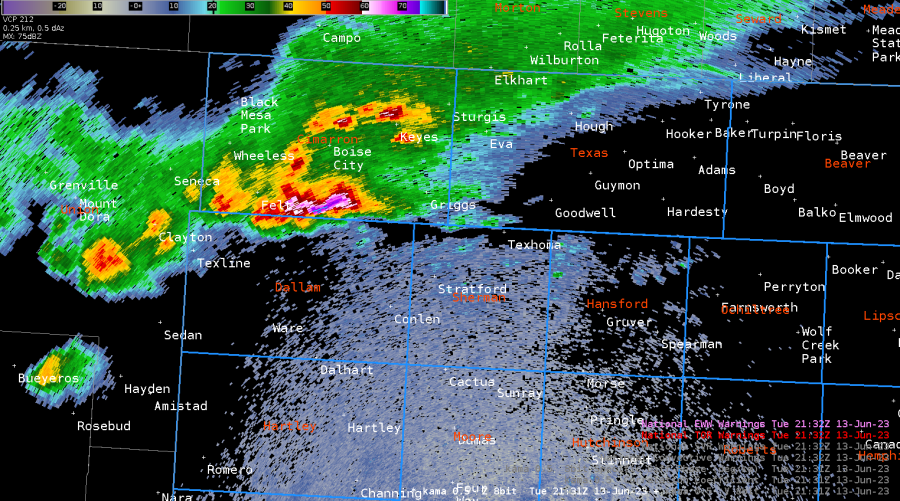
June 15, 2023 - Role playing as DDC, I was tasked with providing DSS for a (fictitious) grass fire near Meade, KS. DSS: Grass fire near Meade, KS For this DSS, requested information included lightning within 10 miles of the site, any significant changes in wind speed and direction, as well as other hazardous weather that would pose a risk to emergency personnel containing the fire. Figure 1. There was ongoing severe convection within the western half of the CWA by the start of my shift, and there was a high likelihood of this convection approaching the DSS site. As shown in Figure 1,  my datasets/tools of choice for tracking severe convection and lightning were as follows: GOES-East Mesosector LightningCast, MRMS Composite Reflectivity, ENTLN intracloud and cloud to ground lightning, surface observations, Time of Arrival Tool, Distance Bearing Tool, and Range Rings Tool. Ground based lightning observations and LightningCast complimented each other nicely when assessing the potential for lightning at the site. Additionally, LightningCast picked up on additional agitated Cu well ahead of the main line of thunderstorms closer to the DSS Site. Using the Time of Arrival tool to track the main cluster of cloud to ground lightning associated with the severe convection was also very useful in providing information on potential to see most lightning via advection, in the absence of additional convective initiation and/or a rapid change in forward speed in ongoing convection. Figure 2. Some consideration was made to not “overwarn” on lightning potential as the main breadth of lightning would likely come from the severe convection still well off to the west. So with this particular scenario, I set an internal threshold of 80% within LightningCast to send a DSS message. The data readout of the parallax corrected LightningCast offered within AWIPS (not shown) was favored over the non-parallax corrected time series (Figure 2), giving higher confidence in the true probability of occurrence used within the DSS message. This gave around a 35 minute lead time before the first strike was detected within 10 miles of the DSS site. Had we used the non-parallax corrected readout values, lead time would have been much shorter, around 10 minutes using 1-minute imagery and less than 10 minutes using 5-minute imagery. This clearly demonstrates the value of using parallax corrected data compared to non-parallax corrected data when performing DSS. Here was the DSS message sent at around 21:10 UTC: Severe thunderstorms have developed around 50 miles to your west, and will likely move over your site between 5:15 pm to 6:30 pm CDT. There is a high chance for storms to remain severe by the time they reach your site, bringing very strong winds over 70 mph out of a direction ranging between northerly to westerly, large hail, heavy rainfall, frequent lightning. We still cannot rule out the potential for a brief tornado, although the chance for a tornado is much lower than previous hazards mentioned. Because of the approaching thunderstorms, the chance for lightning to occur within 10 miles of your site within the next hour (5:15 pm CDT) is over 80%. - 0SMBLSN

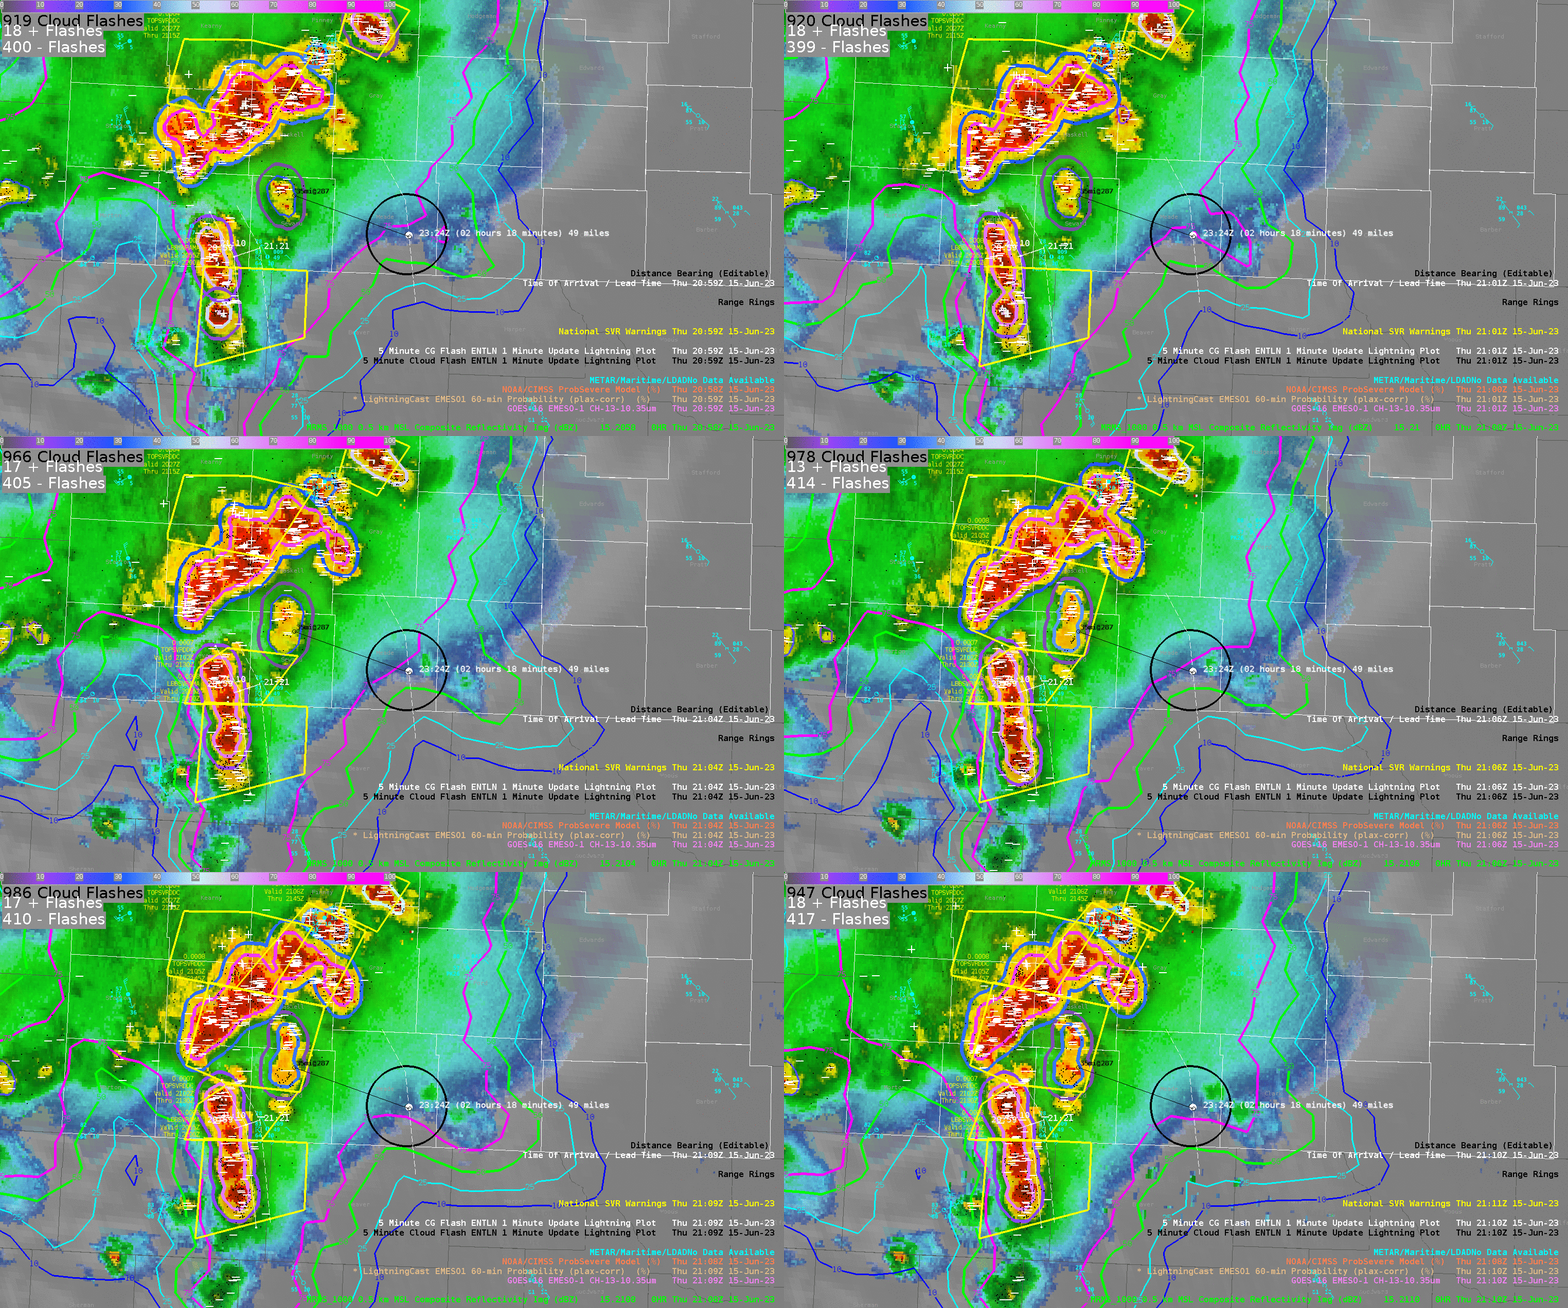
 While providing (fictitious) DSS for a grass fire near Meade, KS on June 15, 2023, LightningCast was utilized in notifying the onset of lightning within 10 miles of the DSS site as a line of severe thunderstorms approached. Additionally, consideration was given to the potential for lightning cessation over the site in an effort to give information on potential for the “all clear.”

Figure 1.

LightningCast within the trailing anvil portion of the squall line steadily dropped off within the trailing stratiform region. However, these probabilities decreased when cloud to ground lightning was still being observed, with even some strikes occurring in probabilities less than 10%. This can be seen in Figure 1 in the far left hand portion of the animation with CG icons occurring within and outside of the lower contours of LightningCast.

This significantly lowered confidence in tracking the lower probability contours to give an estimated time of cessation.

Here was the DSS message sent at around 21:45 UTC:

As of 4:45 pm CDT, severe thunderstorms are 20 miles west of your site, and continue to approach your site. There is a very high chance these storms remain severe by the time they reach your site, currently expected between 5:15 pm and 5:45 pm CDT, bringing very strong winds over 70 mph out of a direction ranging between northerly to westerly, heavy rainfall, and frequent lightning. We still cannot rule out the potential for a brief tornado and large hail, although the chance for a tornado and hail is much lower than previous hazards mentioned.

Because of the approaching thunderstorms, the chance for lightning to occur within 10 miles of your site within the next hour (5:45 pm CDT) is over 99%.

It is worth noting that even after severe hazards associated with this line of thunderstorms have ended, there will remain over 75% chance of lightning over your site for an additional 1-2 hours, along with the potential for continued gusty winds over 20 mph ranging out of the southeast to northeast.

- 0SMBLSN

Utility of Parallax Corrected LightningCast Versus Non-Corrected within DDC

 June 15, 2023 - Role playing as DDC, I was tasked with providing DSS for a (fictitious) grass fire near Meade, KS.

DSS: Grass fire near Meade, KS

For this DSS, requested information included lightning within 10 miles of the site, any significant changes in wind speed and direction, as well as other hazardous weather that would pose a risk to emergency personnel containing the fire.

Figure 1.

There was ongoing severe convection within the western half of the CWA by the start of my shift, and there was a high likelihood of this convection approaching the DSS site. As shown in Figure 1,  my datasets/tools of choice for tracking severe convection and lightning were as follows: GOES-East Mesosector LightningCast, MRMS Composite Reflectivity, ENTLN intracloud and cloud to ground lightning, surface observations, Time of Arrival Tool, Distance Bearing Tool, and Range Rings Tool.

Ground based lightning observations and LightningCast complimented each other nicely when assessing the potential for lightning at the site. Additionally, LightningCast picked up on additional agitated Cu well ahead of the main line of thunderstorms closer to the DSS Site. Using the Time of Arrival tool to track the main cluster of cloud to ground lightning associated with the severe convection was also very useful in providing information on potential to see most lightning via advection, in the absence of additional convective initiation and/or a rapid change in forward speed in ongoing convection.

Figure 2.

Some consideration was made to not “overwarn” on lightning potential as the main breadth of lightning would likely come from the severe convection still well off to the west. So with this particular scenario, I set an internal threshold of 80% within LightningCast to send a DSS message. The data readout of the parallax corrected LightningCast offered within AWIPS (not shown) was favored over the non-parallax corrected time series (Figure 2), giving higher confidence in the true probability of occurrence used within the DSS message. This gave around a 35 minute lead time before the first strike was detected within 10 miles of the DSS site. Had we used the non-parallax corrected readout values, lead time would have been much shorter, around 10 minutes using 1-minute imagery and less than 10 minutes using 5-minute imagery. This clearly demonstrates the value of using parallax corrected data compared to non-parallax corrected data when performing DSS.

Here was the DSS message sent at around 21:10 UTC:

Severe thunderstorms have developed around 50 miles to your west, and will likely move over your site between 5:15 pm to 6:30 pm CDT. There is a high chance for storms to remain severe by the time they reach your site, bringing very strong winds over 70 mph out of a direction ranging between northerly to westerly, large hail, heavy rainfall, frequent lightning. We still cannot rule out the potential for a brief tornado, although the chance for a tornado is much lower than previous hazards mentioned. Because of the approaching thunderstorms, the chance for lightning to occur within 10 miles of your site within the next hour (5:15 pm CDT) is over 80%.

- 0SMBLSN

Wednesday, June 14, 2023

Verification of NUCAPS Soundings

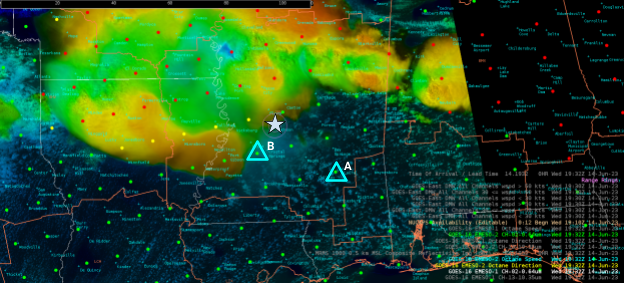
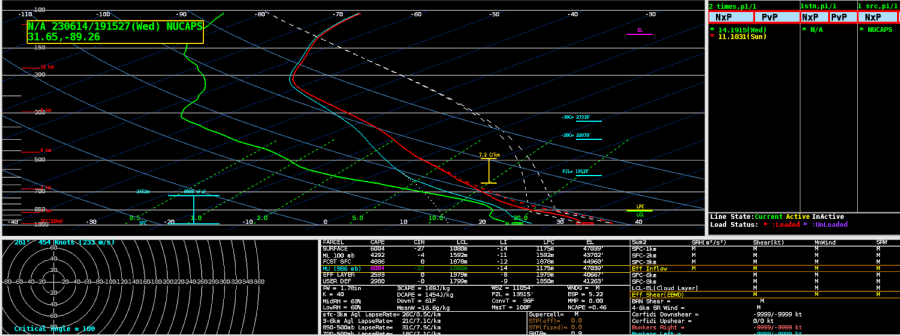
 Using the 1930z pass of the NUCAPS soundings during an SPC Moderate Risk was quite exciting.  The environment was primed for significant severe weather and having NUCAPS soundings available at the time of convection out of ahead of storms was beneficial. It provided additional confidence in the severity of the environment. 

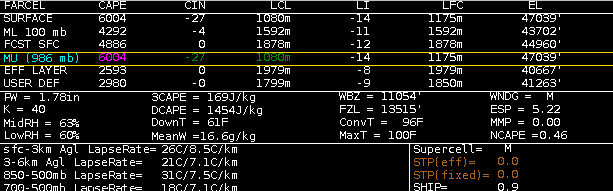
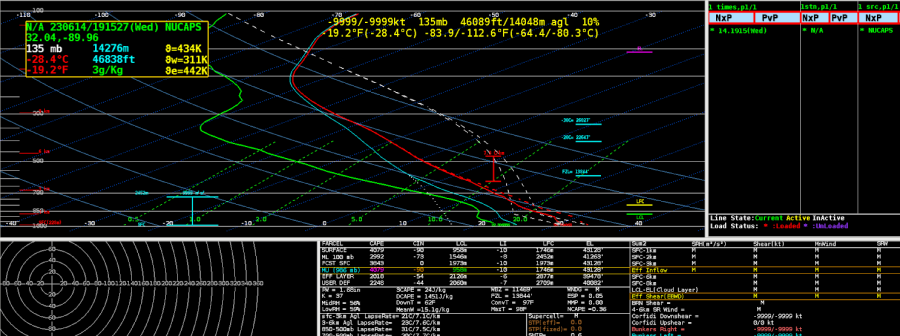
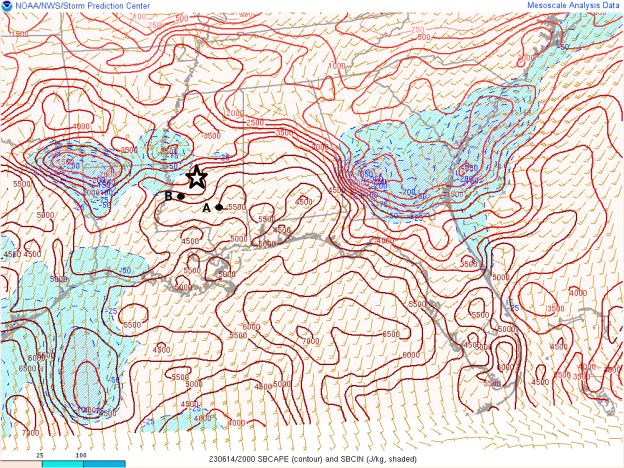
As you can see from the satellite, soundings were unusable further north due to the ongoing convection and cloud cover. Thankfully clear skies prevailed from Jackson and southeastward providing some impressive sounding data to compare to SPC Mesoanalysis.  Sounding A was well in the warm sector and sunny skies and thus had the highest CAPE values and lapse rates. Sounding B was just to the southwest of the DSS event and was beginning to see some anvil over that location, but it still provided reasonable data and compared well with SPC mesoanalysis.    

Figure 1: Location of the NUCAP Soundings chosen to view and compare to SPC mesoanalysis. For reference, the range rings outline the 5 and 10-mile radius around a DSS event in Jackson, MS. 

Figure 2: Sounding A with a surface-based CAPE of 6004!
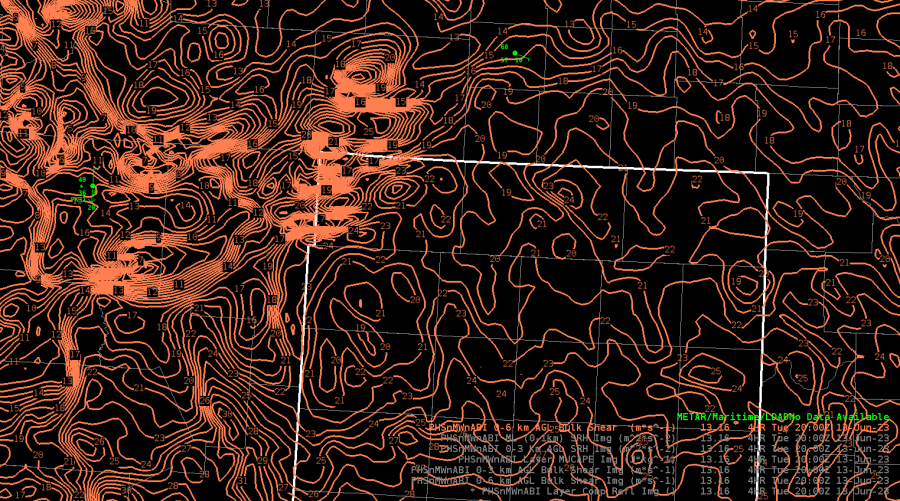
Figure 3: Sounding B with a modest 4079 surface-based CAPE.

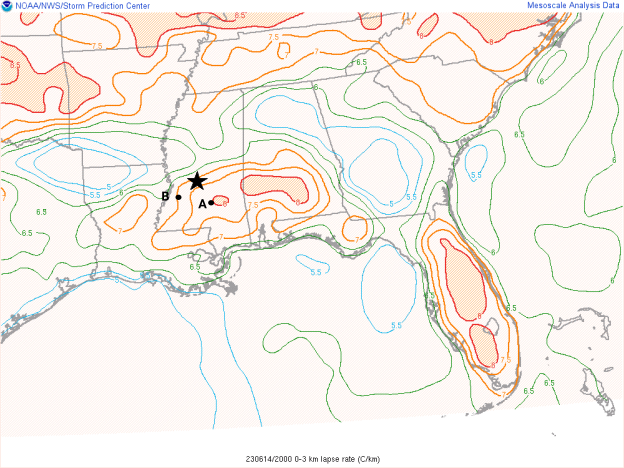
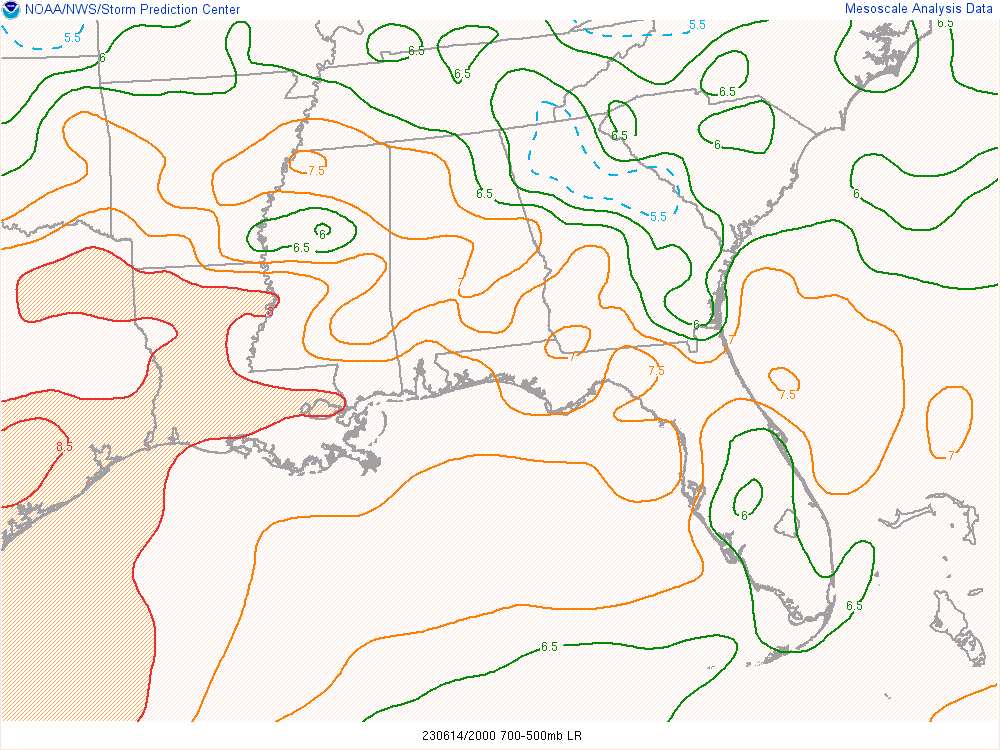
Figure 4: SPC mesoanalysis Surface-Based CAPE and CIN at 20z on June 14, 2023.  The star is the DSS event location and the two dots are the estimated location of the soundings analyzed.

Figure 5: SPC Mesoanalysis 0-3km lapse rate (C/km) depicted lapse rates from 7.0-8.0. Once again, both soundings matched up well with SPS data.

- Podium

PHS Reflectivity Forecast Helping Out with DSS

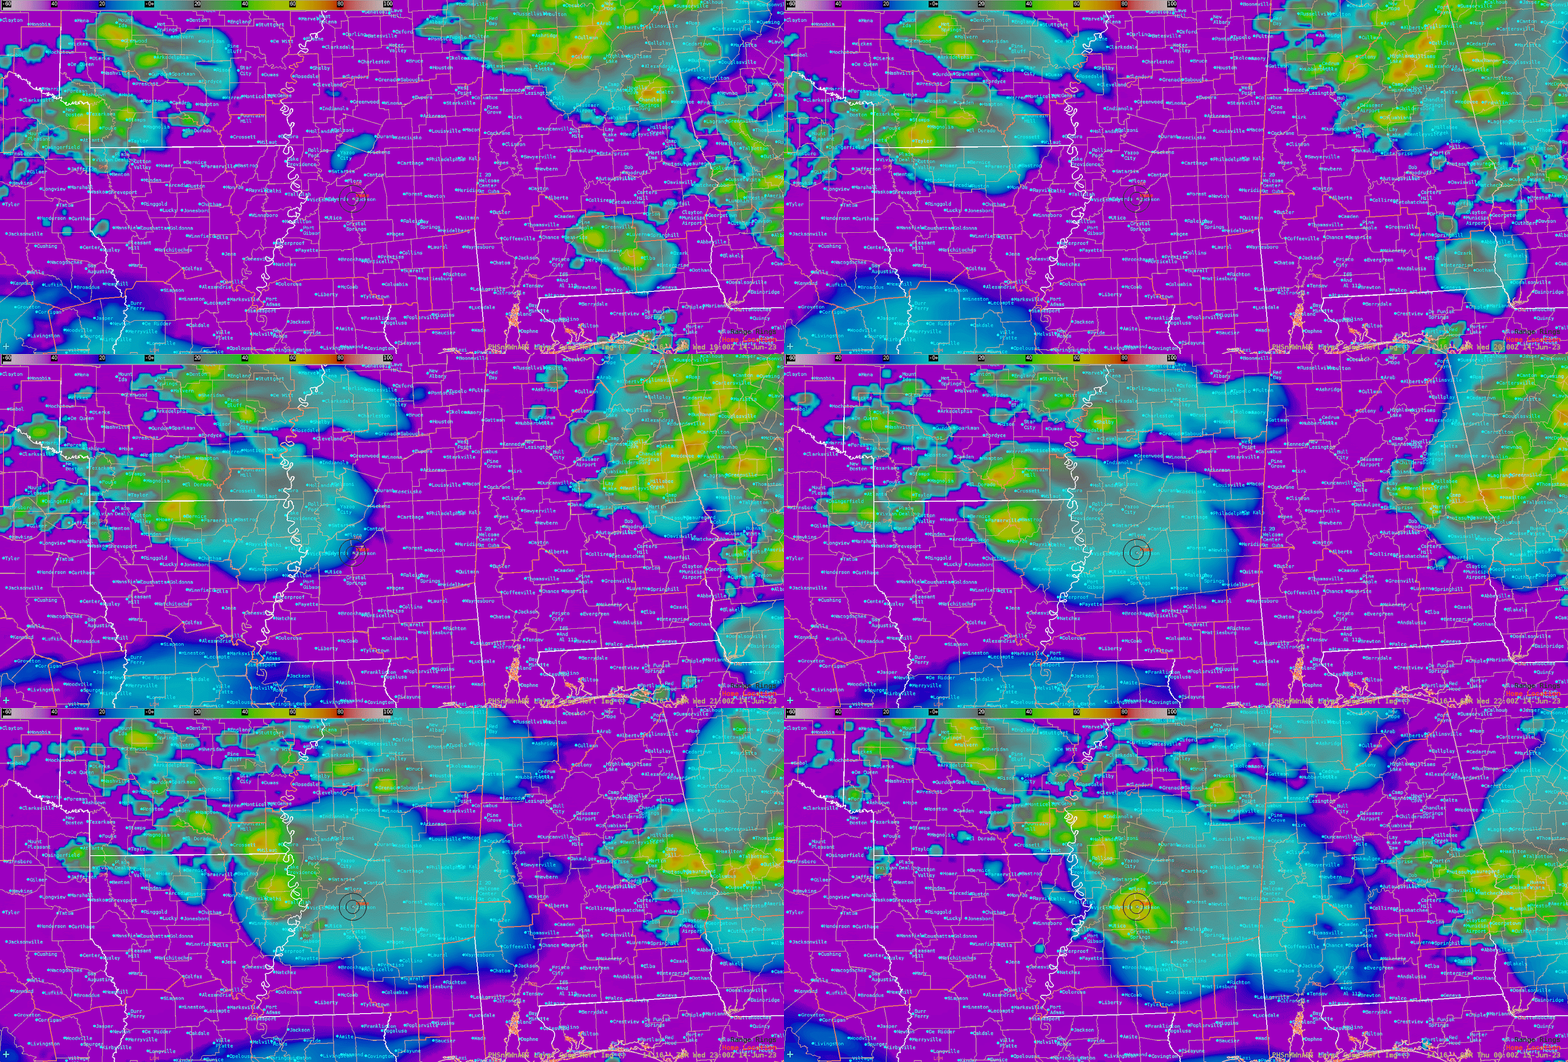
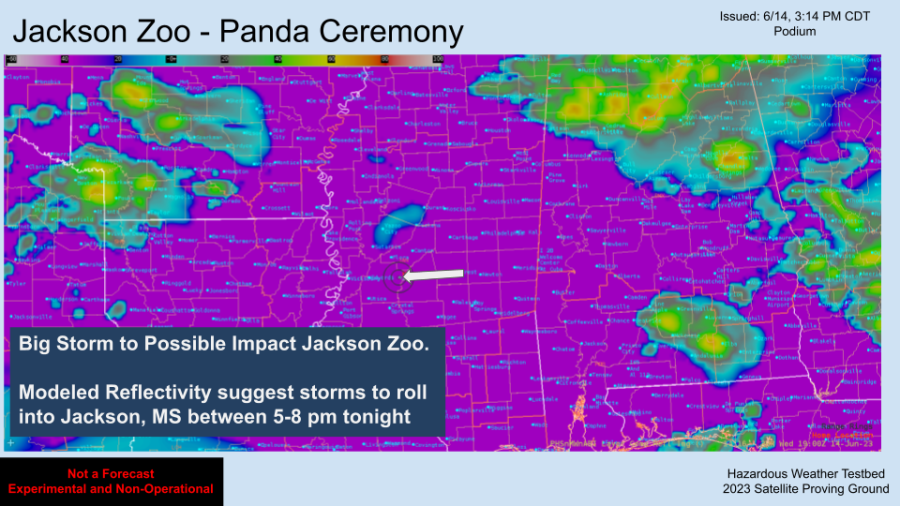
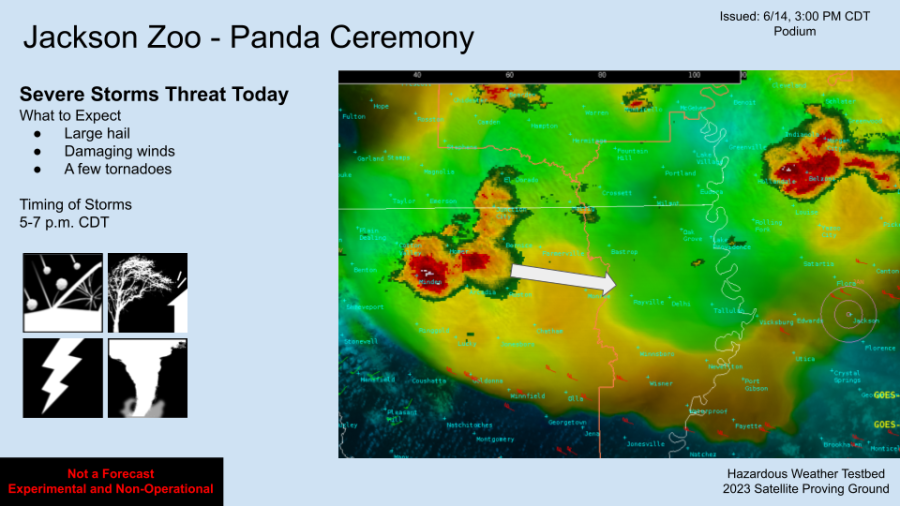
 The Panda Ceremony was held at the Jackson, MS Zoo on the evening of Wednesday, Jun 14, 2023.  Strong to severe storms were forecast throughout the afternoon and evening hours and the event coordinator requested DSS for lightning and any severe weather with as much lead time as possible.  Using the 14.16z initialization of the PHS reflectivity was useful in providing some timing details to the event coordinator (See Figure 1). It suggested a fairly robust storm to roll through the Jackson area by around 00z with the forecast reflectivity ranging from 50-65 dBz directly over the event site.  

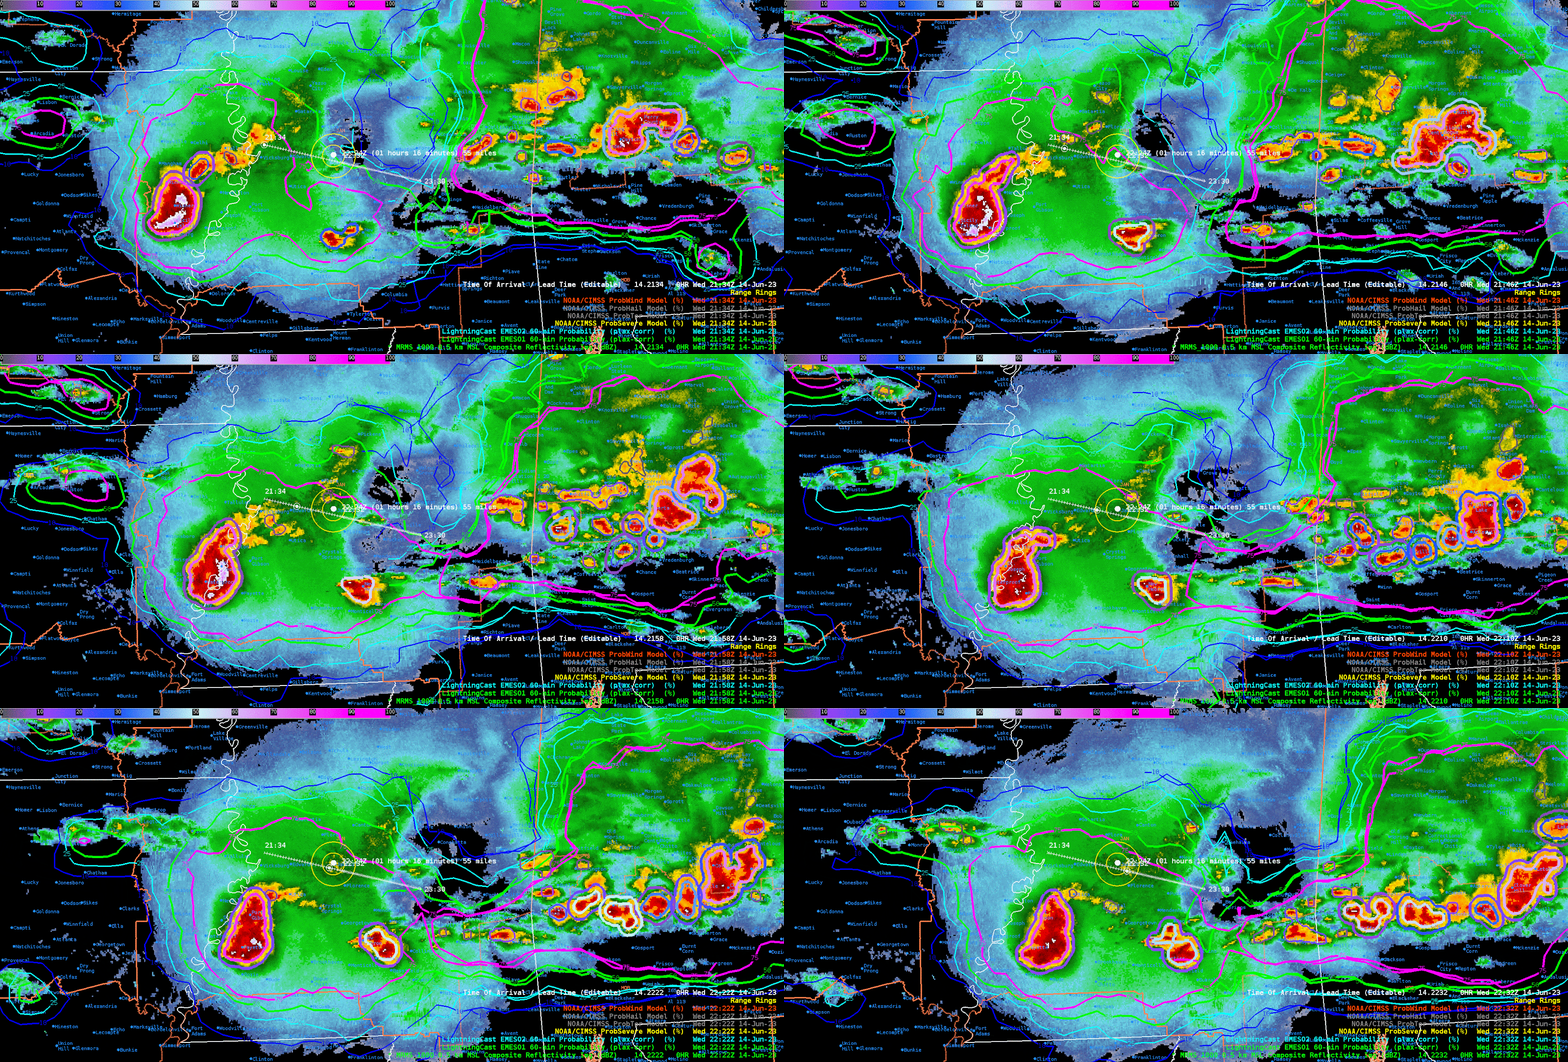
The reflectivity forecast did well with depicting a fairly large storm to move across southern Mississippi but was a bit too north on the location.  Overall, the product was very useful in boosting the forecaster’s confidence in the convection timing to impact the event. See Figure 4 for a look a the verification.

Figure 1: Loop of the 14.16z PHS layer reflectivity had a large storm over Jackson, MS, and impact the event (black range ring) by 00z.

Figure 2: A DSS Graphic was issued shortly after 3 p.m. to highlight the timing and potential impacts of the Panda Ceremony.  The original image had the animated GIF above with the PHS reflectivity forecast.

Figure 3: This was the first of 3 graphics created for the event and this graphic highlighted the severe weather threat and timing.  Overlaid is the MRMS reflectivity greater than 35 dBz and OCTANE Winds.

Figure 4:  A loop of MRMS with ProbSevere and LightningCast shows some verification of the PHS reflectivity forecast shown above. This loop ends at 2232z.   

- Podium

BMX Severe Thunderstorms

 Overall, I used OCTANE, PHS, ProbSevere 3 and LtgCast today. NUCAPS wasn’t really accessible. Worked the DSS event, an Air Show, which was canceled due to severe thunderstorms all afternoon producing tornadoes, large hail and damaging winds. DSS for this event would have been done days ago.

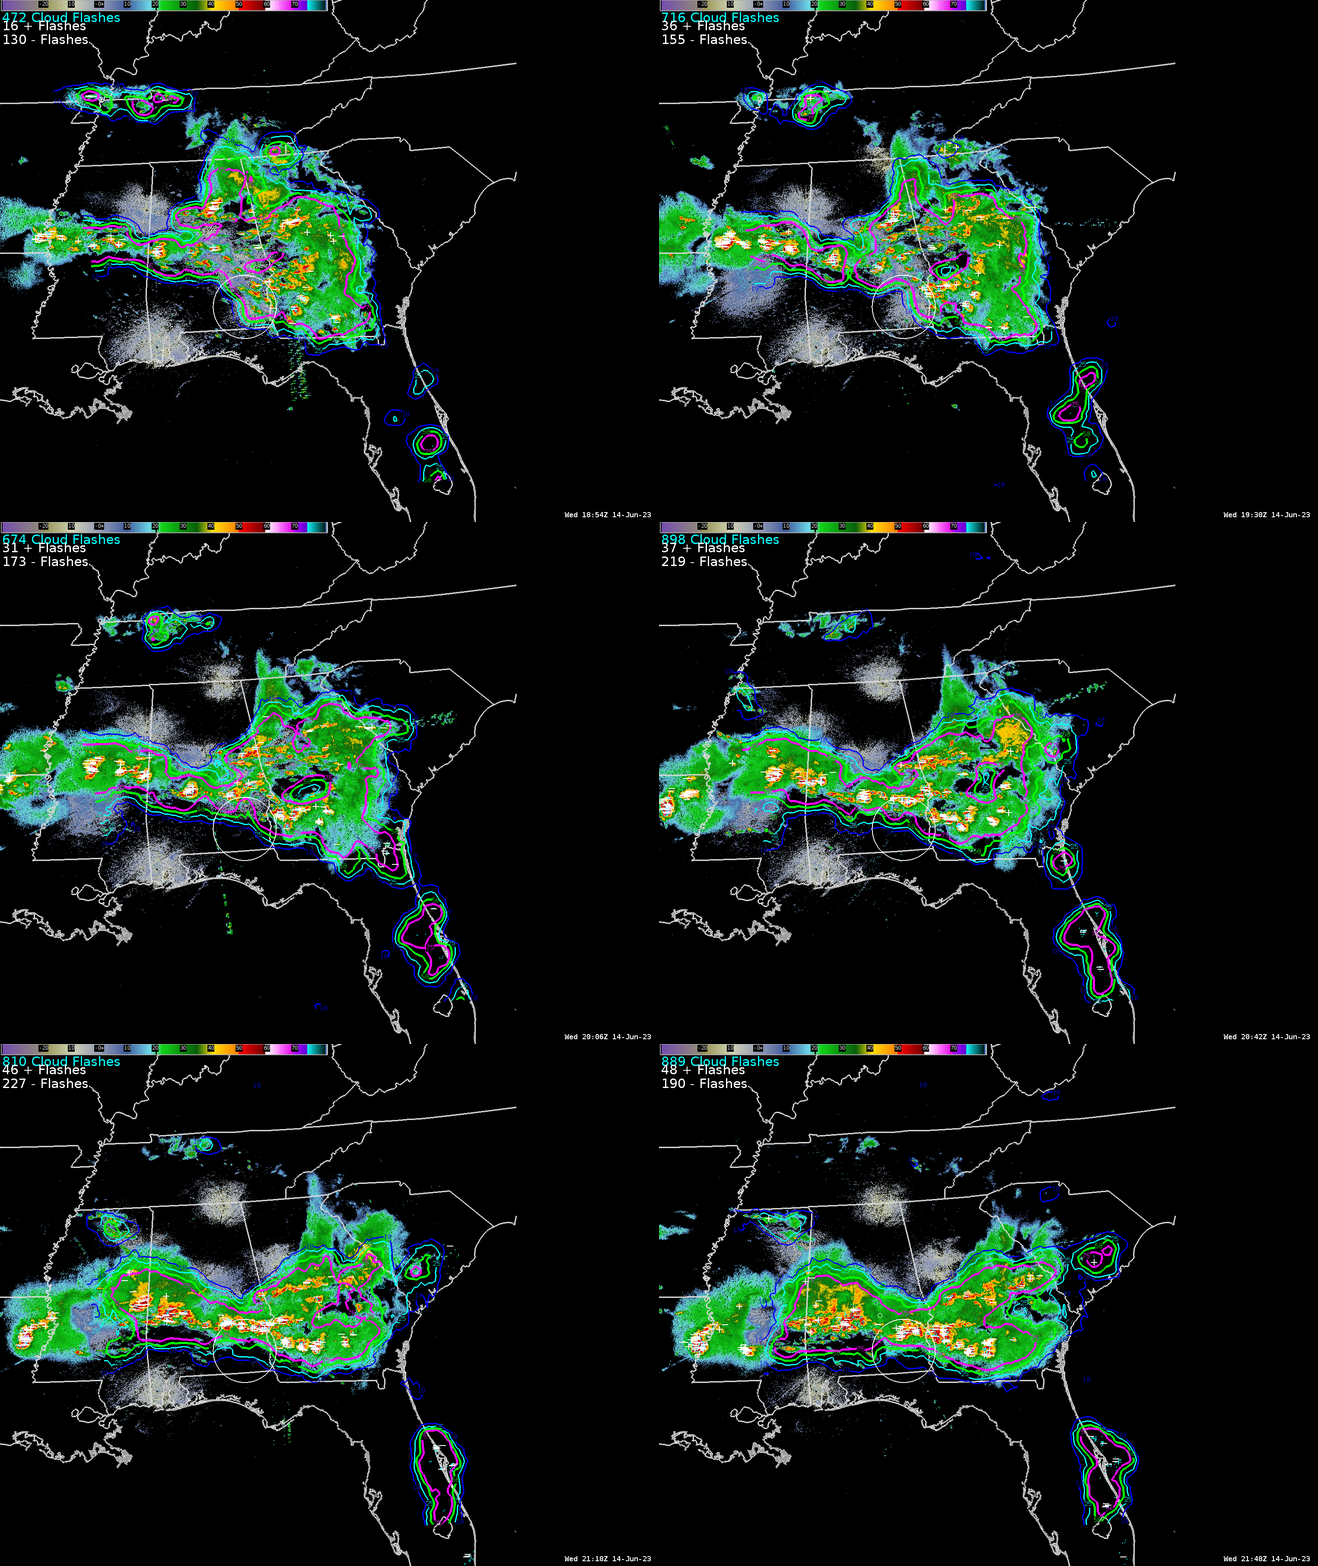
Below is a shot of LtgCast on a radar background and ELN measured lightning, the +/- are positive and negative ground strokes, and the cyan dots are in-cloud. It is interesting how the 75% probs lead out into southwestern Georgia though the showers there are more stratified and lightning isn’t expected, yet it gave about 45 minute notice of lightning strikes; that’s a good thing. But how useful is this? It predicted a few single lightning strikes tens of miles apart scattered across 100 miles which isn’t really useful; would you stop all outdoor activities across ¼ of Georgia for a few stray strikes? Would you clear the baseball field because a lightning strike will hit in the next hour somewhere within 50 miles? Not likely, but knowing there is some chance is valuable information for an event coordinator for risk analysis. If they can make minor changes to activities with little or no impacts, it helps, especially if it’s an area where lightning isn’t expected. What would be a big plus would be an estimate of flash density/frequency expected to go with the probs. That gets back to tracking the convective cells to predict areas of dense lightning. We have radar and ELN’s for that.

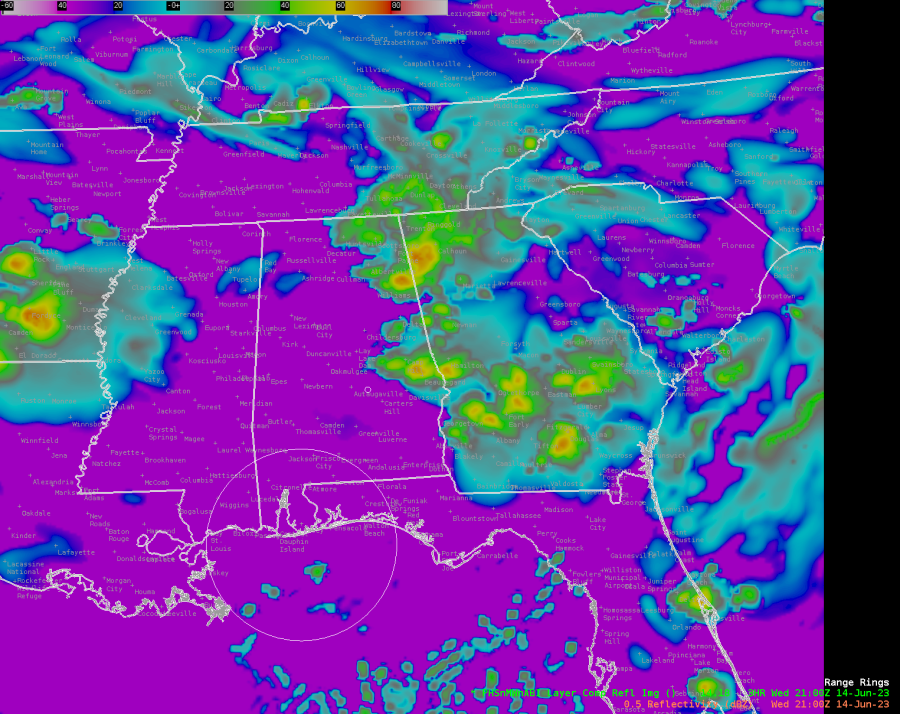
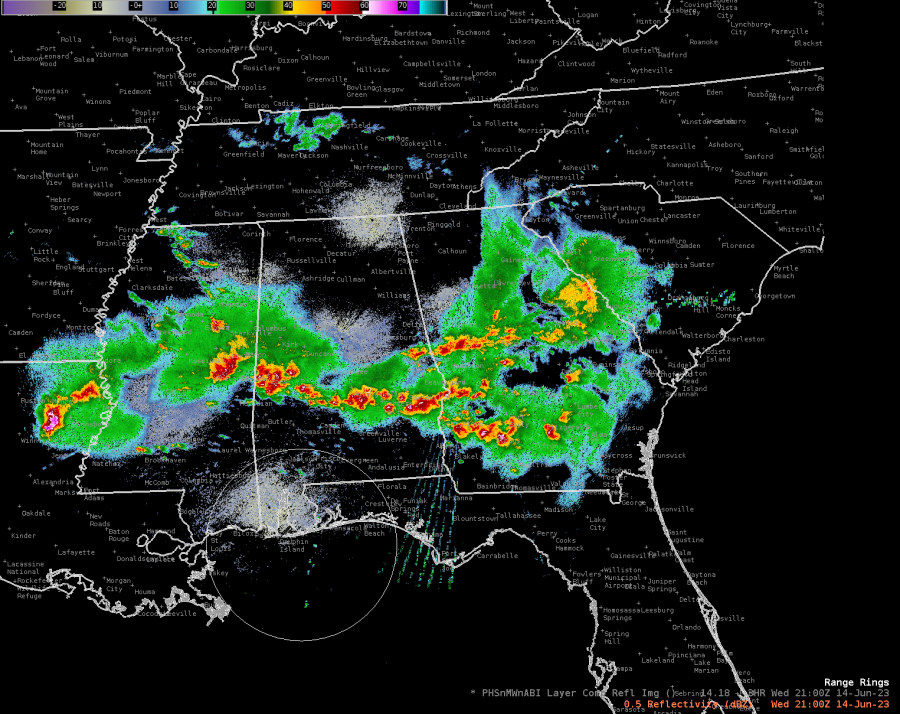
PHS composite reflectivity vs radar at 21Z… I find little value in the PHS composite reflectivity product. Below you see PHS composite reflectivity compared to the radar returns at 21Z. It’s not doing too well and I haven’t seen a time when it has done well predicting where the storms will be. The HRRR, NSSL WARF, HRef, NAM Nest and other high res models do much better.

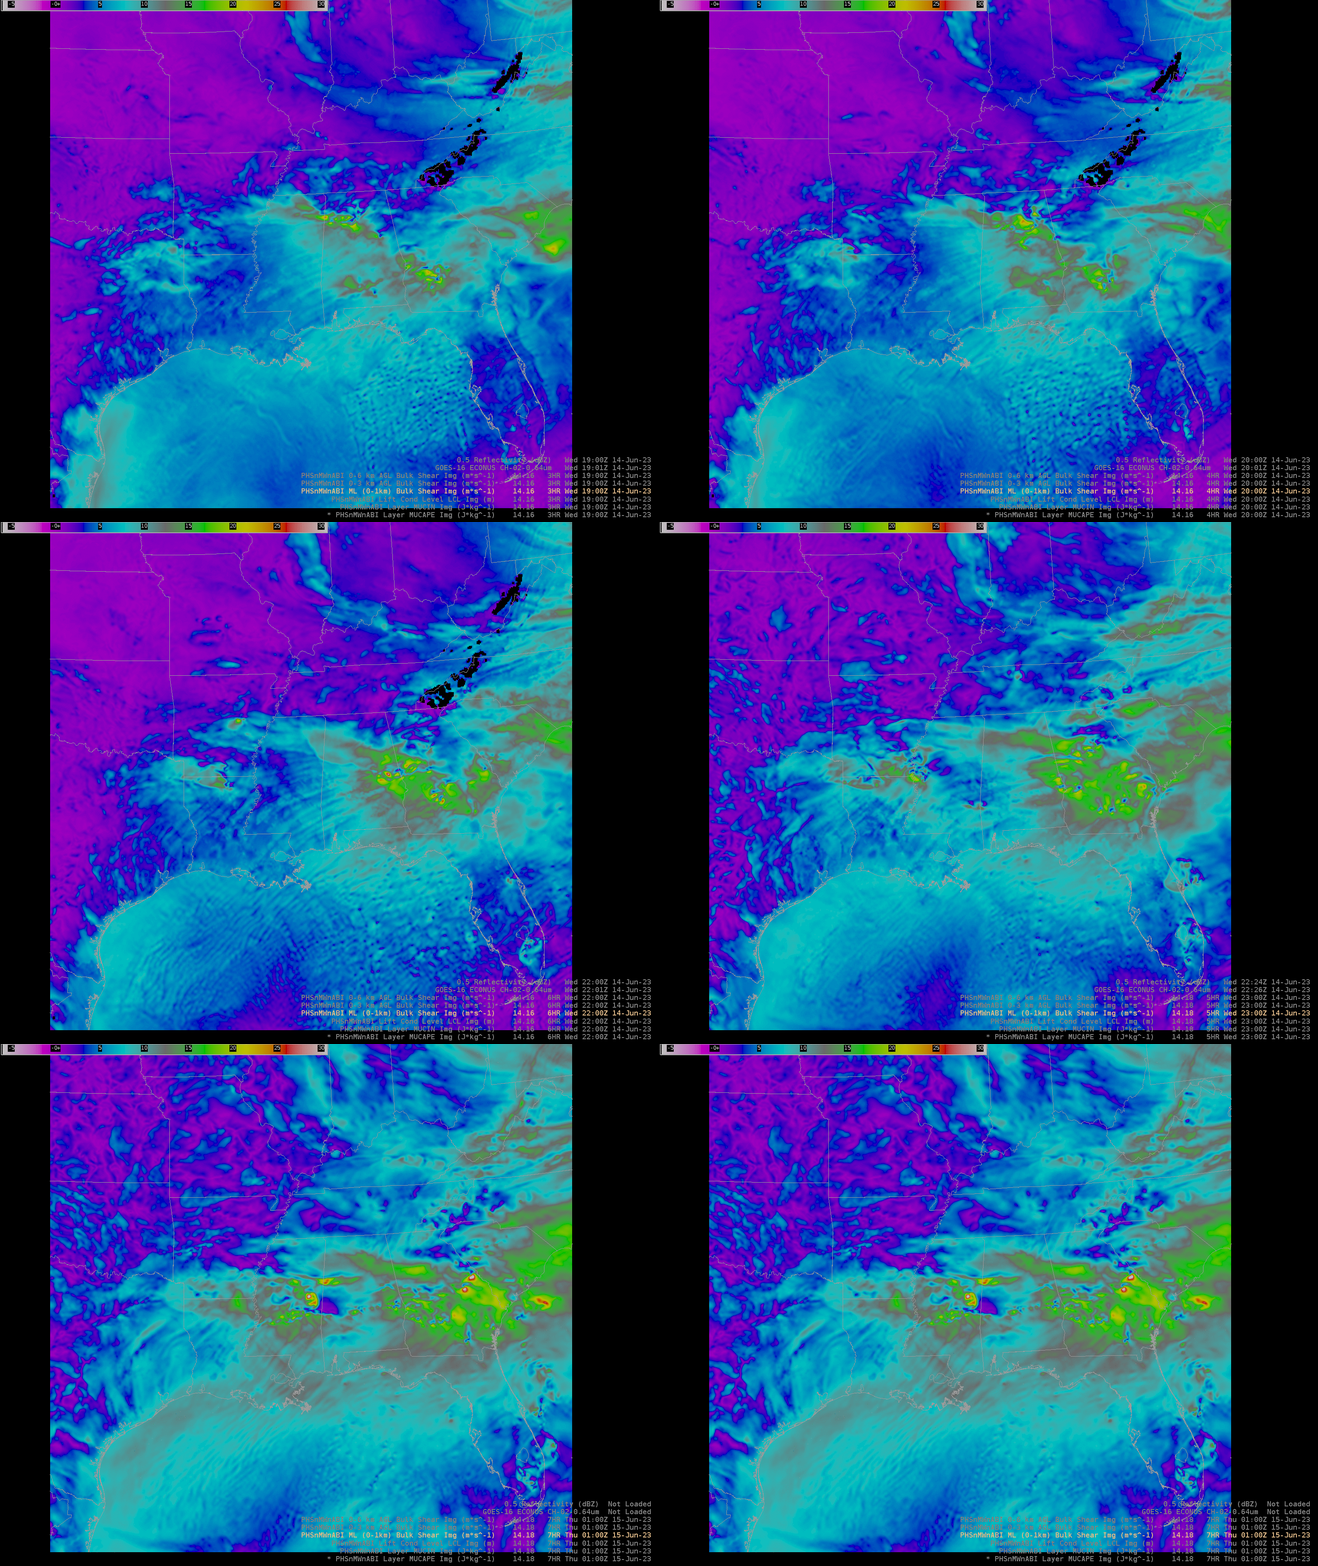
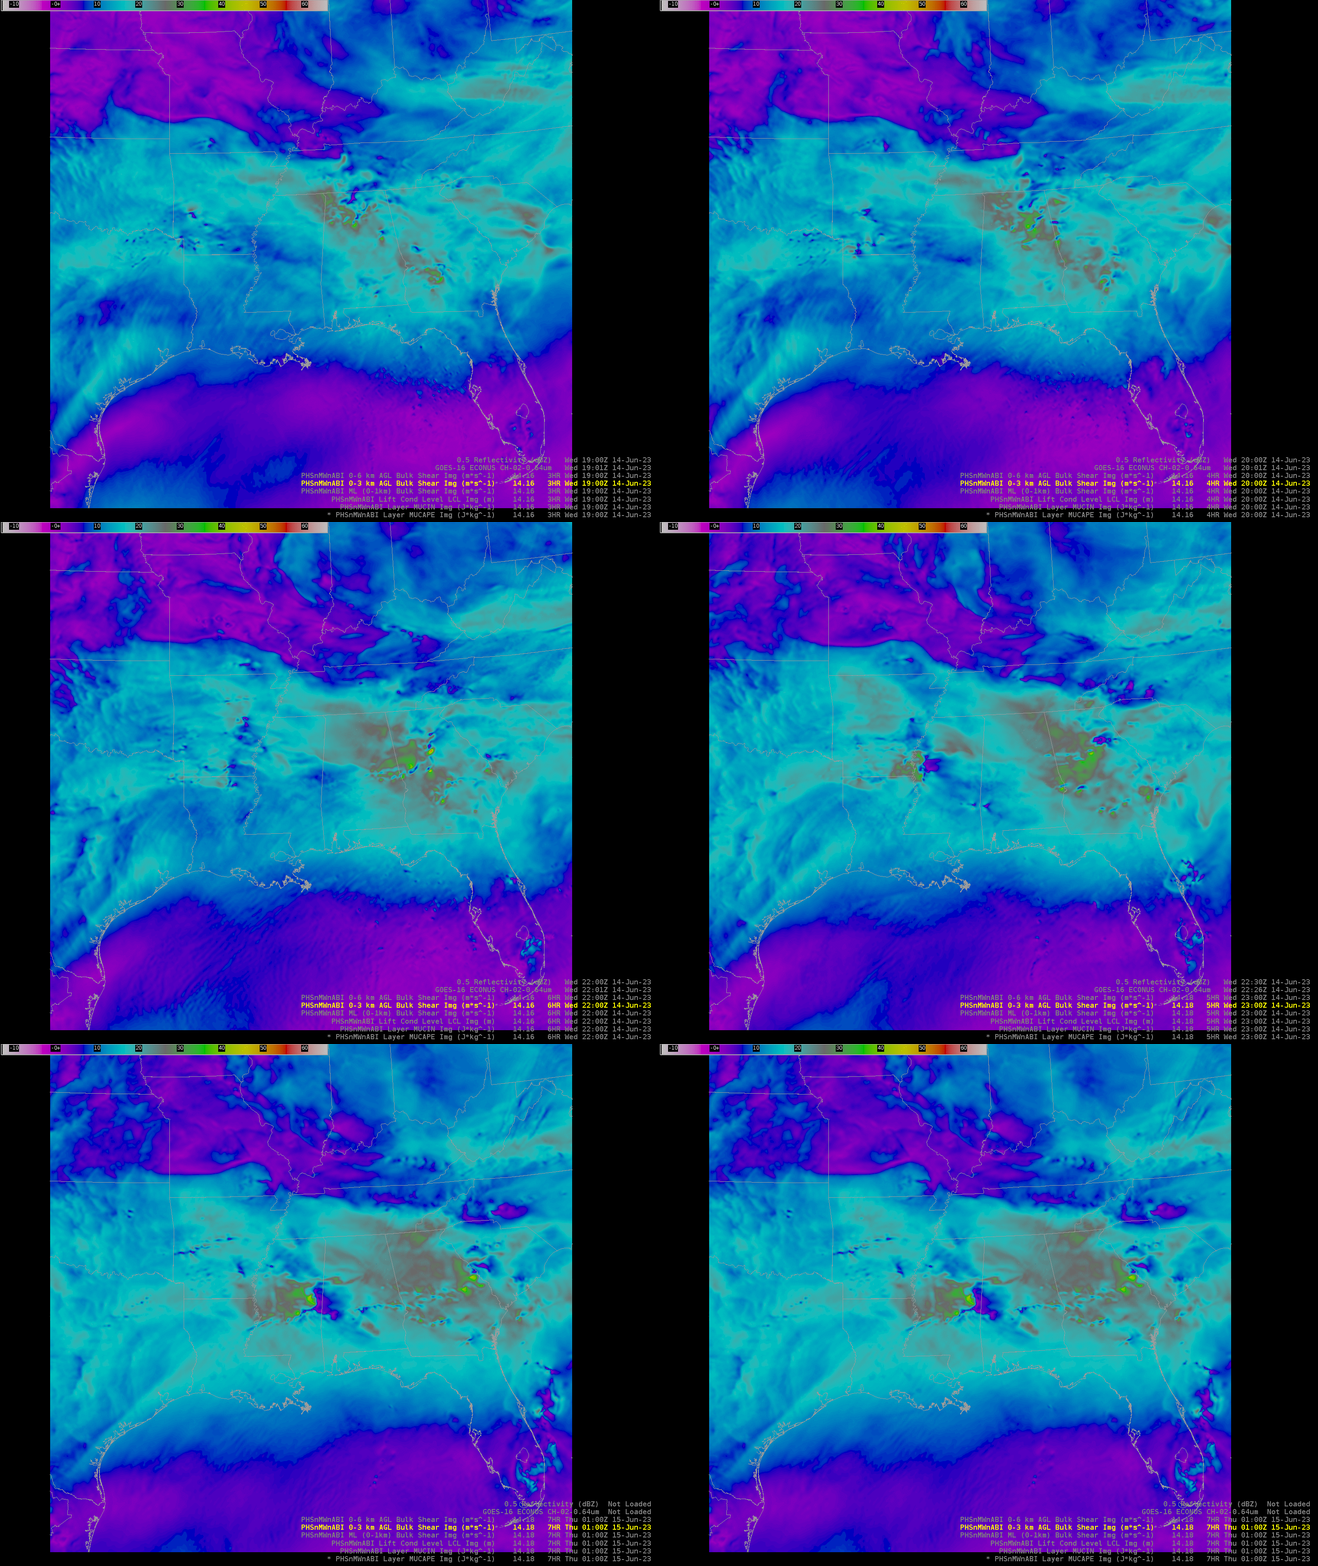
PHS Bulk Shear 0-1 km below on the left and 0-3 km below on the right both show a line between areas of lower and higher shear along the boundary where the severe storms were tracking, but this occurred after the convection started. I don’t see a pre convection signal pointing to where the training storms formed.

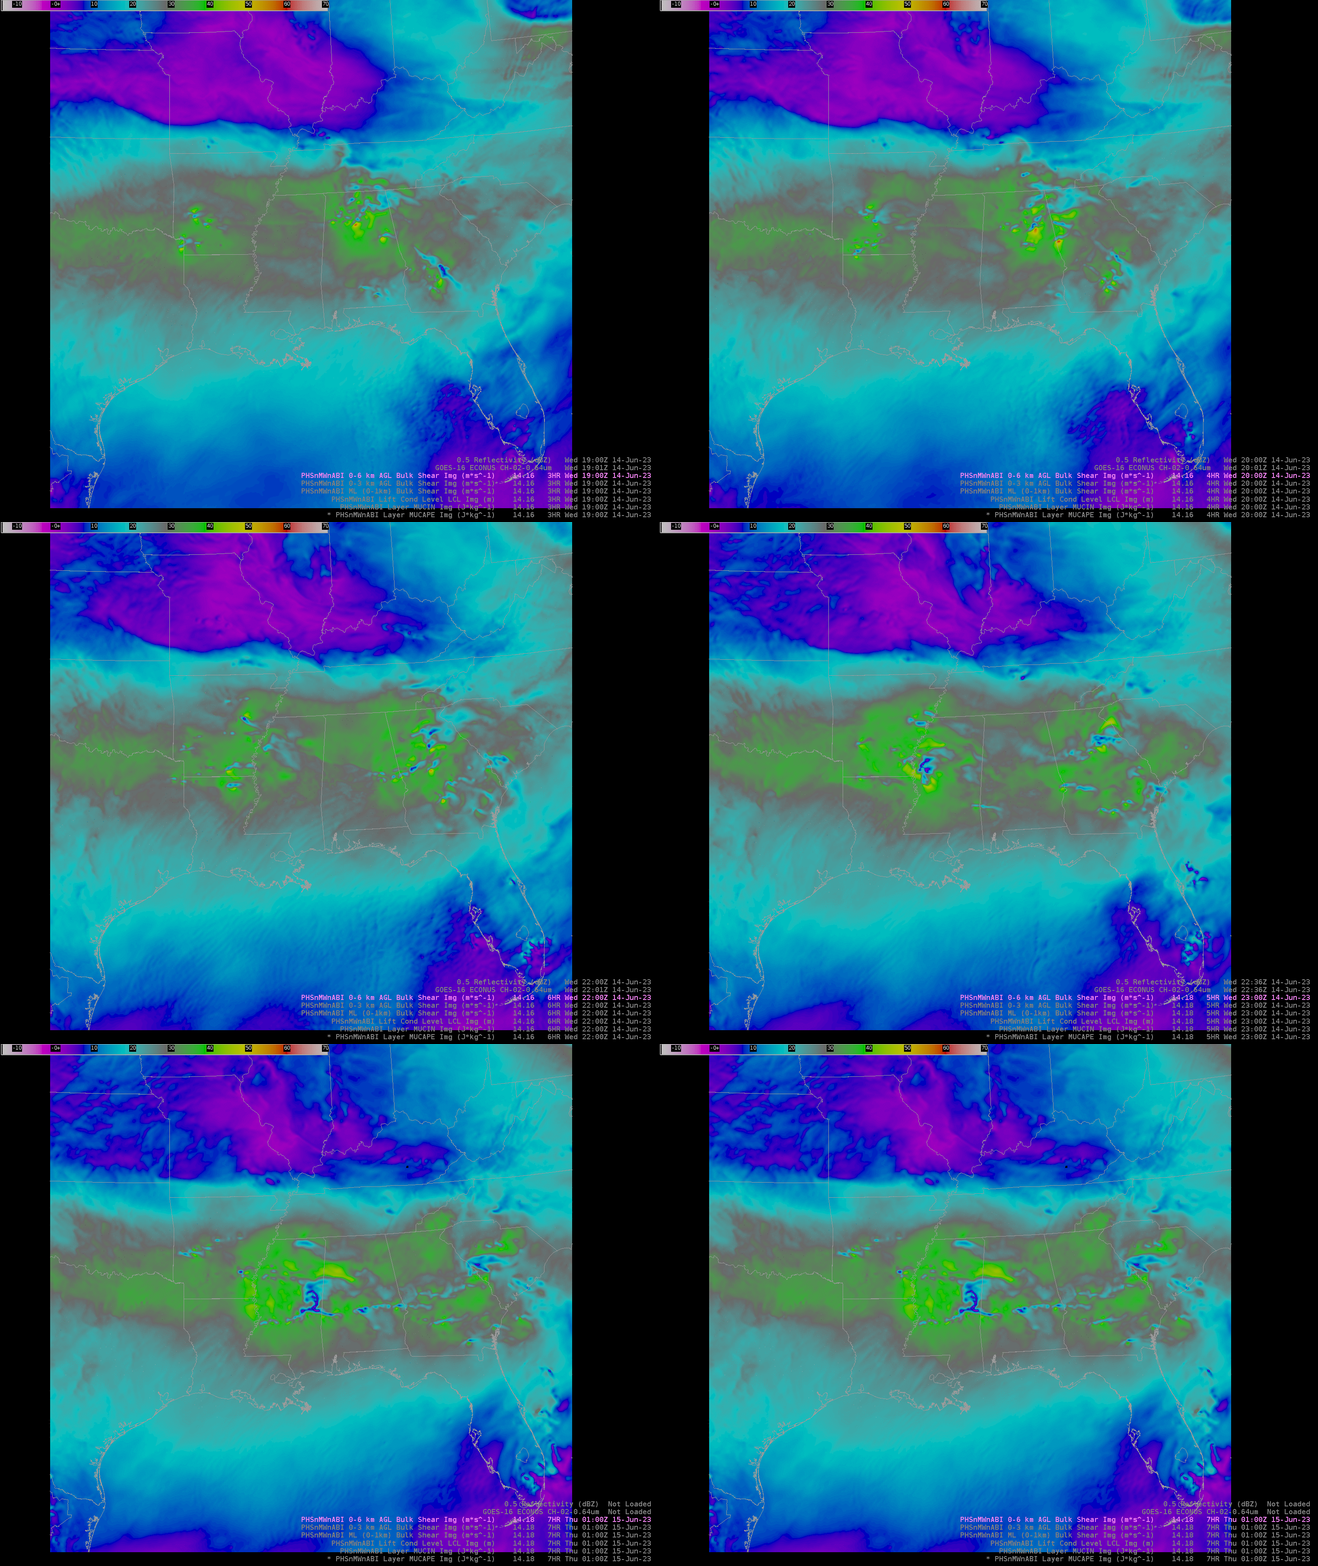
The Bulk Shear 0-6 km below shows more promise with the 19Z  frame showing a boundary where the training severe storms formed/tracked (what did it look like at 16Z or 17Z?). I would need to see more of this pre convection to really make a judgment, and would need to see positive validation/verification to have any confidence in it as a tool.

- Super Bolt

Tuesday, June 13, 2023

Day 2 Review of Products & Operational Applications

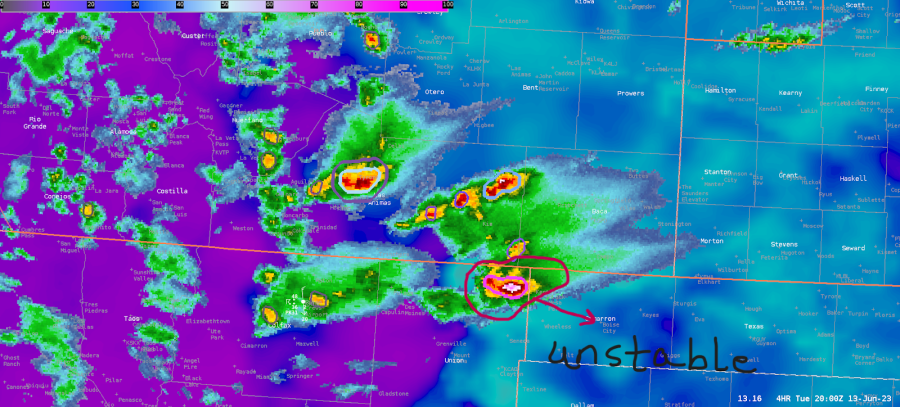
 I took on the DSS role during today’s operational period. There were no afternoon NUCAPS-Forecast runs and the morning runs provided minimal coverage over the AMA CWA. So, I opted for PHS data today (namely SBCAPE) with MRMS 0.5 km Composite Reflectivity and ProbSevere overlaid (Figure 1) to diagnose the environment. Much of AMA was socked in by stratocumulus at the start of the operational period, but severe storms just to the west posed a concern as they tracked eastward into a gradually destabilizing environment.

Figure 1

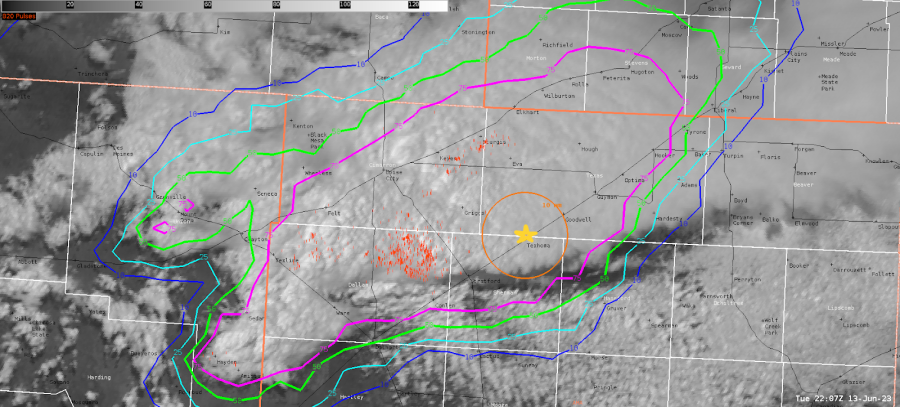
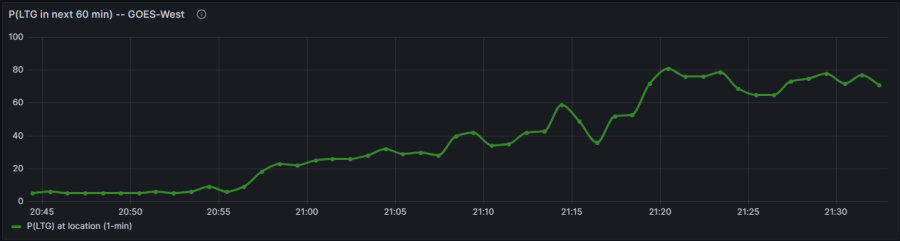
The assigned DSS event was a hypothetical RC plane show at Texoma Municipal Airport (denoted by a yellow star in Figure 2). I was instructed to alert the hypothetical POC for the event when either of the following hazards were expected within 20 minutes: winds or gusts of 15 kts at the airport OR lightning within 10 miles. I used LightningCast probability contours along with ENI 5-minute pulse lightning plots (reddish orange tick marks) to monitor the proximity of lightning to the event range ring (Figure 2). I issued a DSS update with “lightning likely” wording after the LightningCast meteogram depicted a steadily increasing likelihood of lightning at the airport within an hour (Figure 3).

Figure 2

Figure 3

A LightningCast observation: the footprint of the 75% probability contour was much larger than the actual area in which lightning strikes occurred (at least according to ENI 5-minute pulse lightning) mainly in the anvil region. That said, GLM Flash Extent Density did indicate low-value pixels in the anvil region, so perhaps I missed some anvil lightning strikes by looking at just ENI 5-minute pulse lightning.

- Vort Max  

PHS Blog Post AMA 6/13

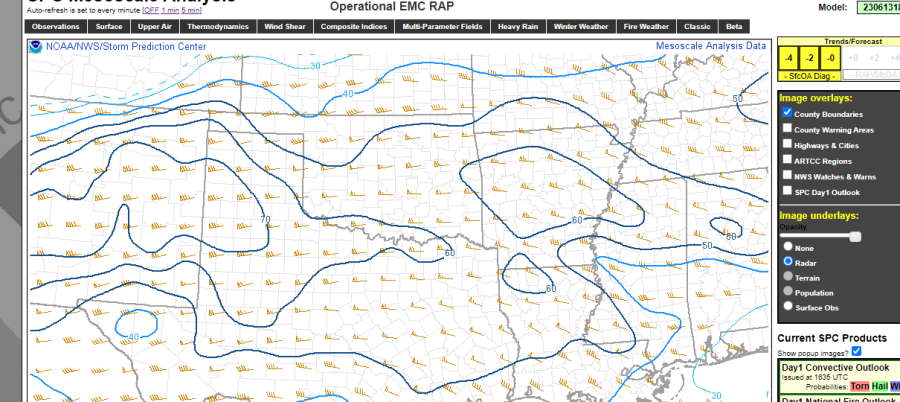
 PHS today was interesting given some of the local convective parameters. The main one that caught my attention was the lesser 0-6km bulk shear that it was giving just ahead of an incoming storm in the Oklahoma Panhandle. The PHS was around 20-30 knots whereas other guidance and SPC Mesoanalysis was showing 50+ knots. I did look at other parameters such as MUCAPE and SBCAPE for example and they were in the ballpark of other guidance including SPC Mesoanalysis.  If the PHS was correct then the storm mode would feature more multicell with some organization vs more of a discrete supercell mode so it was going to be interesting to see what would occur. 

What wound up occurring was a persistent long track supercell along with other convection which was anticipated given the PHS wind shear.  Overall, I was impressed with the PHS wind shear forecast as that tailored away any thinking that there may be additional supercells as additional updrafts would interfere with the intensification of other cells. The PHS however was around 1-2 hours slow with convection moving into the AMA CWA, however the composite reflectivity forecast did show more of a cluster of storms developing. The PHS was also showing a corridor of stronger 0-3 and 0-1 SRH which in reality the intense cell did move through and actually wound up producing a few tornadoes. The ProbTor was also showing tornado potential as high as 40% as it was moving through this corridor.  Overall, I was impressed with the PHS today and think that it could create good DSS messaging opportunities along with being skillful in Mesoanalysis.

PHS showing the lesser values of 0-6 bulk shear in contoured form

SPC Mesoanalysis depicting the 0-6km bulk shear at the same time

How the radar wound up turning out at 2130Z with the multiple cells

- Tor Nader  

Thursday, June 8, 2023

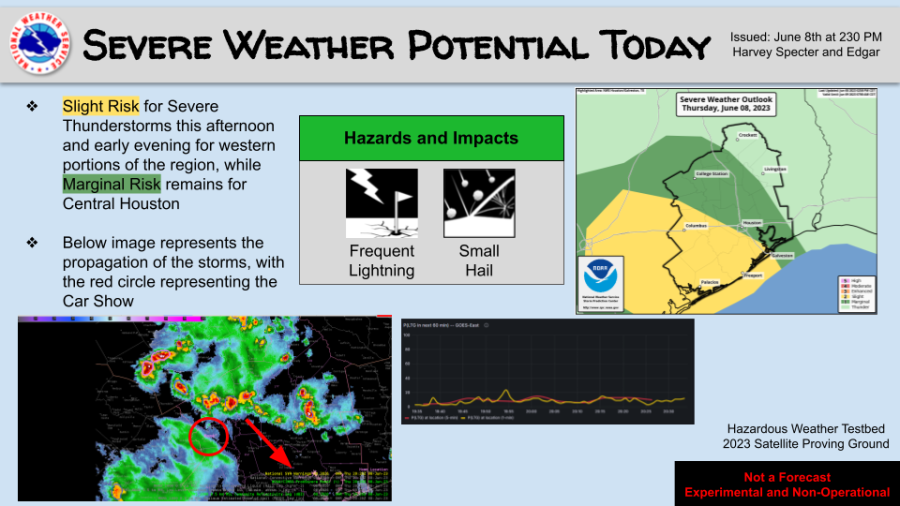
HGX Convection impacting the Car and Truck Show in Burton, TX

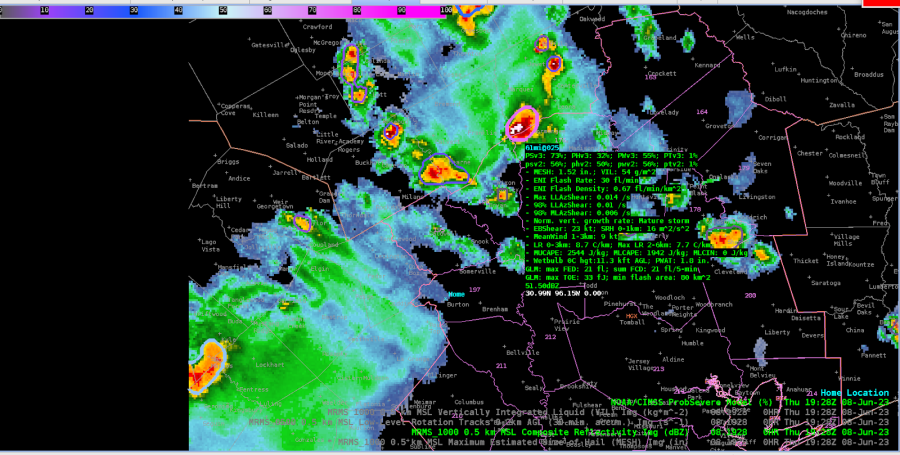
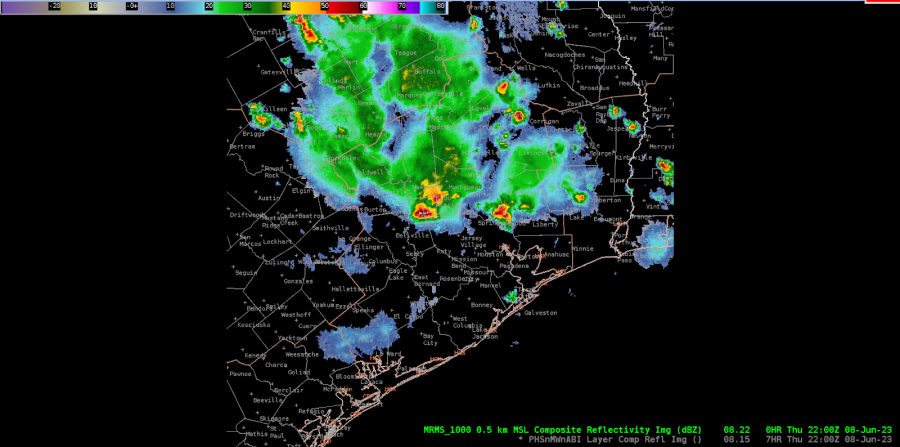
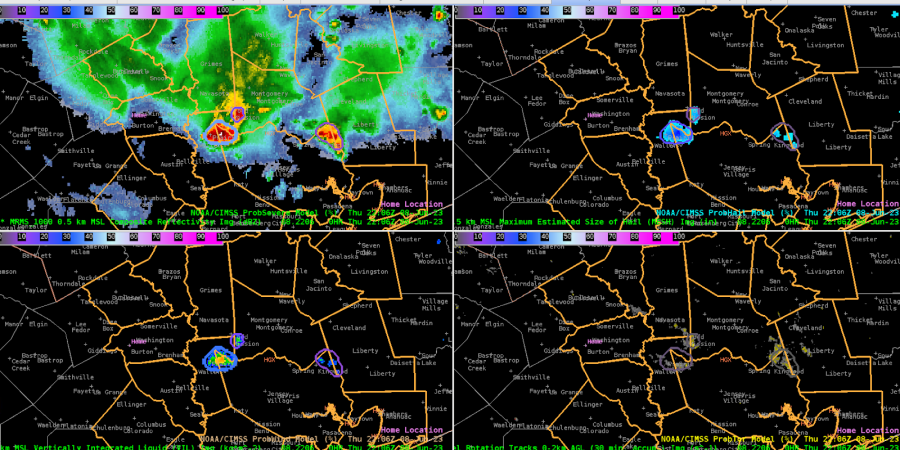
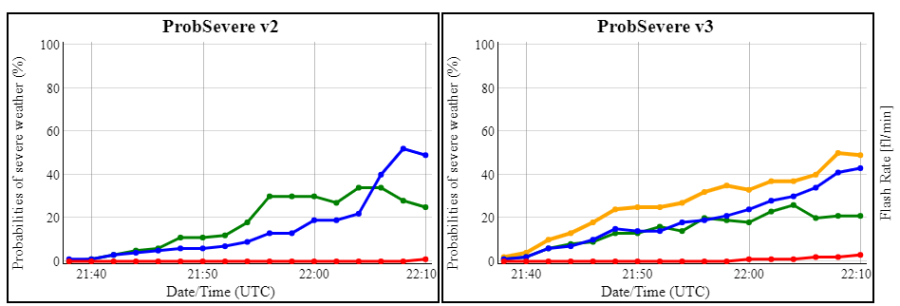
 Initial setup for the HGX vicinity showed several cells to the north and east of the DSS site, propagating southeastward. The strongest cell, pictured below, had a PSv3 of 73%, while PSv2 remained as 56%.

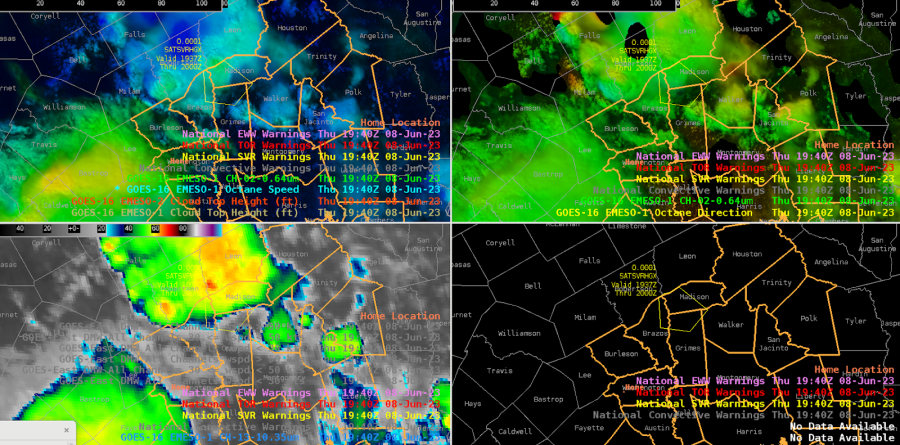
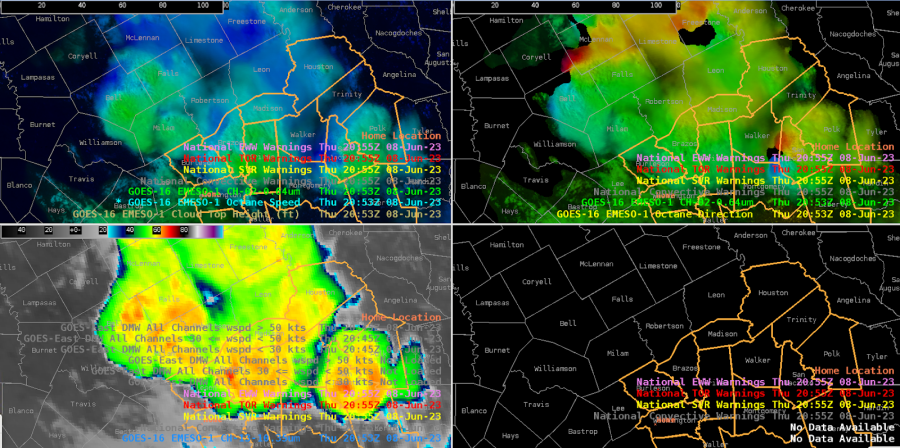
We issued a warning for a northern cell moving into the CWA into Madison county, based on a -70C cloud top brightness temp and PSv3 total prob over 70% (had been climbing from the 50s fairly steadily). But the cloud top shear noted by Octane was not strong (~20-25 kts), so the warning was very borderline. Just a couple scans later, it lost most of its texture on the vis imagery and lost its shear in the Octane direction product. Cloud tops warmed a bit as well.

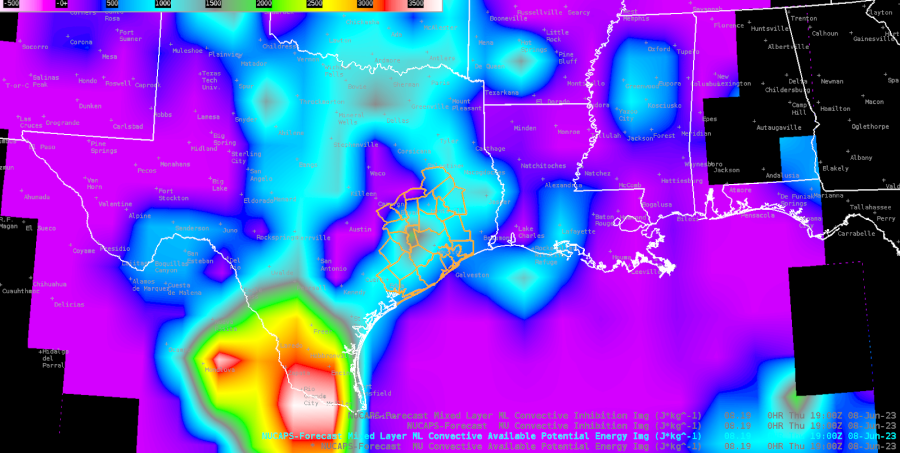
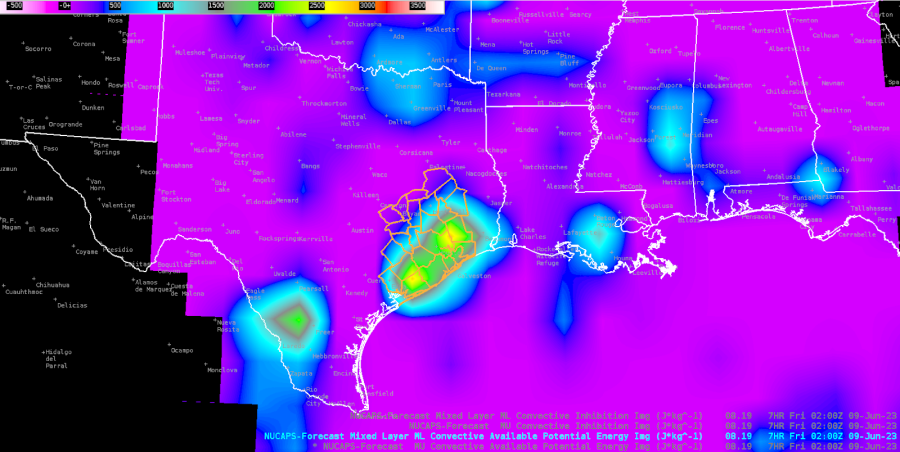
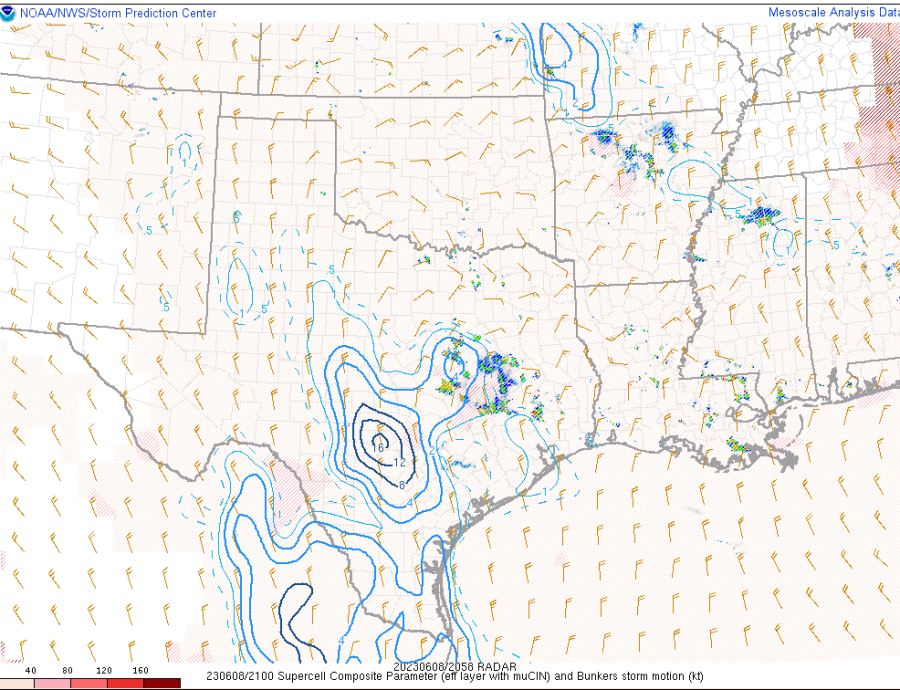
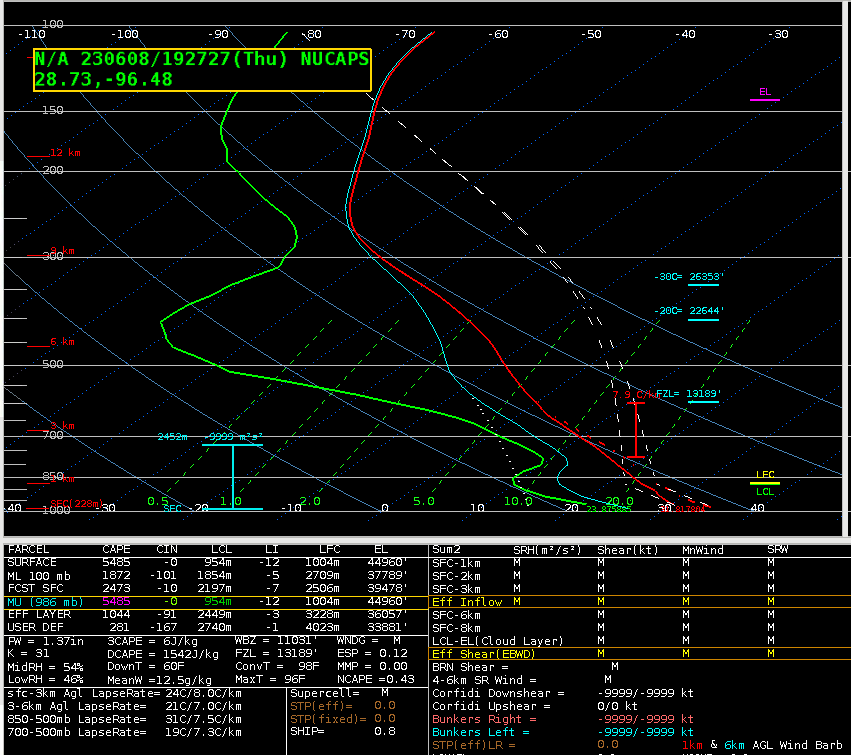
00H NUCAPS-Forecast (NF) is showing moderate CAPE now (1st image below), which may help explain the messy sub-severe multicell clusters, but the forecast valid at 02z this evening shows a resurgence in the CWA (2nd image below).

Looking to our NW, one of the stronger cells is outside our CWA, but the Octane direction is showing good cloud top diffluence.

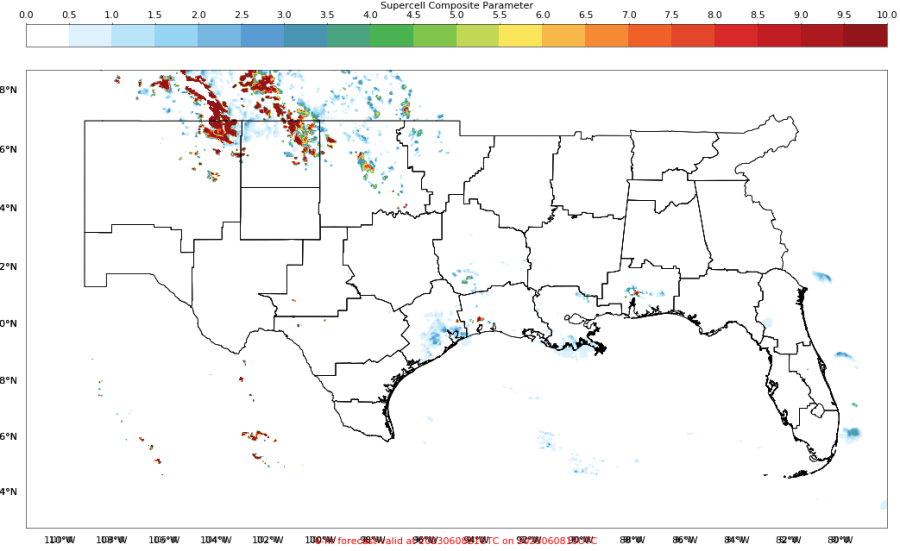
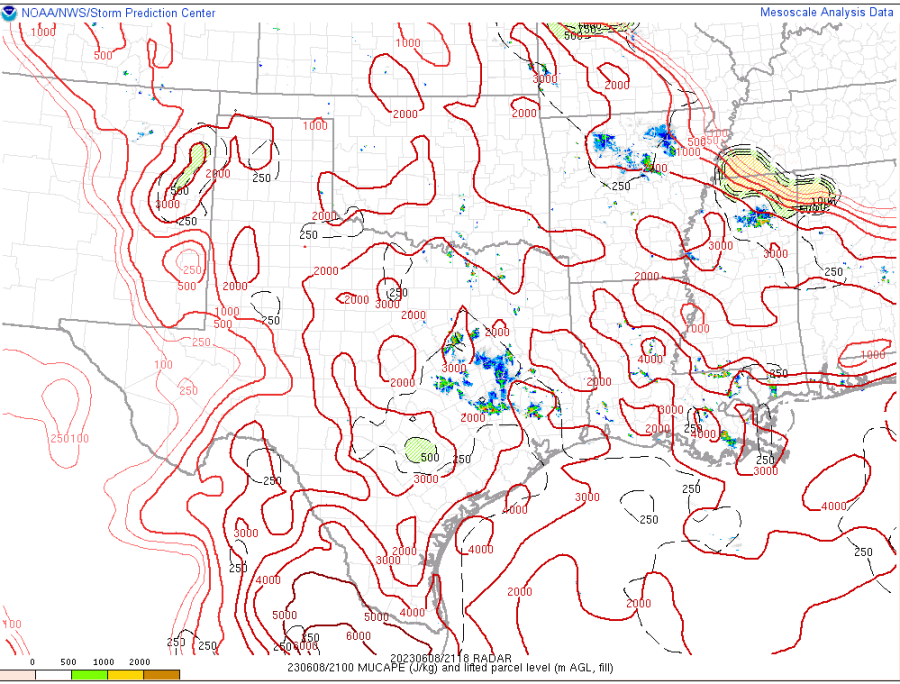
The PHS SCP forecast valid at 20z looks to be around 2-4 over our area, although this doesn’t match well with the SPC meso page SCP, which focuses high values W of our CWA.

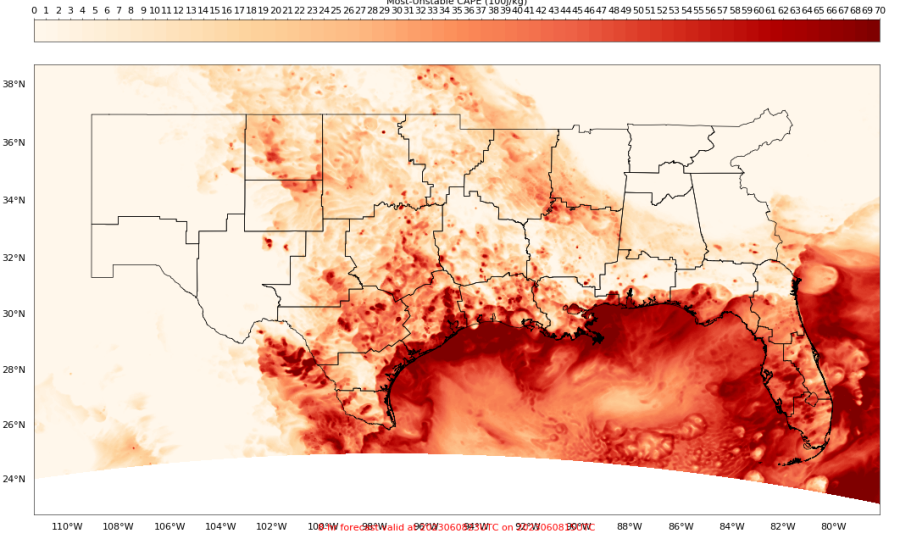
The 21z PHS MUCAPE (15z run) looks like it has insane values of 6000-7000 J/kg near the coast and just offshore. This is much higher than the SPC meso page, showing 3000-4000 J/kg at most.

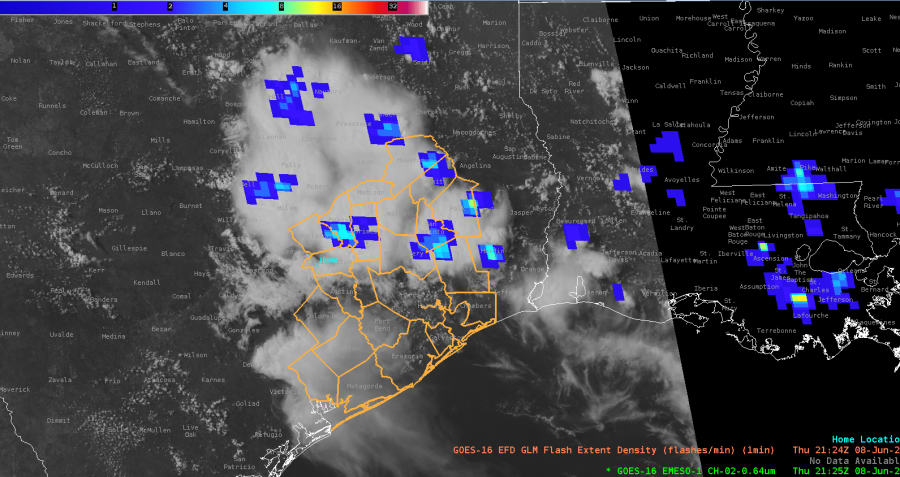
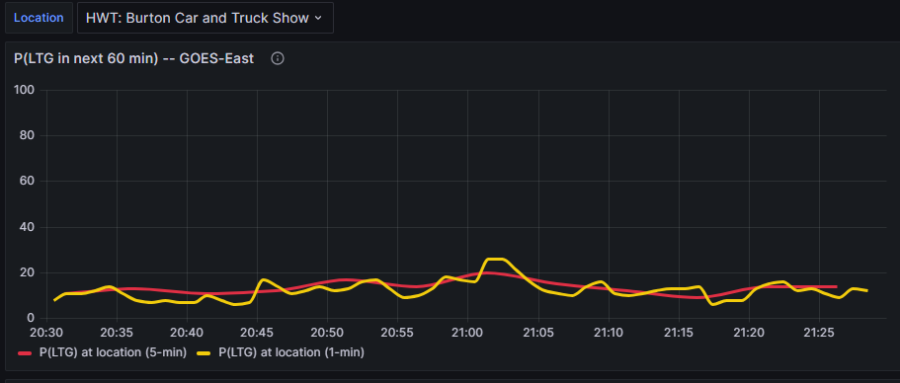
Looking at the optimal application of LightningCast, it seems that the point-based meteogram would work best for CI and in situ developing convection, versus storms propagating into the area. In our case here, at the DSS site, the point-based LC probs are low, suggesting little concern. But we can see from the GLM FED data that there are mature cells with lightning just to the NE that will probably move near the site in the next hour, which certainly poses a safety concern.

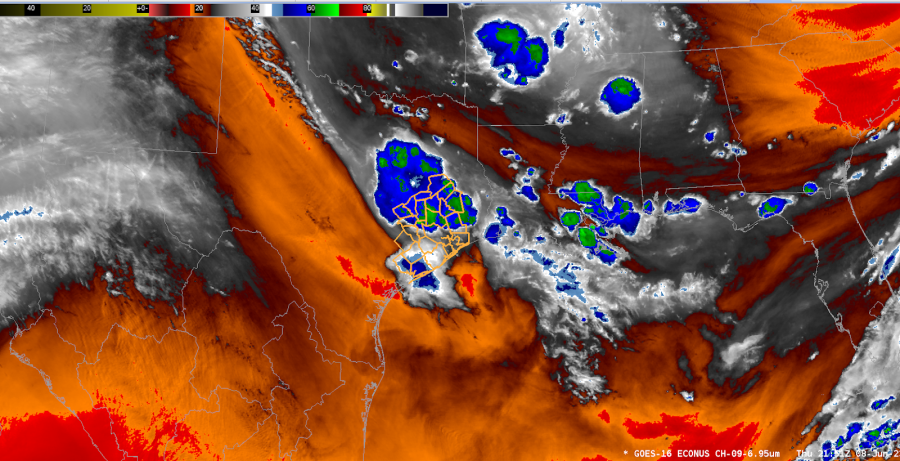
The NUCAPS sounding near Victoria (far SW CWA) showed a lot of CAPE and DCAPE, but a rather dry profile. This is confirmed by WV imagery over much of far S TX.

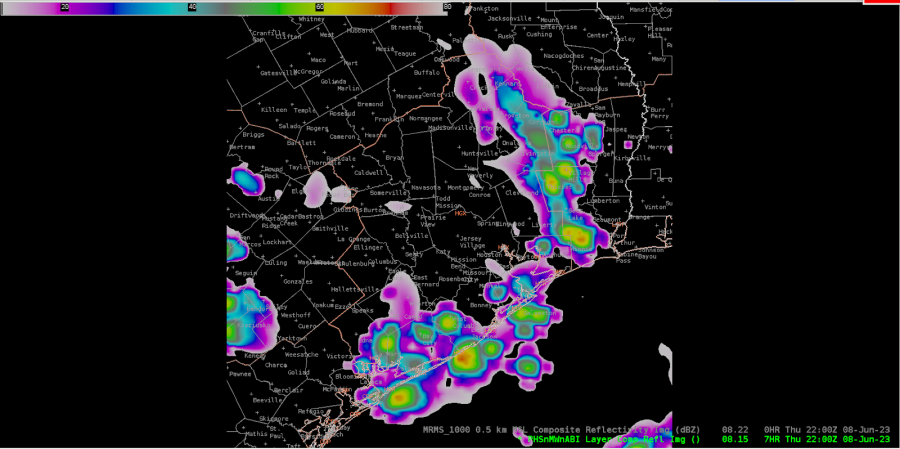
22z PHS Composite Reflectivity (above image) compared to 22z MRMS Composite Reflectivity (below image ) depicting PHS struggling on timing as the cluster of thunderstorms propagate from northwest to southeast.

Late in the event, this cell is showing slow strengthening on PS -- currently both v3 and v2 have 40% total.

- Edgar and Harvey Specter