Showing posts with label PHS. Show all posts

Thursday, June 6, 2024

Storm-Scale Environmental Analysis of Early Convective Development

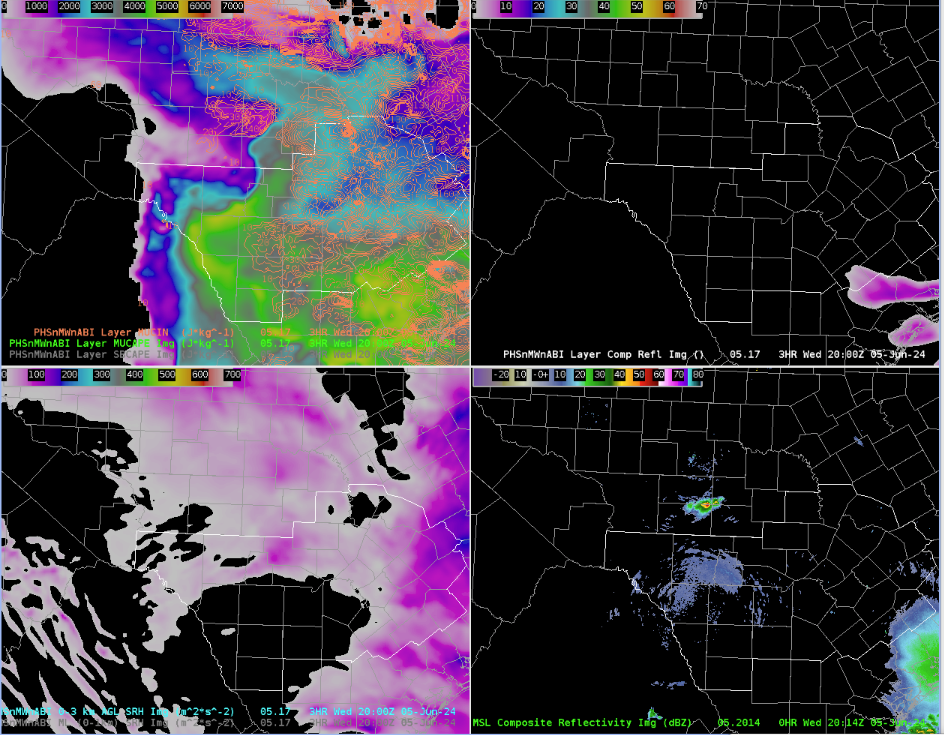
 This case at WFO OUN brought forth a challenging situation monitoring developing severe weather with no available radar data, and only relying on satellite products for storm interrogation and convective warning decisions. This analysis will primarily focus on the evolution of early convective development and how satellite products/PSH data helped gain a better understanding of the environment.

My role in the team monitoring/analyzing the environment was focused on issuing warnings and having the Mesoanalyst(s) relay satellite, PSH and GREMLIN information to support warning decisions. To prepare and gather a greater situational awareness of the environment and what satellite was observing, I loaded in RAP13 Right/Left Bunkers vectors which would aid me in effective polygon design. Given the orientation of the hodograph per observed soundings earlier, storms would support the potential for left/right splitters meaning proper storm motion/polygon flare is very important.
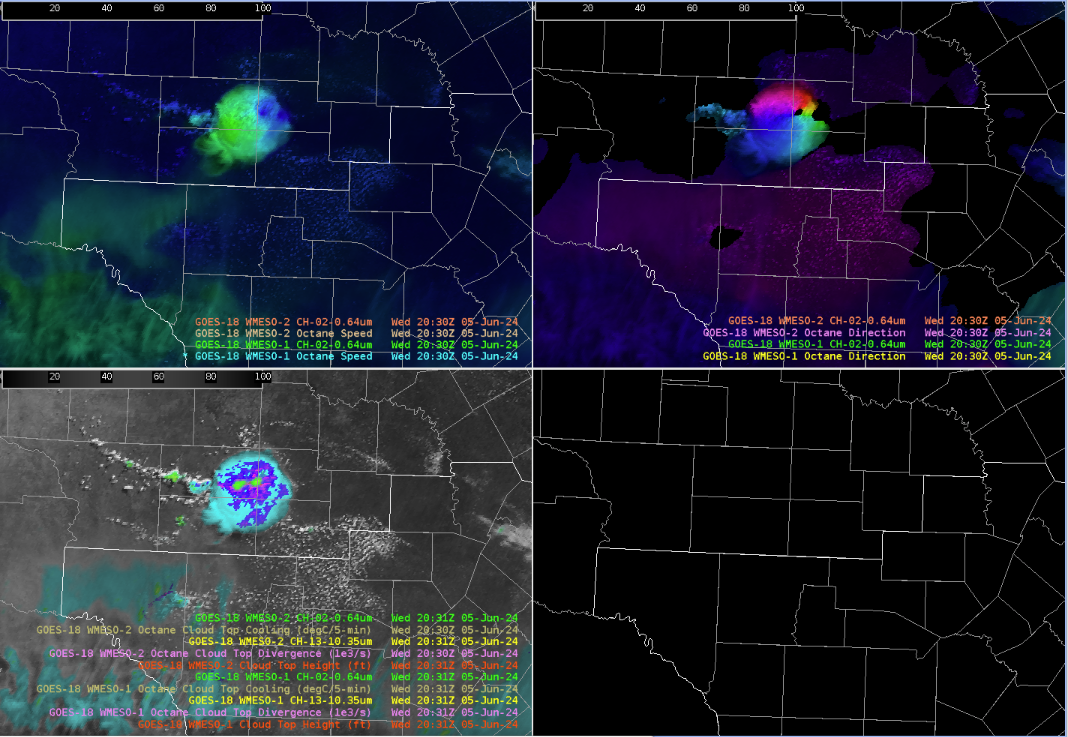
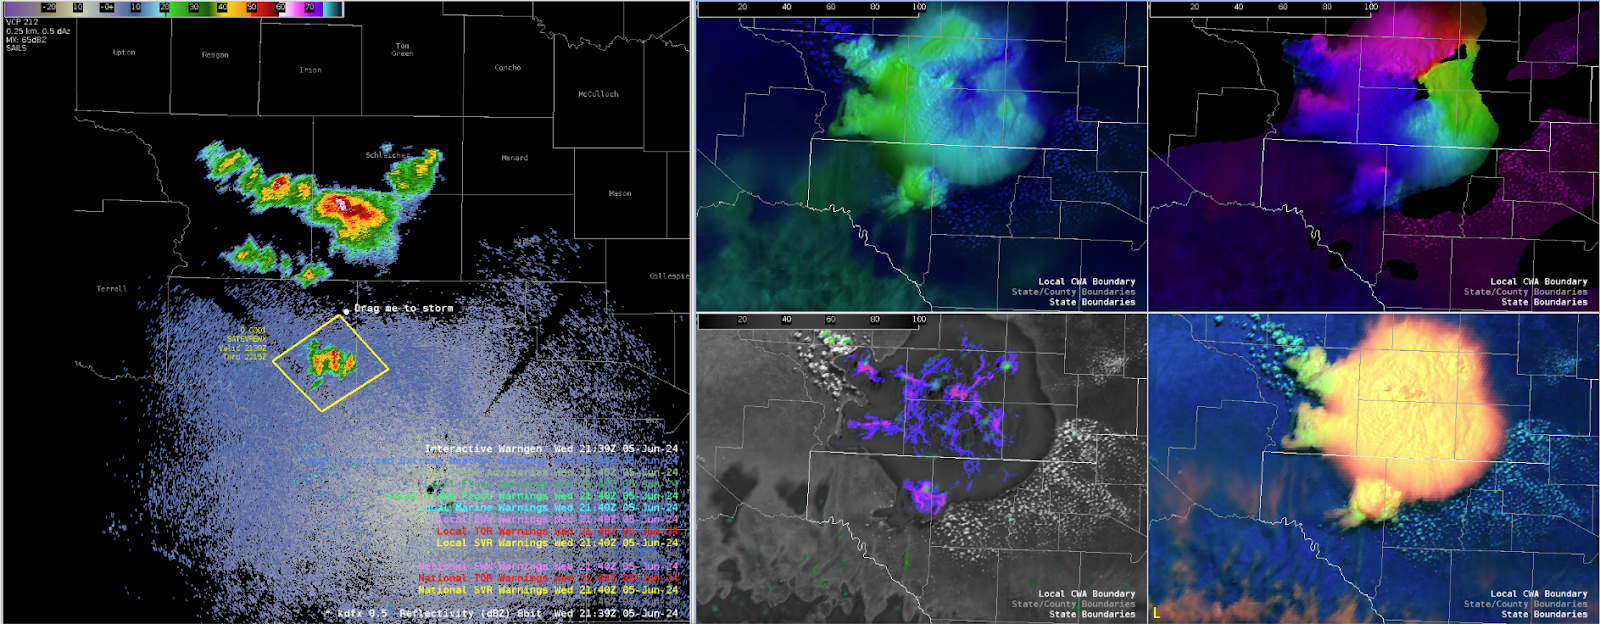
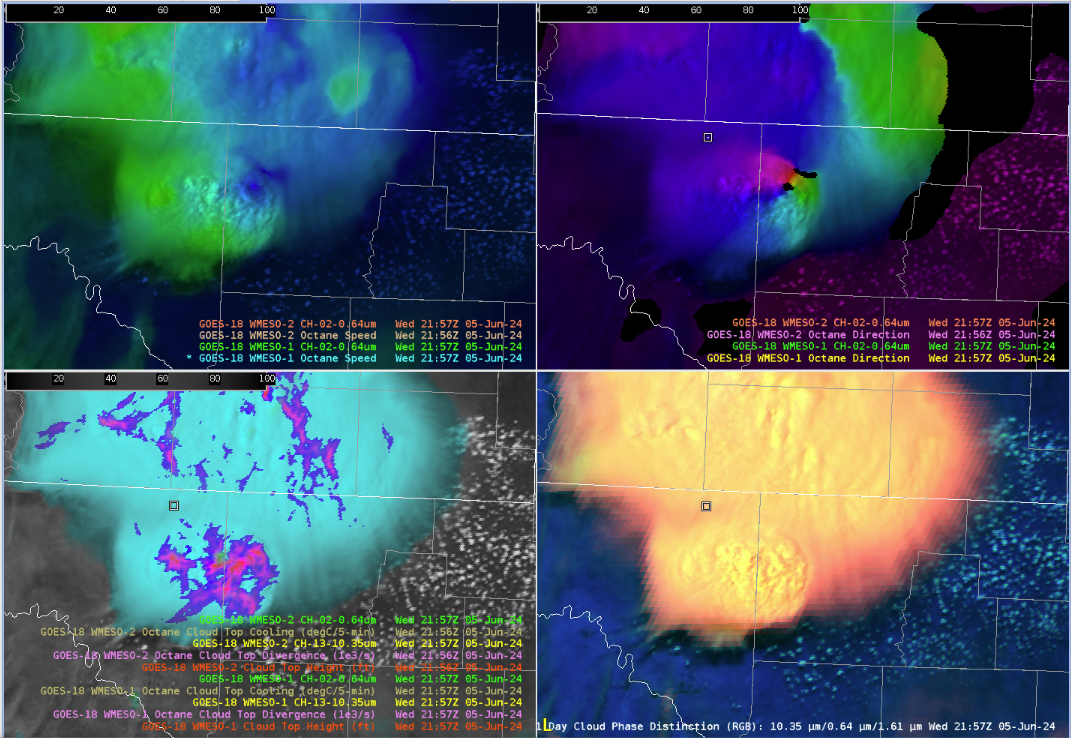
Convective initiation began around 21-22Z with noticeable towering Cu across Cotton County, OK, prompting the first issuance of a SVR at 21:56Z given cooling cloud tops/increasing storm top divergence.

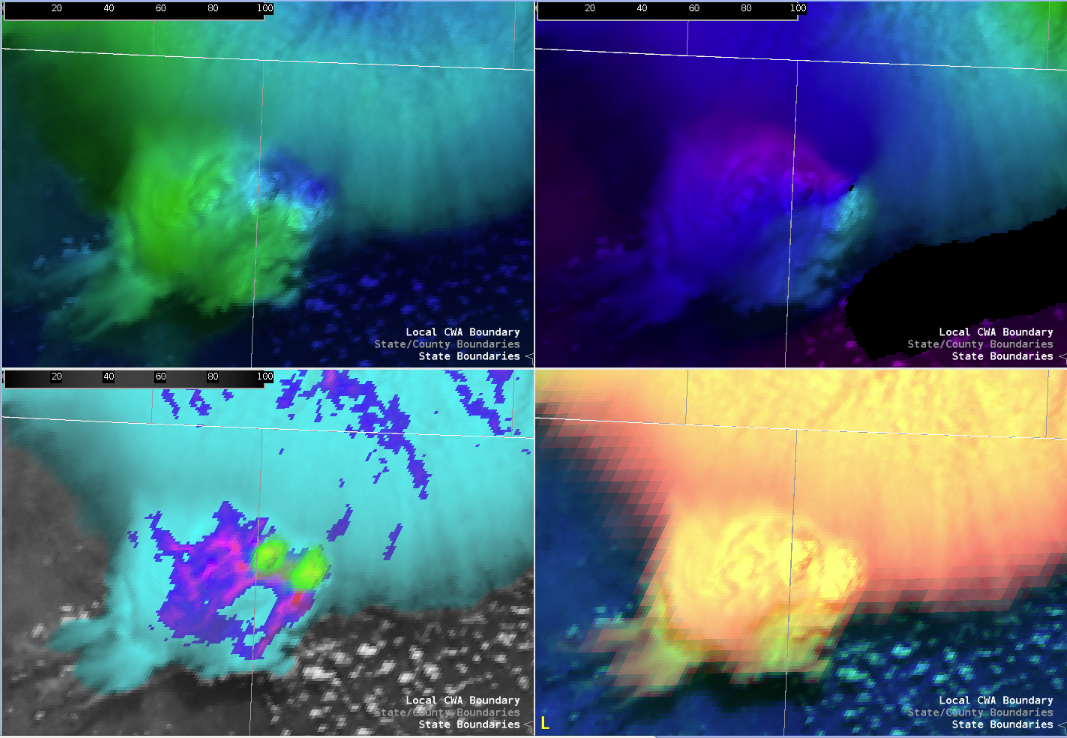
Towards the end of the loop above, observation was made that the overshooting tops were turning more ENE biasing closer to the bunkers right, implying the likelihood of the storm developing a mesocyclone. Not shown here, but a useful trick of enhancing the contrast of the Day Cloud Phase RGB became extremely useful in tracking overshooting top motion and intensity, along with other satellite products diagnosing an intense updraft in progress.

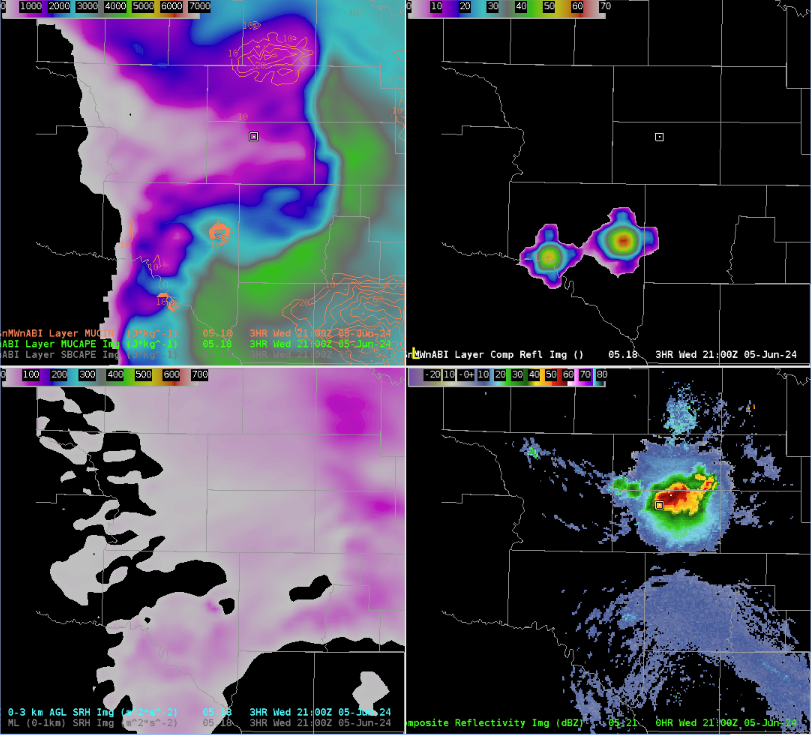
The pre-storm environment was analyzed using PHS data, highlight ample MUCAPE on the order of 3500-4500J/kg around the area of CI,  and large-scale 0-3km SRH ranging around 250-350m2/s2, bringing support for stronger/severe storms to attain rotation in a volatile, highly unstable/moderately sheared environment.
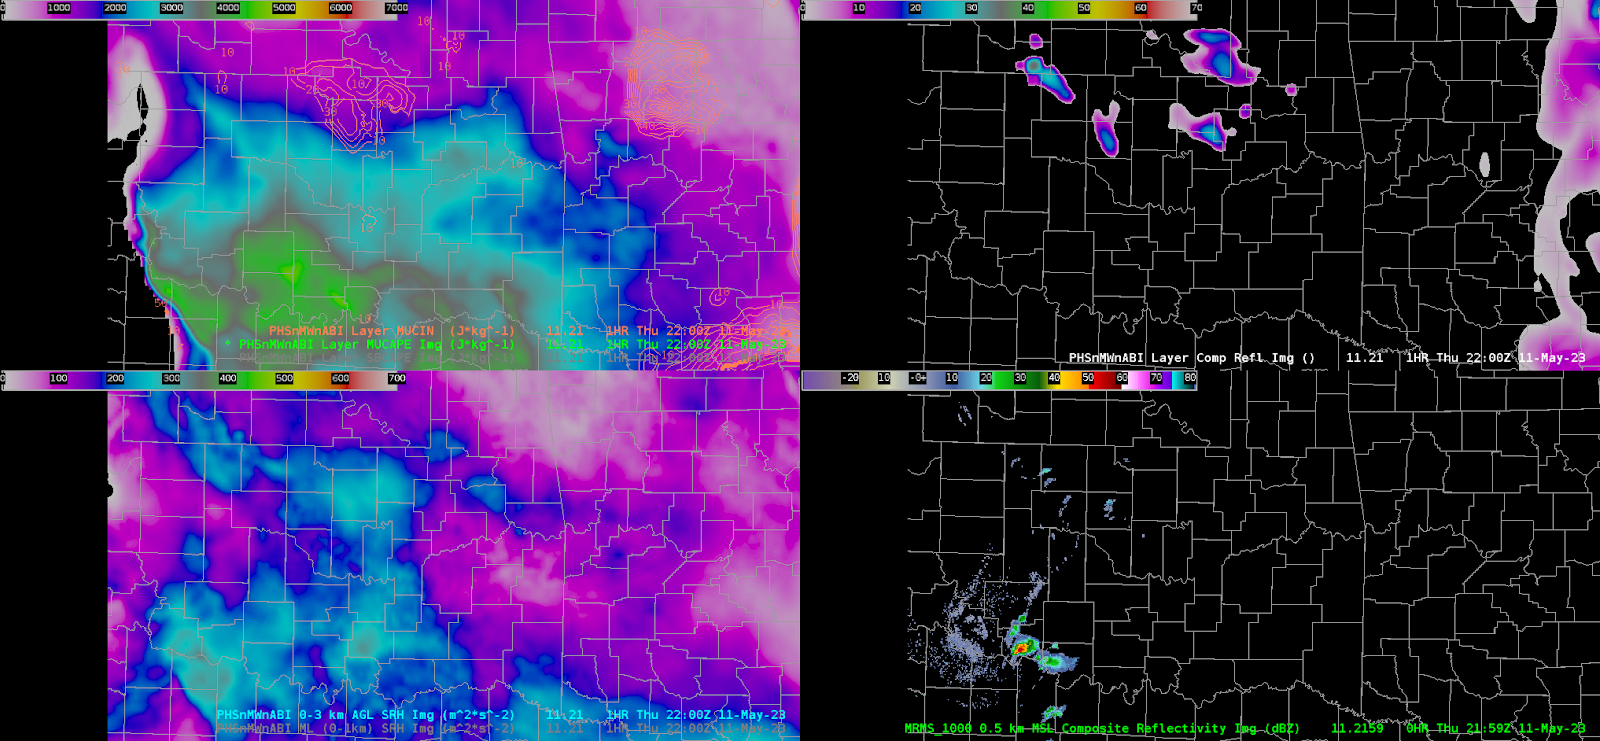
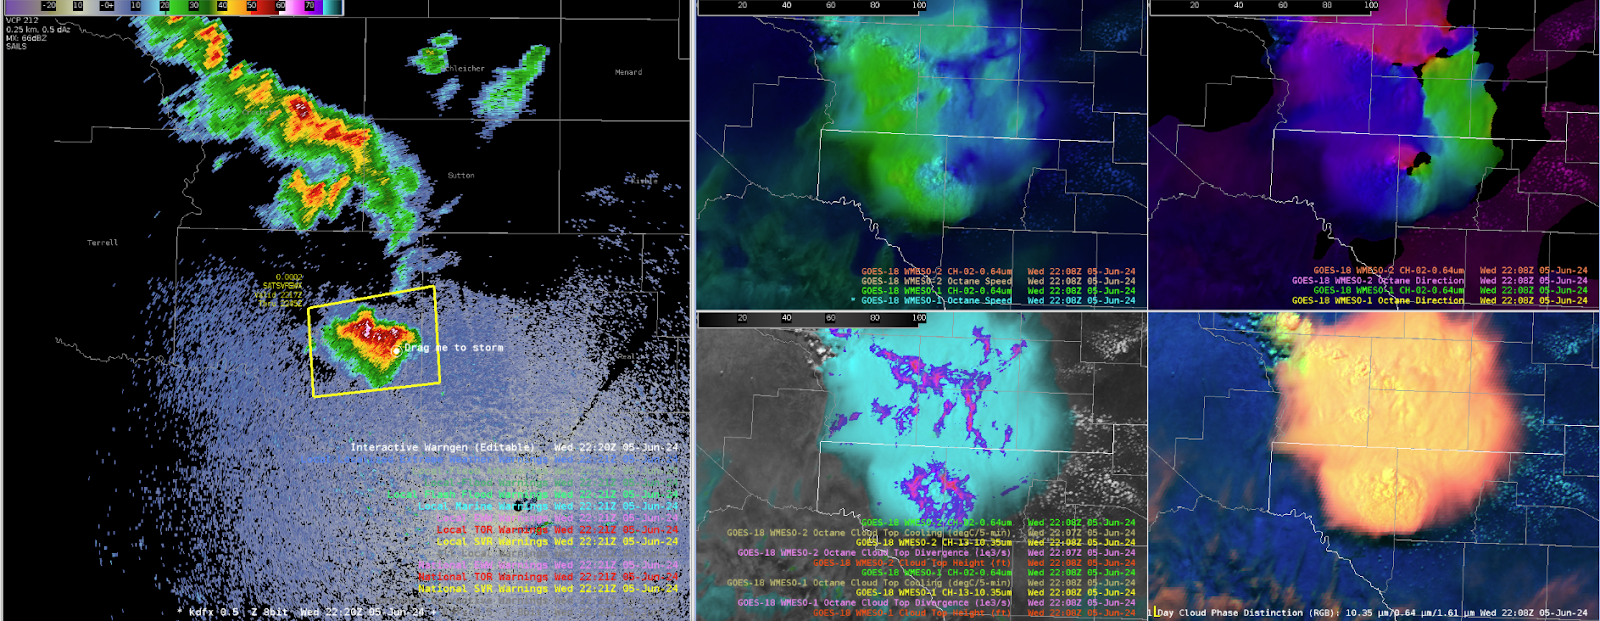
WIth the storm obtaining a developing/intensifying left splitting  updraft (later in the first loop), confidence of a strengthening mid-level mesocyclone increased leading to a transition to a base TOR warning, with polygon design mainly following the bunkers right motion vector to imply near-term motion to continue ENE.
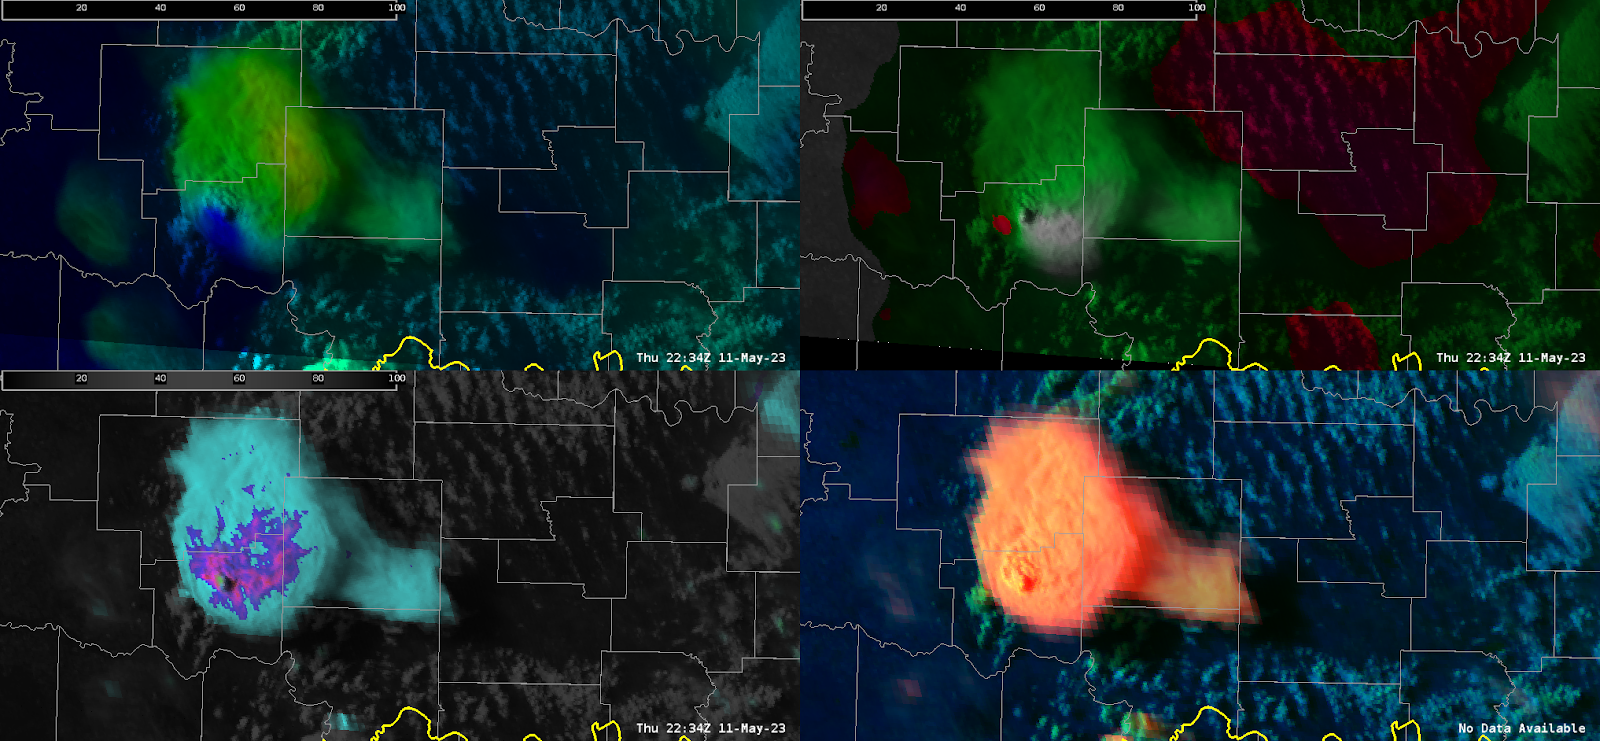
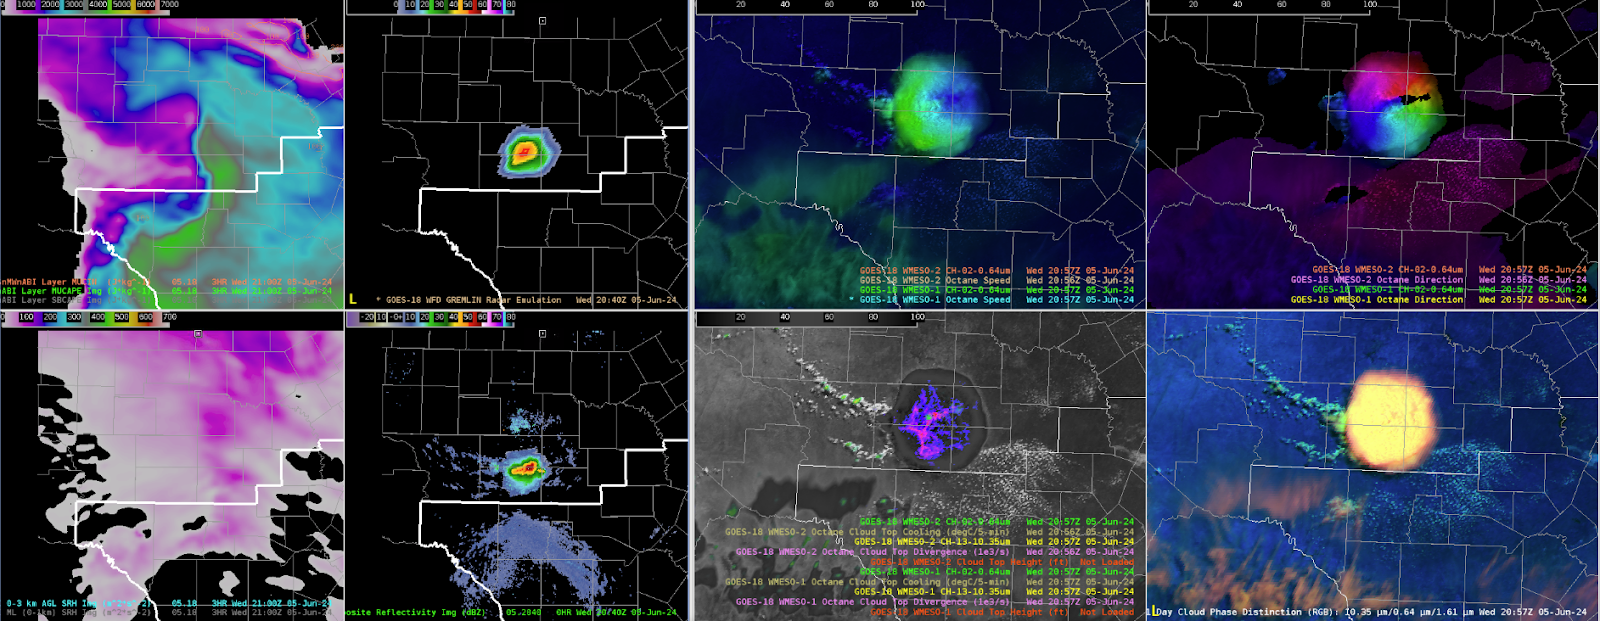
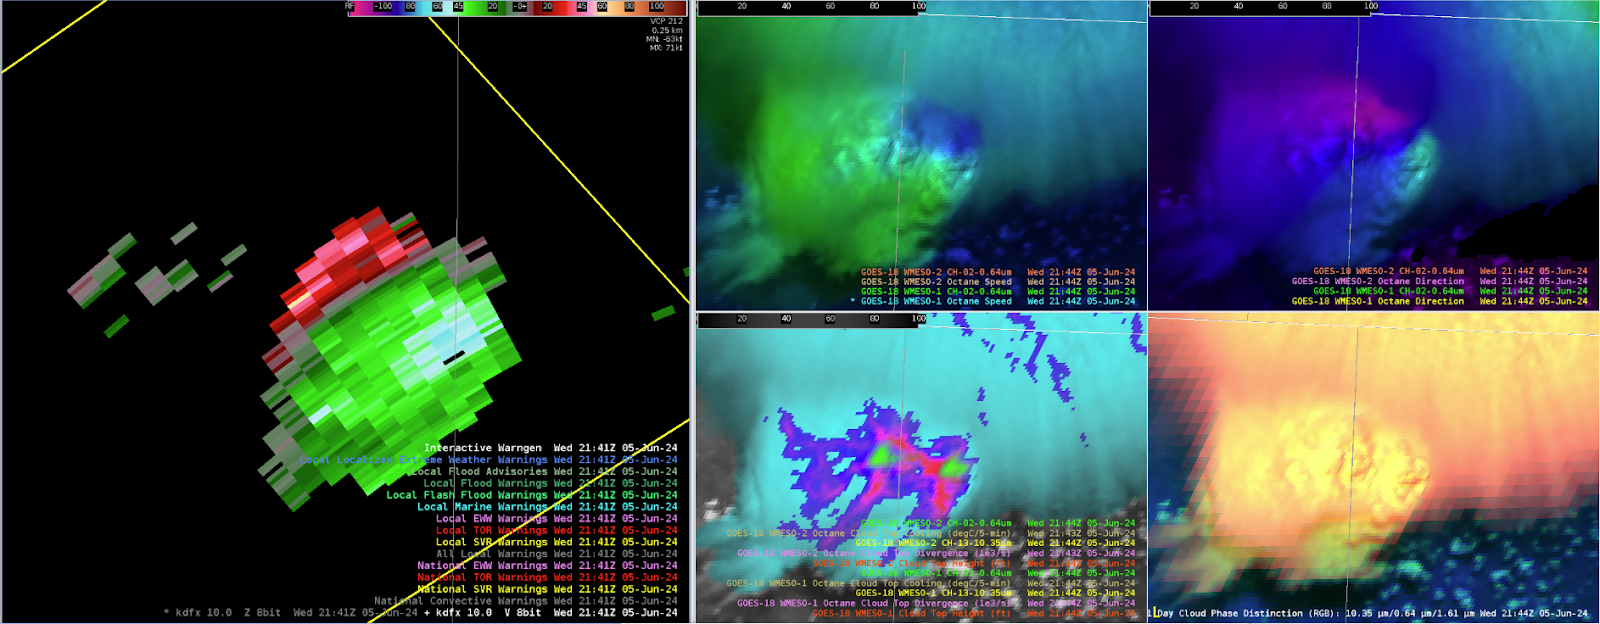
Modifying the OCTANE speed product by decreasing the max observed values downward and min values upwards helped diagnose a more eye turning signature to storm top divergence. Additionally, modifying the direction scale, albeit took some work, came out with a product that illustrates (in red) backed sfc winds <`180 degrees which existed well ahead of it, inferring the likelihood of larger curved hodographs and greater attendant estimated low-level SRH.

However, one item that was not noticed until after the TOR warning was the winds being ingested into the storm (shown in green) averaged around 210-230. This appeared very accurate looking at feeder cumulus ingesting into the inflow region of the cell just to the SSW. Less backing of the surface winds yields much less available streamwise vorticity (in fact is mainly crosswise) leading to the likely reason the storms rotation did not strengthen, and ultimately collapsed 30 minutes after the image above and the left-turning supercell became the dominant storm.

Overall, OCTANE exhibited great, practical uses to understanding not just the storm intensity/trends but the environment explaining why the storm was behaving the way it did.

- RED11248
Wednesday, June 5, 2024

San Antonio Waiting Game

San Antonio: broad cu field is still fighting substantial dry aloft despite extreme instability in the Great Bend region. No notable cooling or anything of note in the OCTANE data. Residual outflow boundary from earlier MCS is acting as a mechanism for a lone strong-severe thunderstorm just north of our CWA. Strong OCTANE divergence and cooling seen along the nose of PHS instability gradient with 3500+ CAPE; shear is essentially zero across this region. PHS composite reflectivity clearly did not forecast this outflow and thus the convection.

2100z: Strong-severe lone thunderstorm with very clear and strong divergence signal in both divergence field and speed fields. Rainbow signal seen in the direction field due to the very limited shear.

Orphaning anvils in the cooling OCTANE fields to the west of the primary convection suggest the PSH fields for instability are just displaced to the east at 2100z.

Nice depiction of the PHS being wrong but right at the same time. Clearly slightly displaced with instability gradient to the east, but accurately showed the single cell or two behavior that we have seen.

Impressive single cell continues as of 2130z, and some notable cloud top cooling and divergence is now seen in the cell to the southeast. Instability axis is clearly ~50 miles to the north of the PHS.


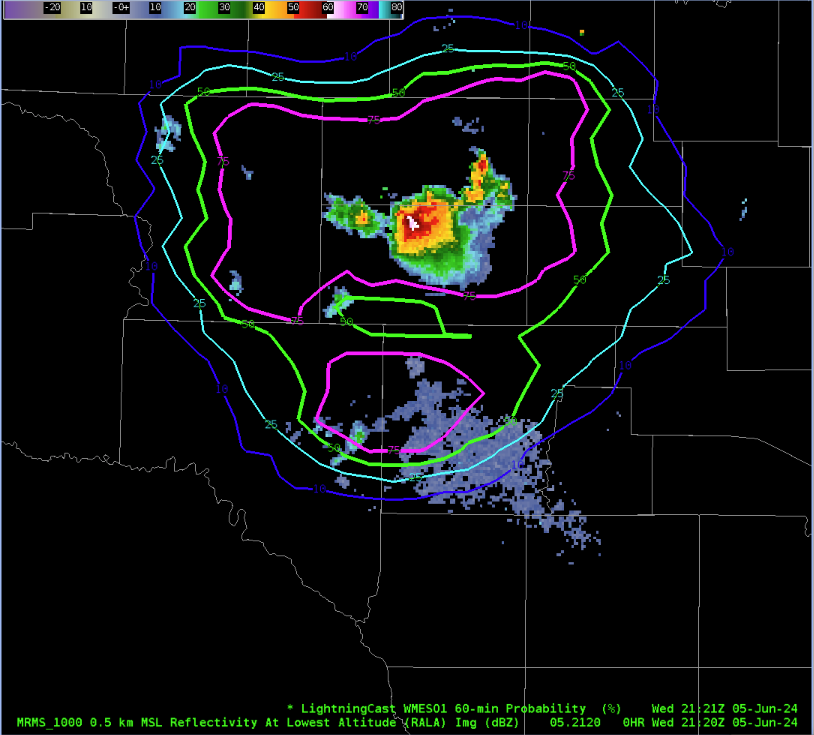
Lightningcast is bullish on both the southeast and south newly developing convection. Very broad contours however, possibly too much false alarm area here (?).


Broad persistent divergence in OCTANE fields in the southern cell. DHX radar shows 50 dbZ core over 30k feet within an extreme instability zone of 4000+ j/kg. Issued a severe

Large jump in cooling seen above the divergence field in OCTANE, expecting further intensification shortly in the next.

DHX Radar Divergence maxing out around ~90-100 knots as of 2150z. OCTANE cloud top divergence is generally sitting between 25-40 knots.

Double Rainbow!

Deep persistent OCTANE divergence in speed and direction, core weakening slightly based on DHX radar but still likely warranted a second warning. No signs of real weakening in any of the satellite products, but radar not quite as tall with 50 dbZ core.

-Hellothere

PHS/HRRR/SPC Meso Comparative Analysis

 PHS/HRRR/SPC Meso Comparative Analysis

Overview:

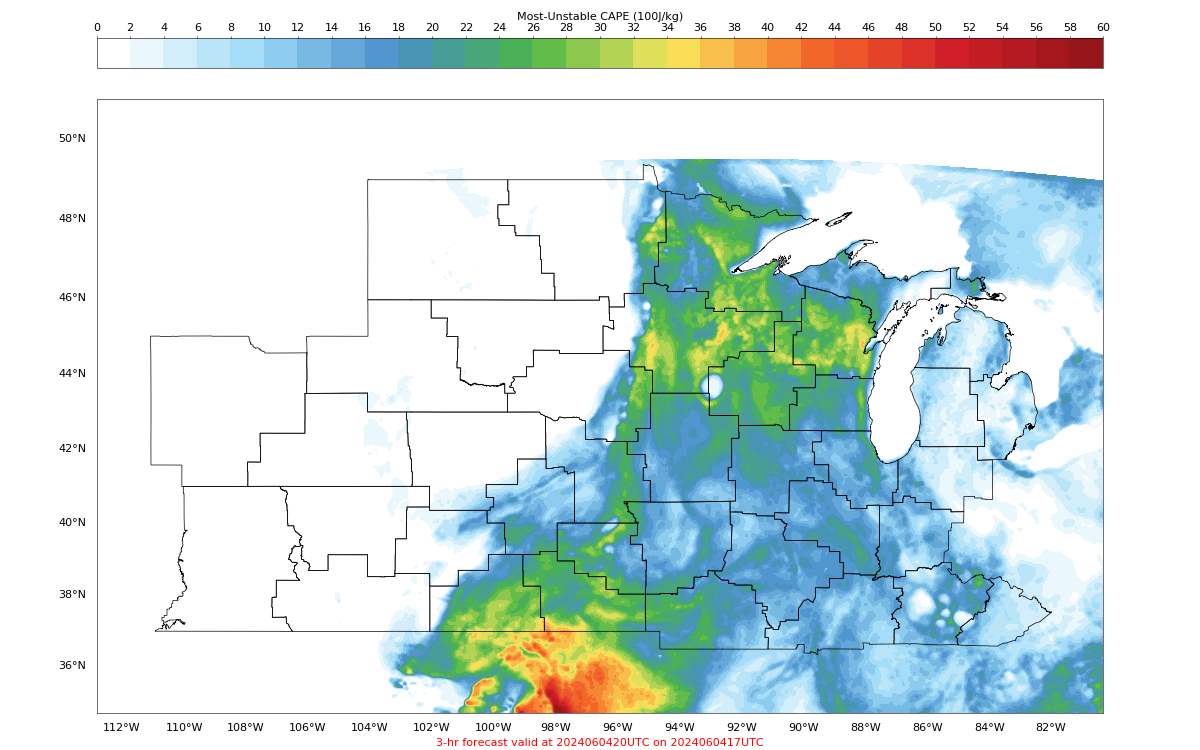
For this event over the ILN CWA, we will focus on 3hr forecast verification from hourly runs of the PHS and HRRR starting at 17Z, ending at 20Z. Each models 3hr forecast will be compared with SPC mesoanalysis data for verification/comparative analysis.

Tuesday, June 4, 2024

Central Minnesota Overview & LightningCast Behavior in Northern Wisconsin

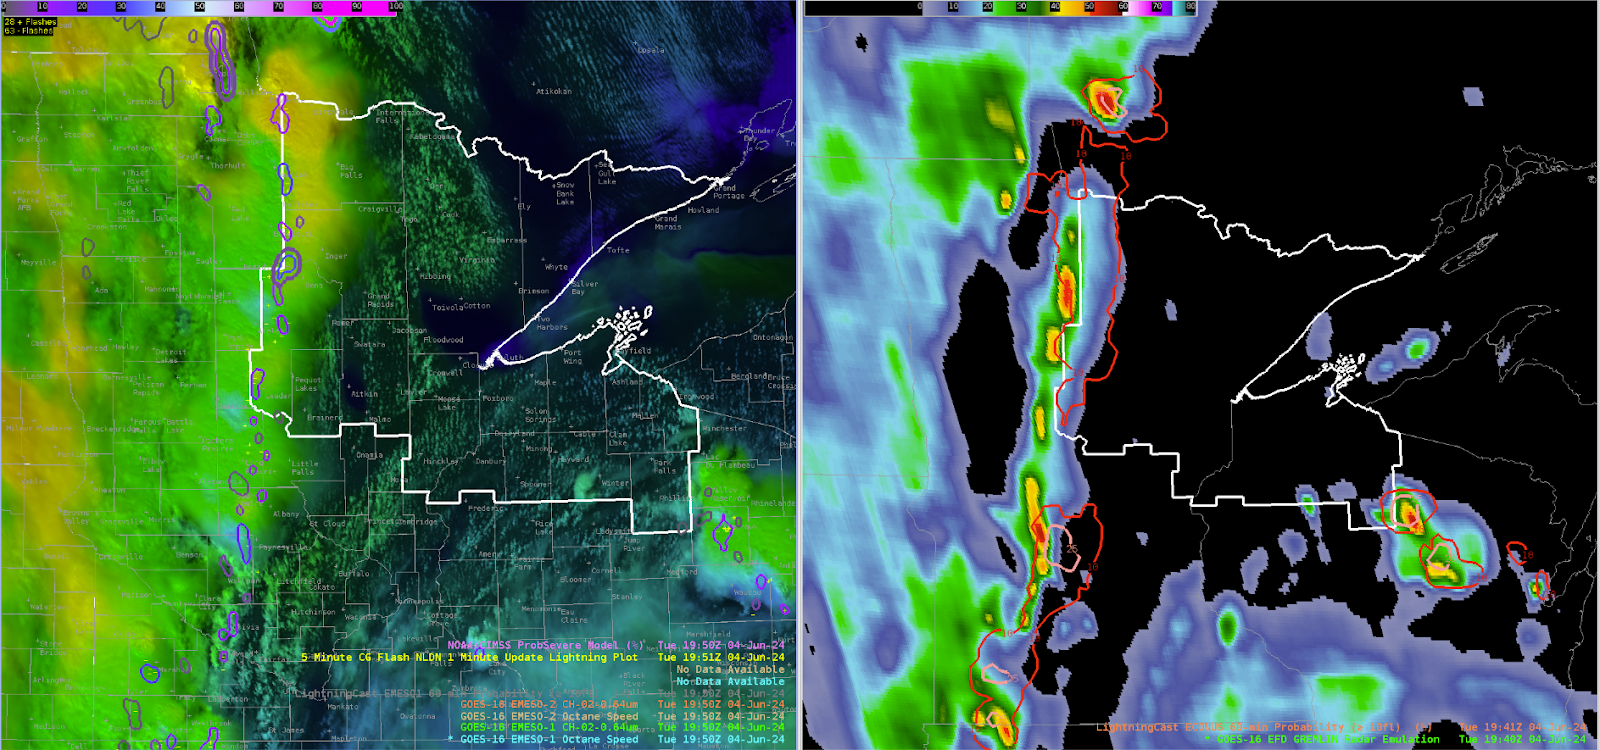
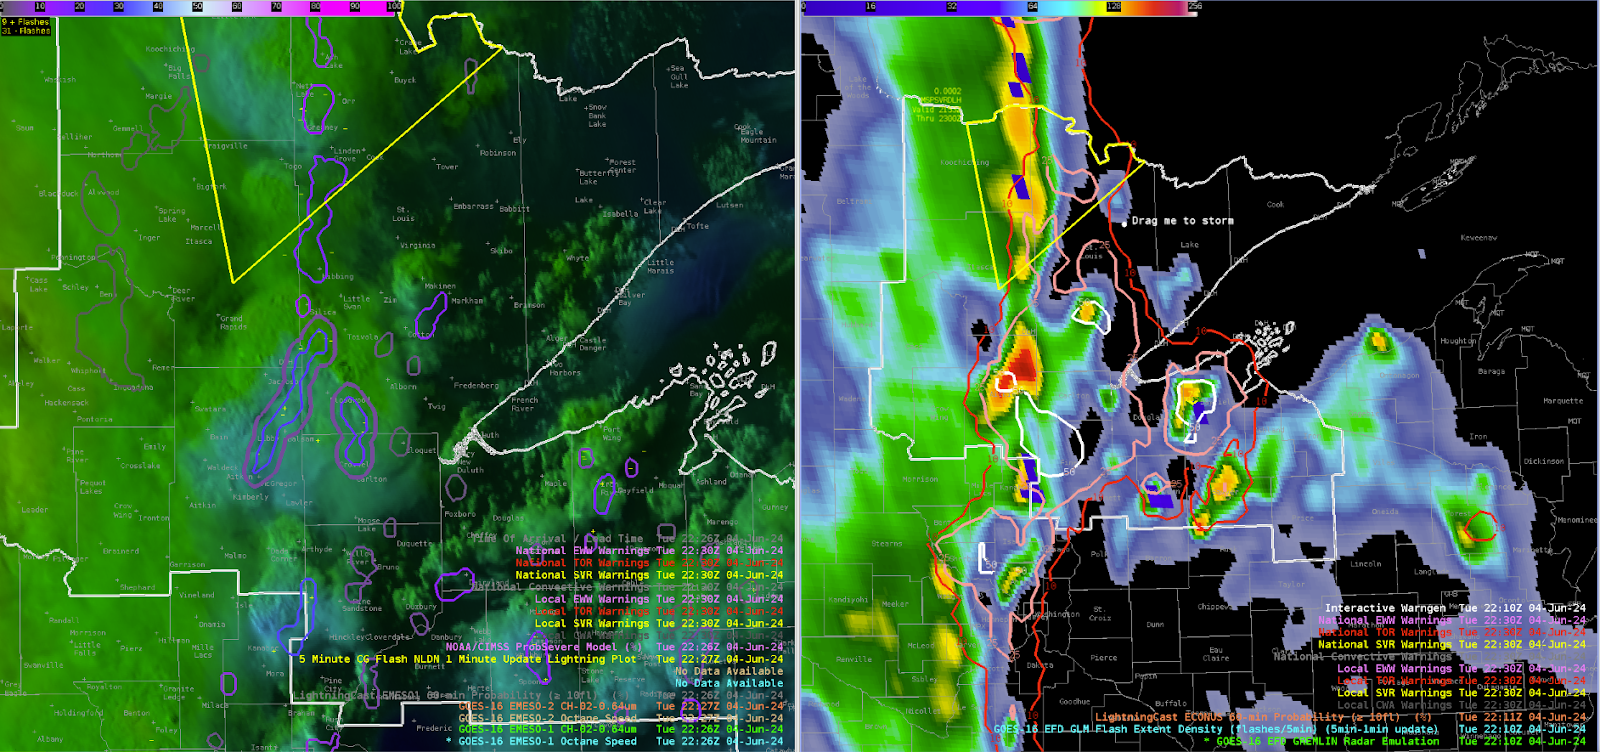
 As of 20z, a strong line of thunderstorms associated with sharp mid-level shortwave and surface cold front is pushing across into central Minnesota. For a brief overview (DLH radar is down), GREMLIN shows a broken line of moderately strong convective cores dotted along this line, but overall the lightning production remains meager; LightningCast probability of greater than 10 strikes has only peaked out around 25% at any point within the line. The convective cluster sliding across northern Wisconsin remains the most highly active lightning producer around. OCTANE divergence fields further support the lack of strong-severe updrafts throughout the line for the time being.

PHS fields across the region suggest weakening deep layer shear but increasing instability to the east. This generally falls in line with other guidance (SPC Meso, HRRR).


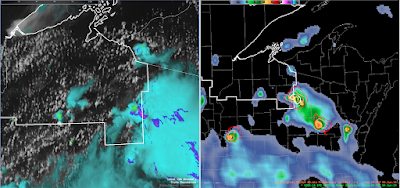
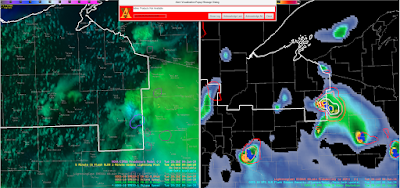
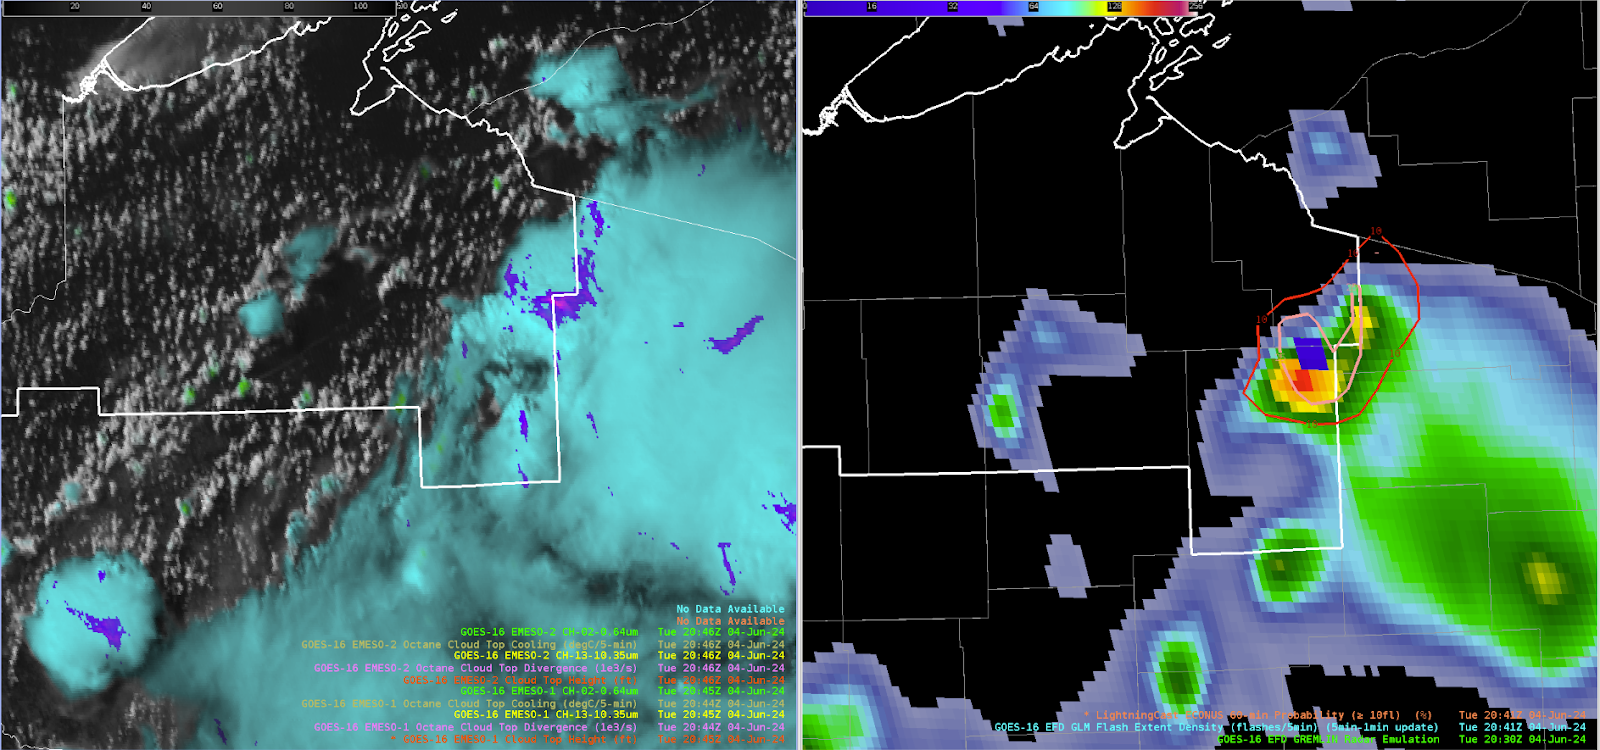
As of 2018z, interesting LightningCast signal in northern Wisconsin with 70%+ prob for greater than 10 strikes in the next hour. Not clear exactly why this is the case but it is a very strong signal moving forward. OCTANE fields for both cooling and divergence are not too intense. Cell to the west exhibited fairly strong cooling as well temporarily but appears to be weakening.

Note @ 2030z: Likely orphan anvil and more mature cells across northern Wisconsin with weaker orphan cell to the west and stronger to the east. Despite relatively few ground strikes, the GLM did produce > 10 flashes (verifying the high lightningcast probs).

And @ 2045z: Orphan anvil has totally dissipated, verifying the lightningcast low probabilities and the eastern storm steadily dissipated with weakening OCTANE divergence.

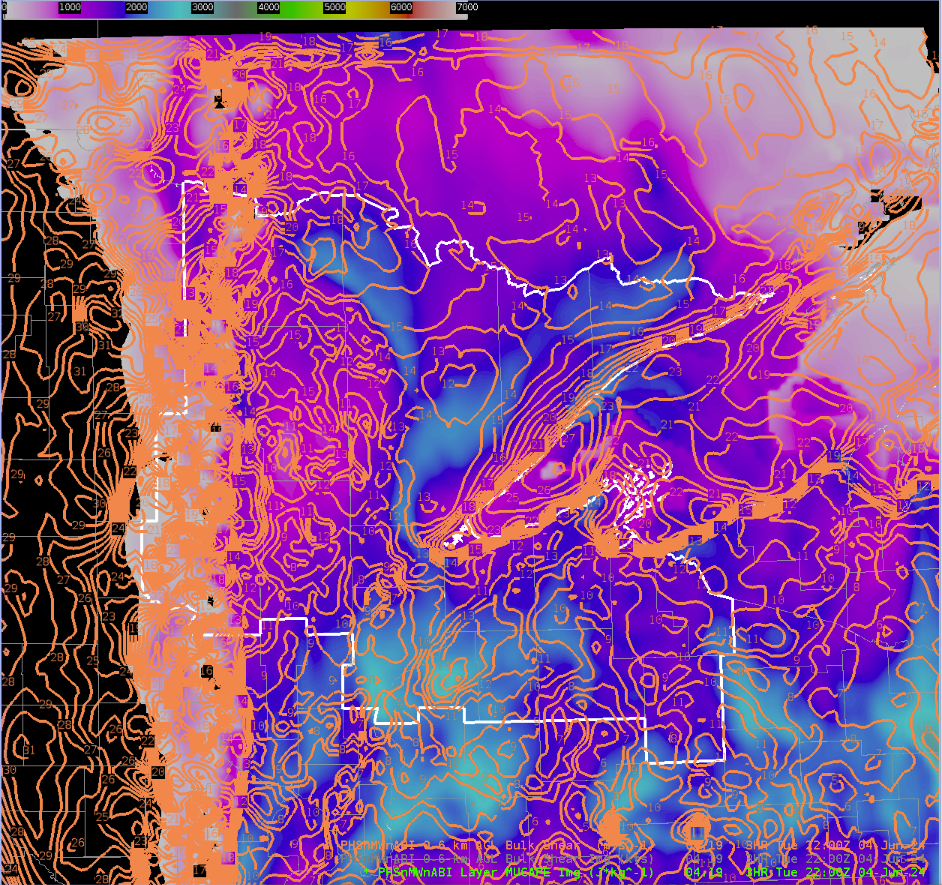
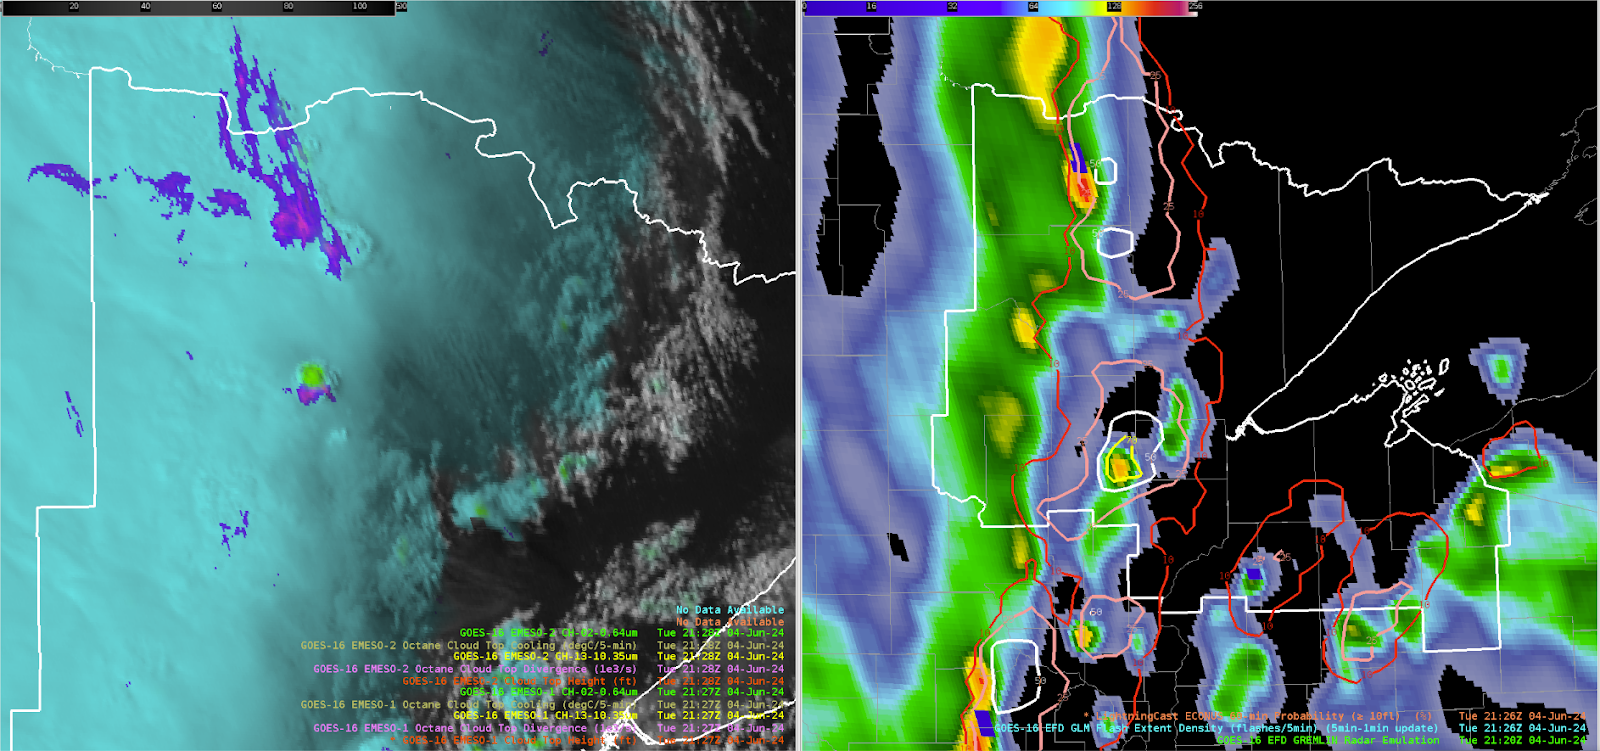
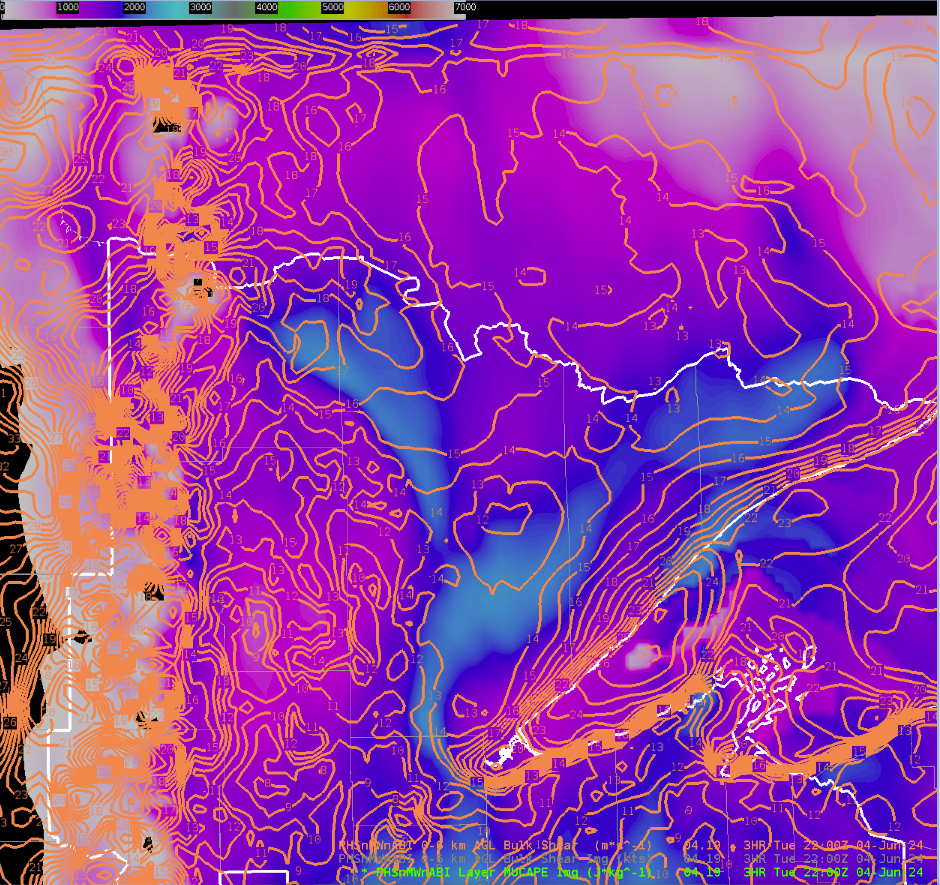
2100z: Convective coverage beginning to move closer to the Duluth area with the primary frontal band to the west and some prefrontal convection developing ahead. OCTANE cooling is lining up well with the GREMLIN coverage for these prefrontal storms, with a moderate-high signal in the lightningcast data. Still no indication of severe storms in any of the available products, PHS instability increase to around 2500 j/kg but 0-6km bulk shear falls off to around 20-25 knots. However, the instability axis looks to be displaced to east and helps explain to the not very impressive cloud top divergence in the OCTANE fields west of Duluth.

2130z: Overshooting tops seen across the northern tier of Minnesota. PHS instability and shear are maximized across this area. GREMLIN and GLM is not very impressive yet however, but cooling in OCTANE is noticeable.

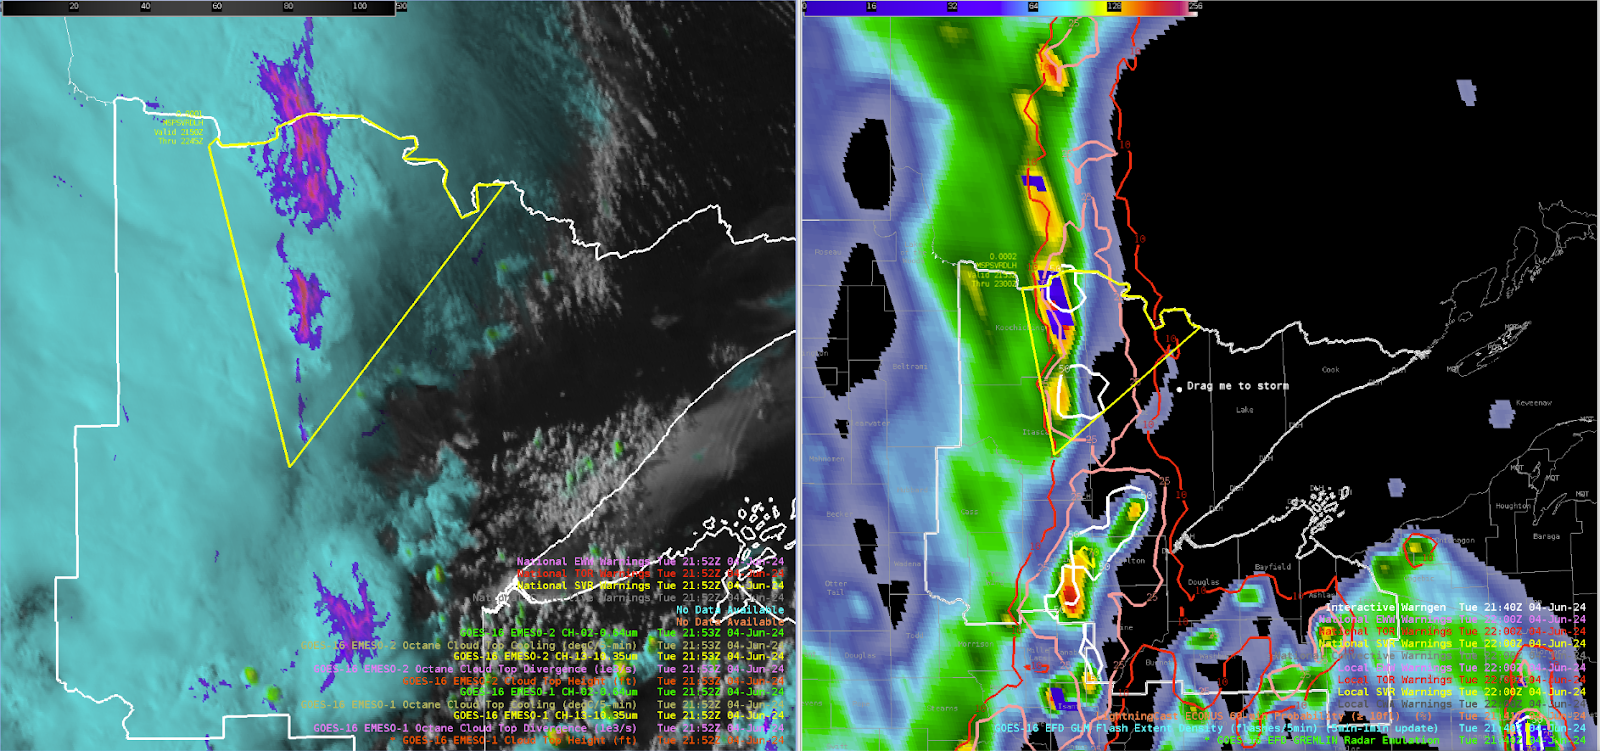
2150z: Issued a severe thunderstorm to cover the strengthening line of convection across northern Minnesota based on OCTANCE divergence, GLM, and increasing GREMLIN dBz. PHS environmental data maximized shear and CAPE across the region with 2500+ j/kg and 30-40 knots of 0-6km shear. OCTANE anvil cumulus cooling was noted for multiple times along with persistent divergence. GREMLIN radar signatures helped tune where the spatial extent of the warning would be.

2230z: Interestingly strong signal in the GREMLIN west of Duluth. Unclear exactly why, OCTANE and GLM are not very impressive at least relative to other storms today.

-Hellothere

Monday, June 3, 2024

Severe thunderstorm warning issued for South Central Wisconsin

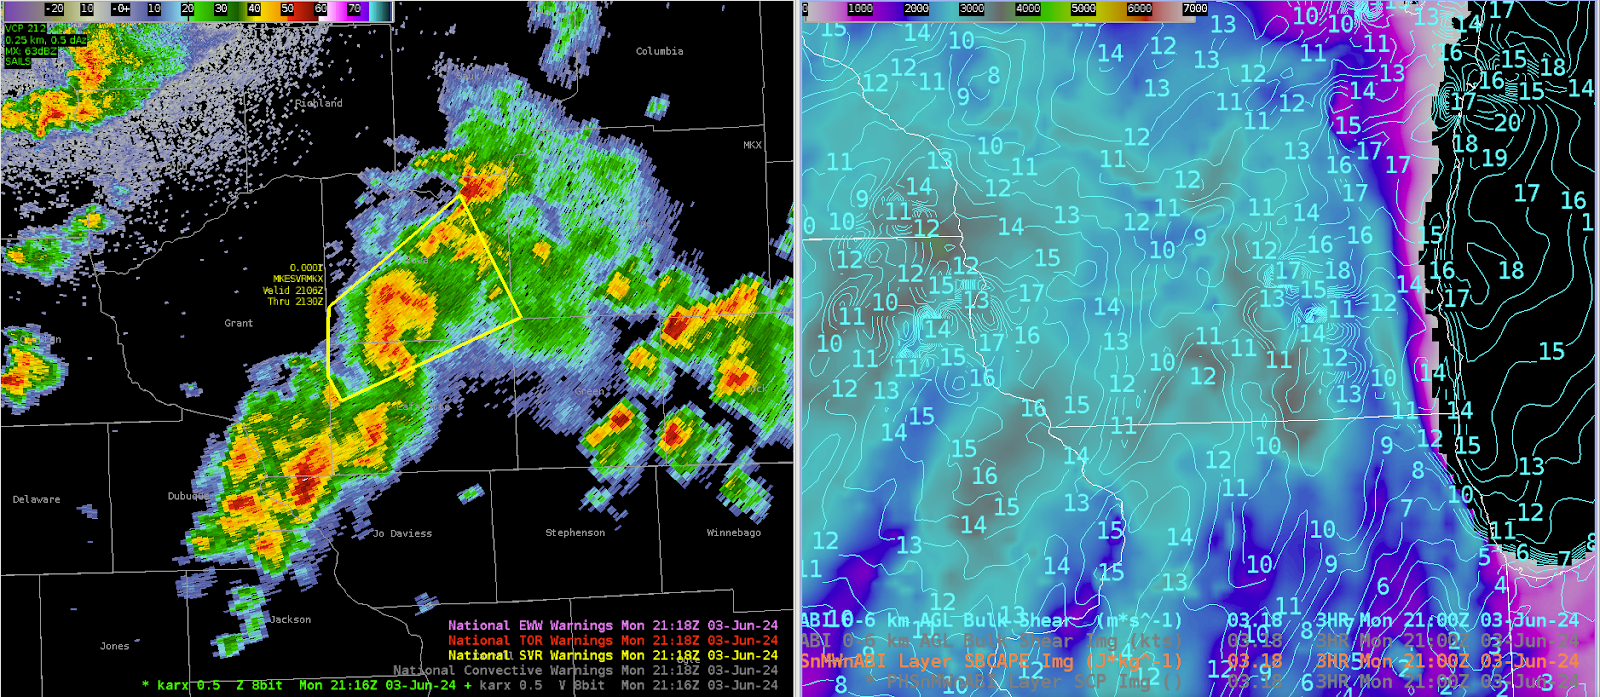
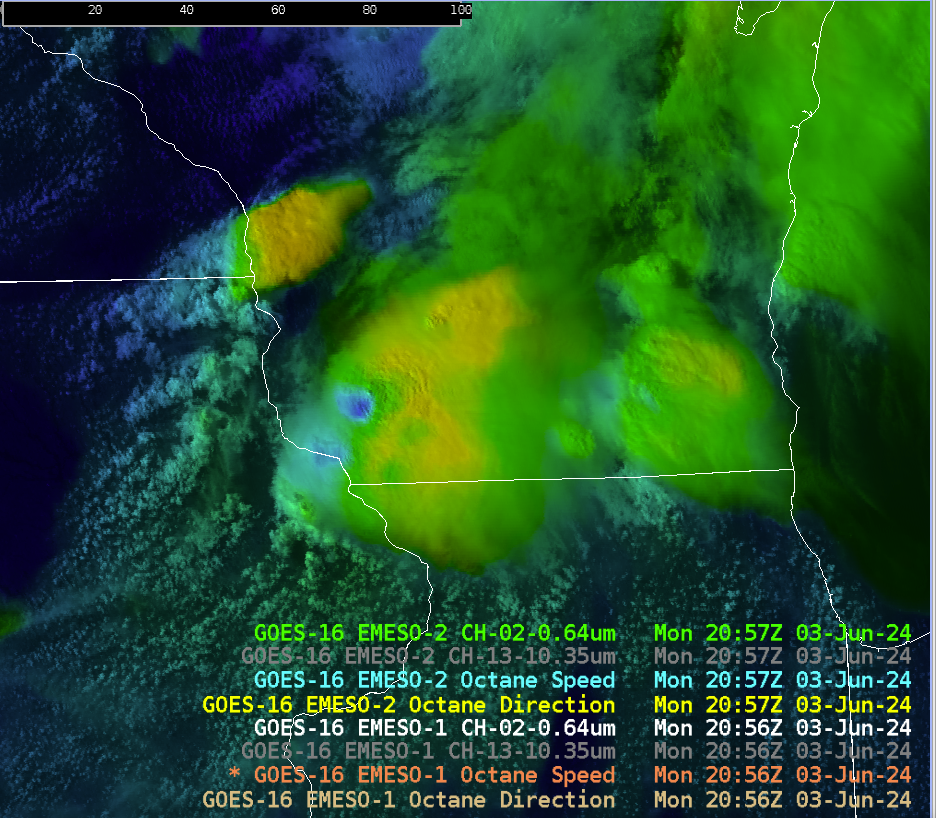
 Solid signature from both nearby radars but the beam height was at least 8k feet. PHS environmental fields were supportive of a primary wind hazard. OCTANE divergence fields distinctly noted this cell with persistent strong divergence as it moved into the CWA. Low level wind fields were not as impressive with widespread STP of less than 0.2, despite strong instability in the PHS fields.

-Hellothere

THE TALE OF TWO GUIDANCE SYSTEMS

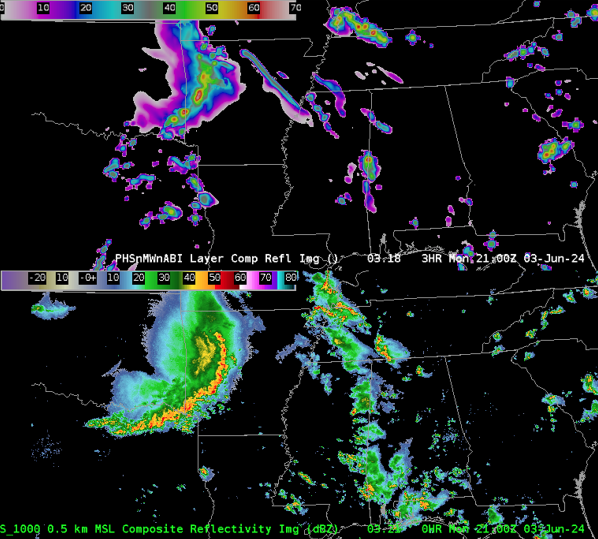
THE PHS MODEL GUIDANCE has had difficulty providing an accurate near term forecast with respect to the purely linear mode to the MCS as it moves east into the Texarkana region. This is most noticeable with respect to the southern portion of the linear convection. This can be seen easily below with the 3 hr forecast (in the image below) is the top panel of the image. The composite reflectivity (considered verification) is the bottom panel of the image.

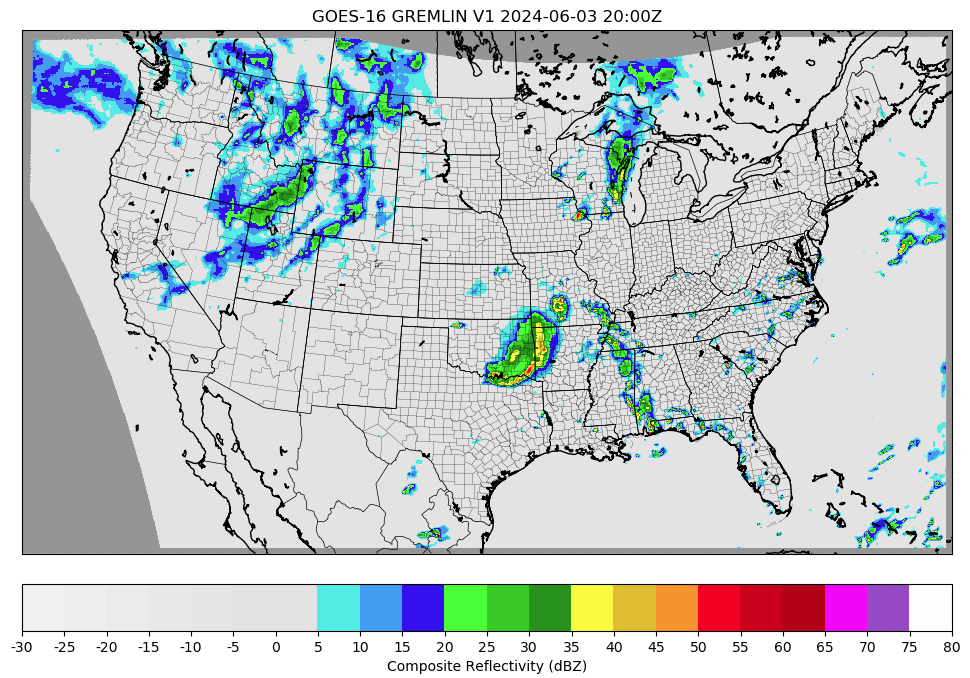
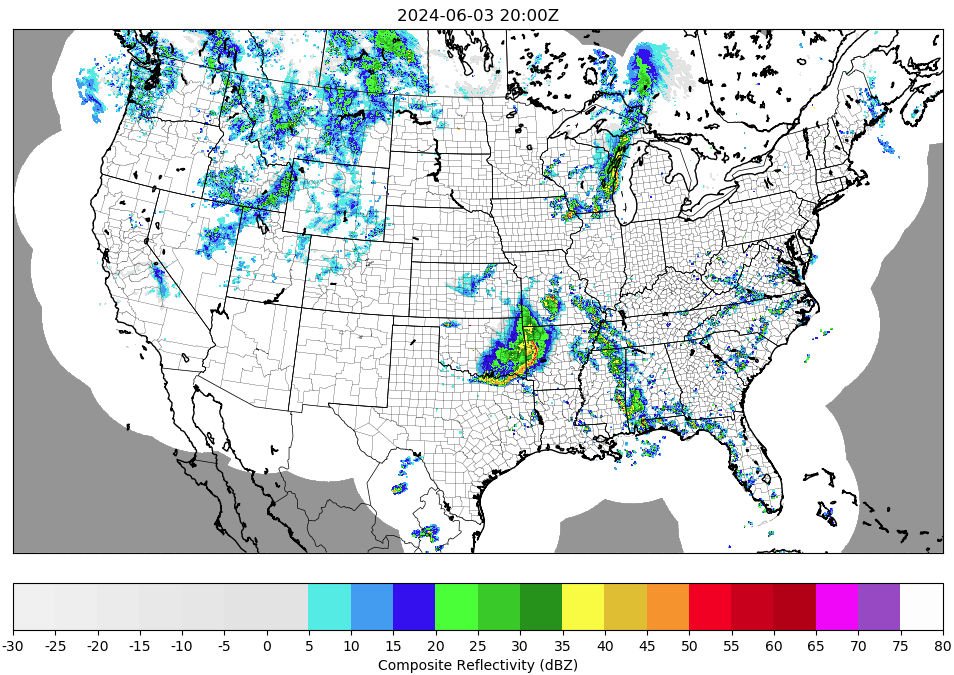
THE GREMLIN MACHINE LEARNING GUIDANCE on the other hand has performed very well with the linear MCS in the near terms, along with other convection further downstream to the east. In the images below Gremlin is the top image and MRMS (considered verification) is the bottom image.

-5454wx

Thursday, May 23, 2024

PHS and HRRR for WFO ABR

As of 2030Z, storms have already initiated near Pierre SD in the KABR forecast area.

Both PHS and the HRRR appear to be too slow on forecasting convective initiation in this area.

The first image is PHS comp reflectivity (overlaid on PHS SBCAPE) valid at 22Z.

The image below is HRRR comp reflectivity valid at 22Z. Both PHS and HRRR are depicting convective initiation between 21Z-22Z, but as mentioned, storms have already initiated as of 2030Z. PHS and HRRR both show initiation in slightly different locations, but in real life, initiation occurred near both indicated locations.

Both PHS and HRRR also depict that stronger cells will develop near the SD/ND border in the 23Z-00Z time frame. The next two images show this in the parameter space. The first image shows Sig Tor Parameter on PHS (valid 23Z) and the second image is the same thing, but with PHS comp reflectivity overlaid on top.


Of most note is the simulated storm northwest of Ashley ND, which not only has the highest simulated comp reflectivity value, but also significantly impacts the storm-scale environment (as depicted in the model by an unrealistic significant localized bullseye of STP). As a forecaster, although I recognize these STP values (~10) are likely spurious, I can use their presence as a proxy to the fact that the storm simulated by PHS in this location is likely very strong and modifying its environment in a way that only significant supercells are able to do.

-- Insolation


Reviewing Conditions Between the RAP and PHS

The PHS WRF will offer a unique means to compare RAP analysis and instability parameters. When observing what conditions were like in the PHS, it was noticed that the inclusion of satellite data resulted in drier conditions being observed at the lower levels across western Nebraska.

Satellite viewing of drier weather also corresponded with warmer temperatures across western Nebraska at the surface.


Now how does this look in comparison to various model fields in the RAP. On the bottom left are near surface dewpoints in the PHS, and on the bottom right is the RAP. Carrying forward into the simulation, the values for dewpoint were about 1-2 C below the RAP analyzed forecast. This corresponded better with surface observations within the area. Where the RAP had lower 60s lifting north, these have not been observed near surface stations at the same time. (Note color tables are different. Attempt to get this again was unsuccessful due to CAVE crash)


Here is the same post, but with the CAPE contours now shaded instead with the contours of dewpoint in Kelvin. The lack of a gradient in dewpoint conditions was more representative of the ground truth observed at different ASOS stations.


As far as the temperatures went and how it affected instability, you can also observe the RAP analyzing a cooler pocket, and it likely seems to be the result of the coarse model struggling to capture the terrain across western Nebraska.


What's interesting is that the instability parameters are not completely different. The reason could perhaps lie in the observed data suggesting a warmer layer aloft. However, the RAP analysis did not differ significantly from the PHS data at 00z.


If you also look, the PHS also has a broader area of instability to the east compared to the RAP. This is where the PHS indicated higher moisture content, and it may be able to destabilize the region more efficiently as a result.

Finally, despite the drier air in comparison to the RAP, it indicated convective initiation about an hour earlier. Using the the forecast helicity and updrafts at 500hPa, one can see that initially pulse convection with minimal rotation should encounter an environment of increasing helicity. We shall see what comes out of this.


For forecast areas that may not have the benefit of features like WoF or other tools to analyze environmental conditions, looking at how differences in the satellite incorporated data and RAP mesoanalysis can help forecasters weigh environmental conditions and what they see from the RAP.

Kadic


Update to PHS versus HRRR Convective Initiation


Looking at an update of the 19Z HRRR run and the 17Z PHS run, the more recent HRRR run is catching up to a sooner initiation solution. The 19Z HRRR is initiating cells as early as 21Z with a series of cells displayed above by 22Z, similar to the 17Z PHS. Another note is that the newer HRRR run has a higher SBCAPE value than the PHS at 1700-2700 J/kg compared to 1000-2000 J/kg from the PHS. Recent visible satellite trends look to favor an earlier initiation as well.

-Joaq

Waiting for CI - Looking at PHS

Anticipating most of the activity, should it develop, to begin in the next couple of hours in the western/southwestern portion of ABR's CWA. However, I wanted to take a quick look at PHS to see some of the environmental parameters and how it relates to what's going on now (and maybe later). 

PHS Composite Reflectivity overlayed onto Visible Satellite (left) and MRMS Reflectivity (right)

For the above loop, PHS has perhaps the general idea of CI from the convection from earlier this afternoon, but struggled a bit with placement of some the stronger cells in the east. However, I think it may have a good handle of the lull we're expecting until later this afternoon. It will be interesting to see whether we get storms in the line of pearls like it's suggesting. 

PHS MUCAPE at 20Z

SPC (RAP) MUCAPE at 19Z

Comparing the MUCAPE from SPC's Mesoanalysis page (RAP) and PHS, it seems like both agree on ~2000 J/kg nosing into the southwestern portion of ABR's CWA. This is the area that we are monitoring for initiation over the next couple of hours.


Forecaster Cumulus

Convective Initiation Timing Between the PHS and HRRR


Here we compare convective initation in the PHS model (right) versus the HRRR (left). Both models have relatively similar SBCAPE (around 1000-20000 J/kg) but the HRRR does carry CIN longer through the afternoon. The 16Z (and 17Z, not shown) PHS model produces convection by 21Z to 22Z, while the 17Z HRRR waits until 23Z. 

Below is the 1854Z GOES-East day cloud phase RGB which shows some shallow cumulus growth in western to north central areas of the CWA. This may lead to more confidence in the earlier convective development from the PHS model.


-Joaq

Wednesday, May 22, 2024

Comparing PHS Reflectivity with the HRRR and MRMS Reflectivity


In this animation we track the progression of MRMS composite reflectivity (right) hourly over the previous three hours compared to the PHS (left) and HRRR (center) reflectivity. This morning convection allowing models were slow to initiate convection compared to reality and it seems that trend is continuing this afternoon with the southeastern progression of ongoing convection. The PHS has been slowest today with the southeastern movement, while the HRRR is a bit closer to reality but still behind (especially in the in the northeastern portion of the CWA. 

-Joaq