Showing posts with label gridded NUCAPS. Show all posts

Friday, June 10, 2022

Metwatch for Wilmington DSS event

 Metwatch for Wilmington NC started with modified NUCAPS soundings and a comparison with NAM BUFKIT profiles:
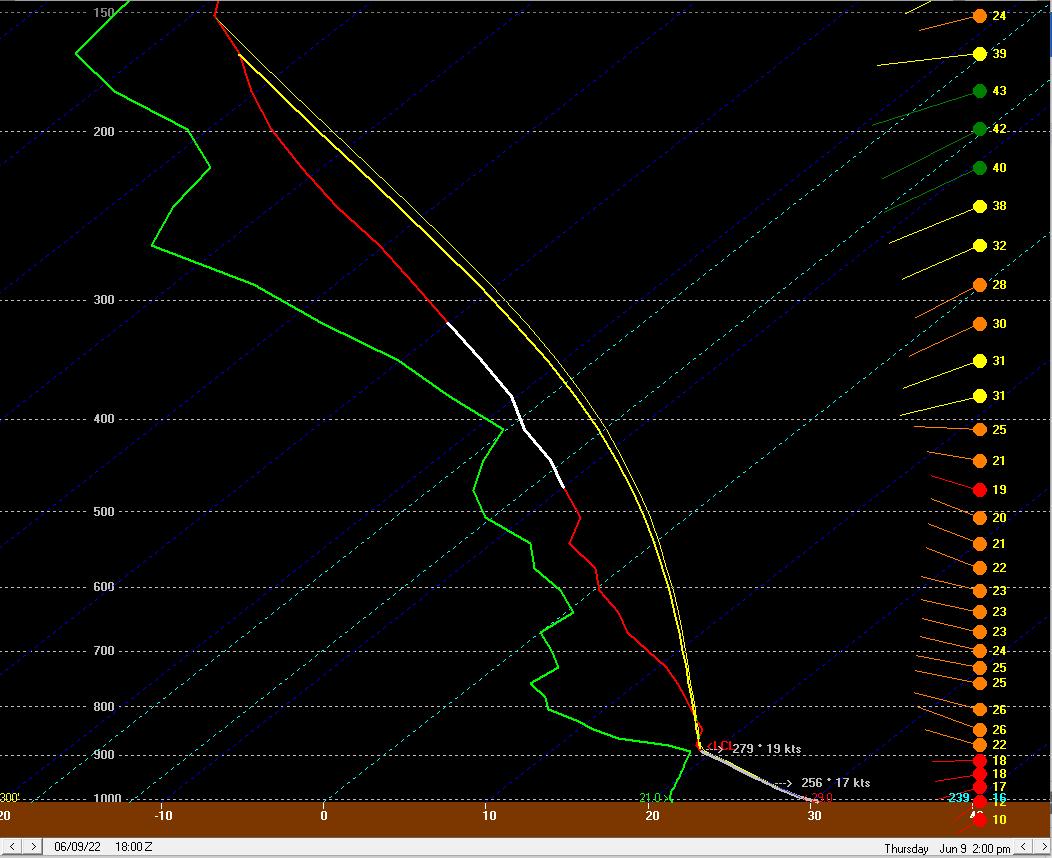
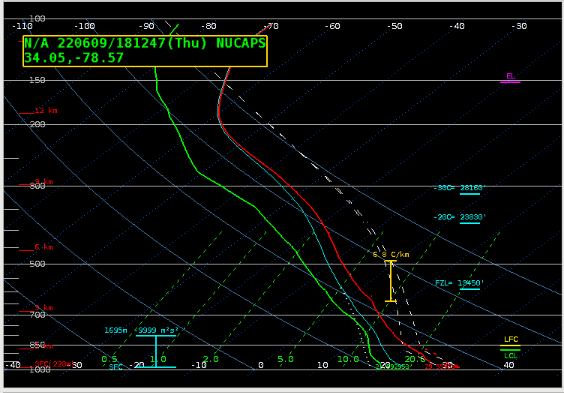
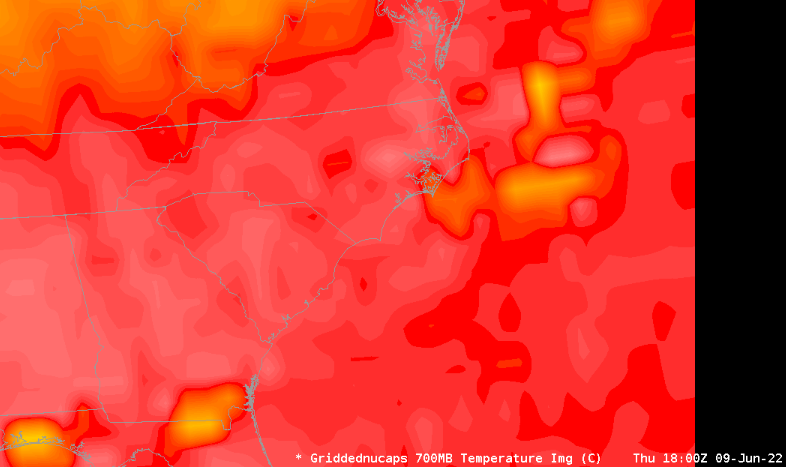
Looking at 700mb temperatures, BUFKIT has about 8C for that layer, and here is the gridded NUCAPS 700mb temperature layer. Note: not a lot of advection noted at 700mb, with low level dry advection (not shown)
Watching this cell just outside the CWA pulse and then fall apart…PWV3 never exceeds 4% with this pulse. LightingCast also showed a rapid drop in probabilities.

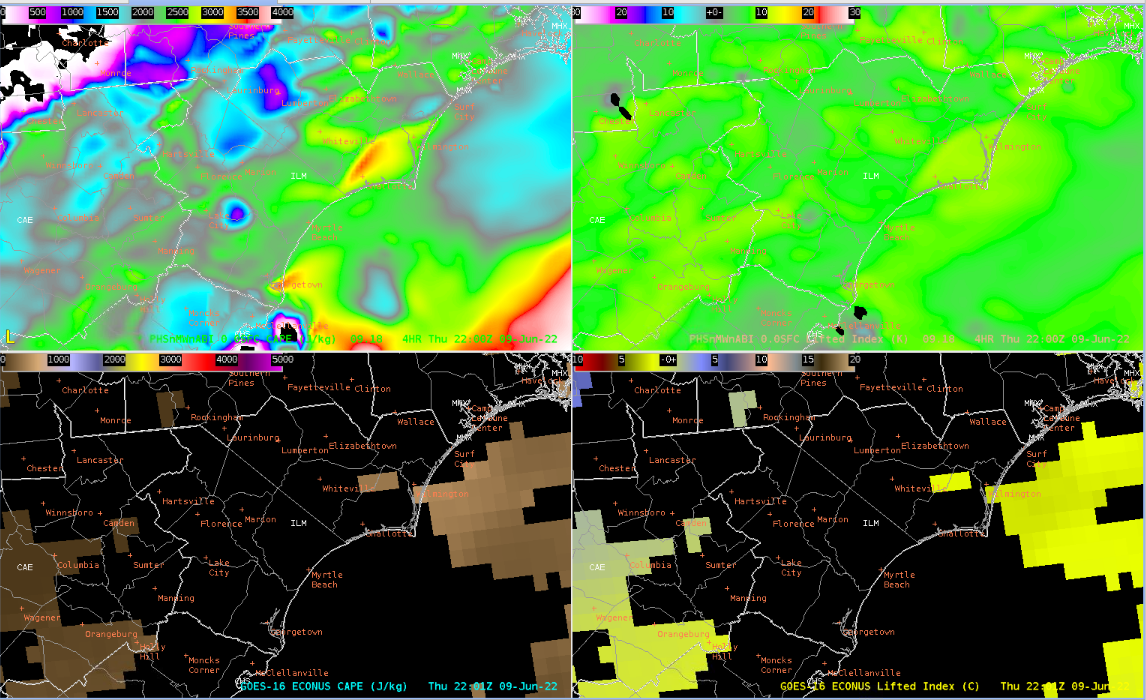
Not much happened today, but just along the coast was this little area of enhanced CAPE (3000j/kg)...so you’re saying there’s a chance…
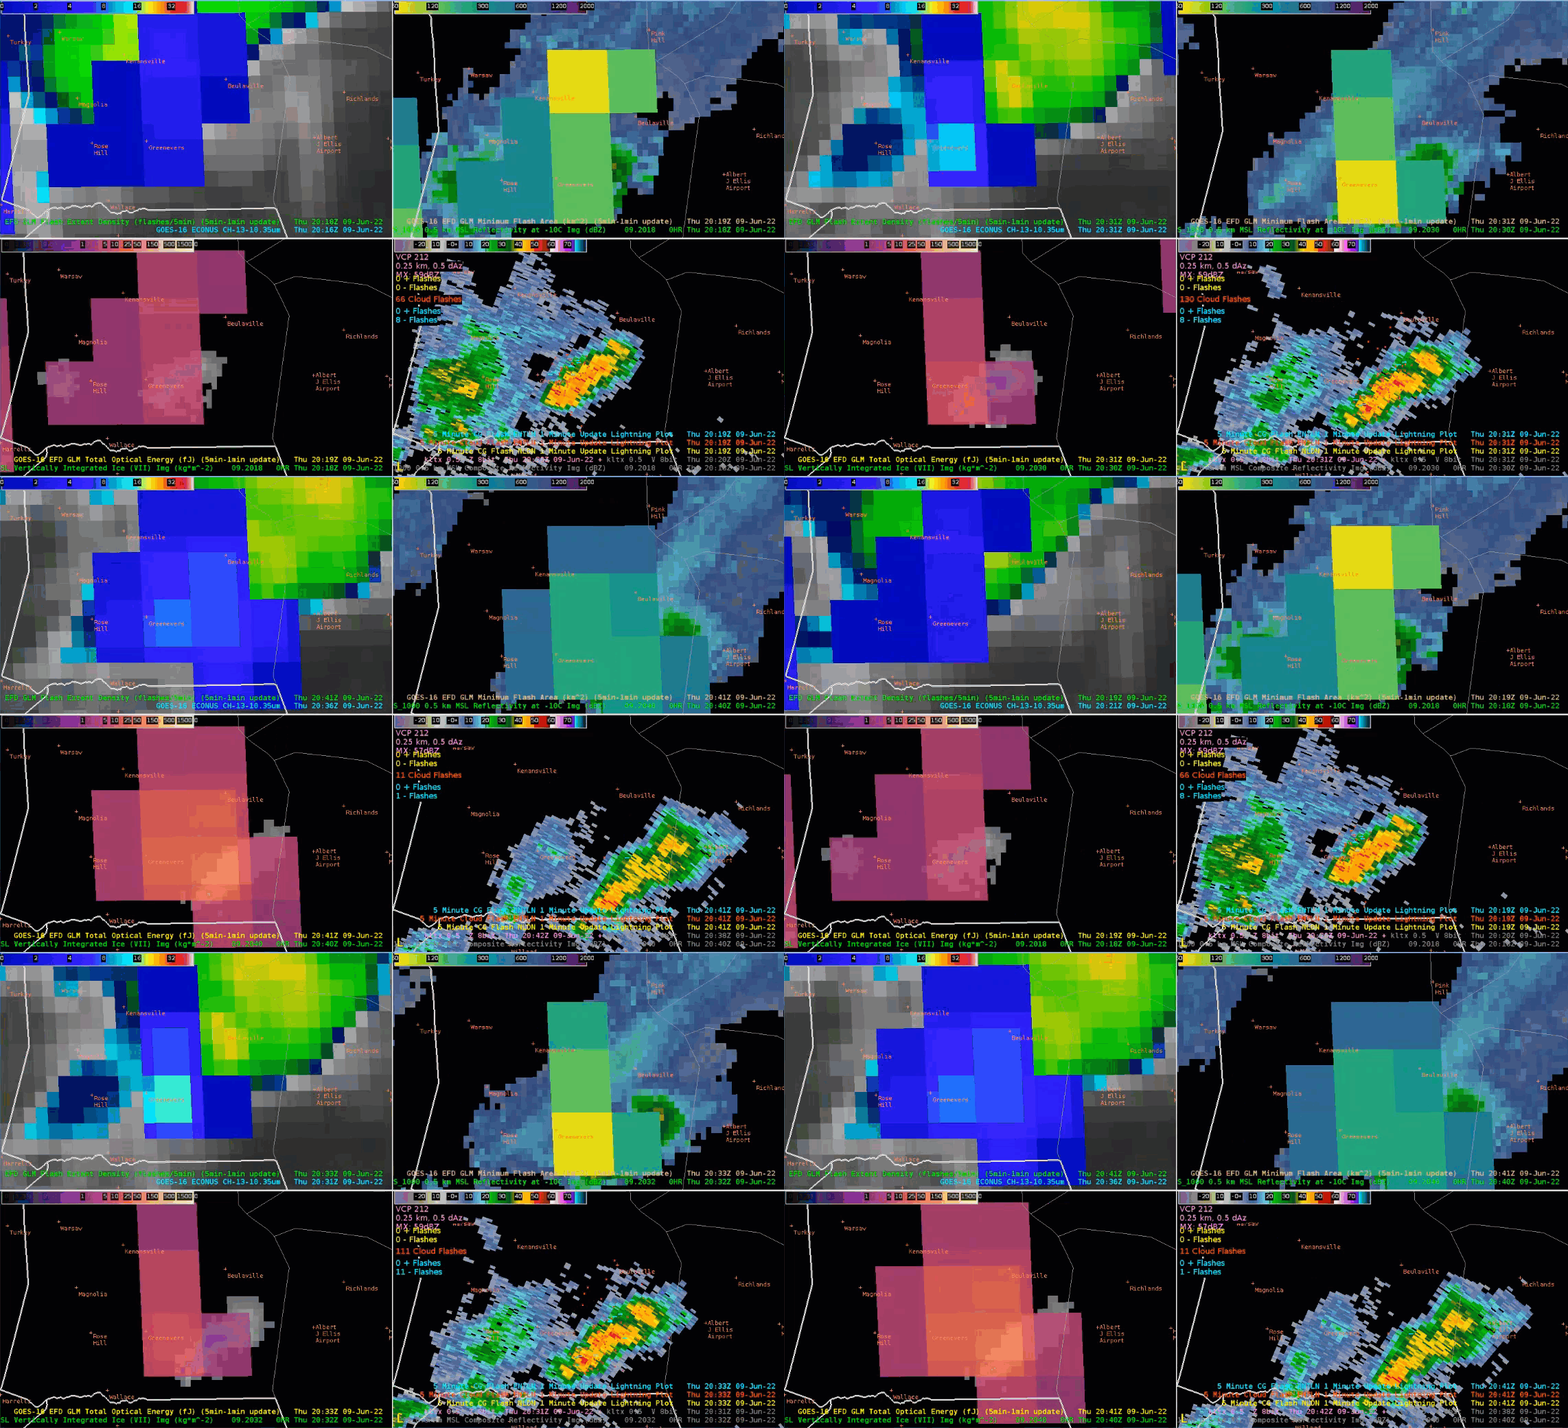
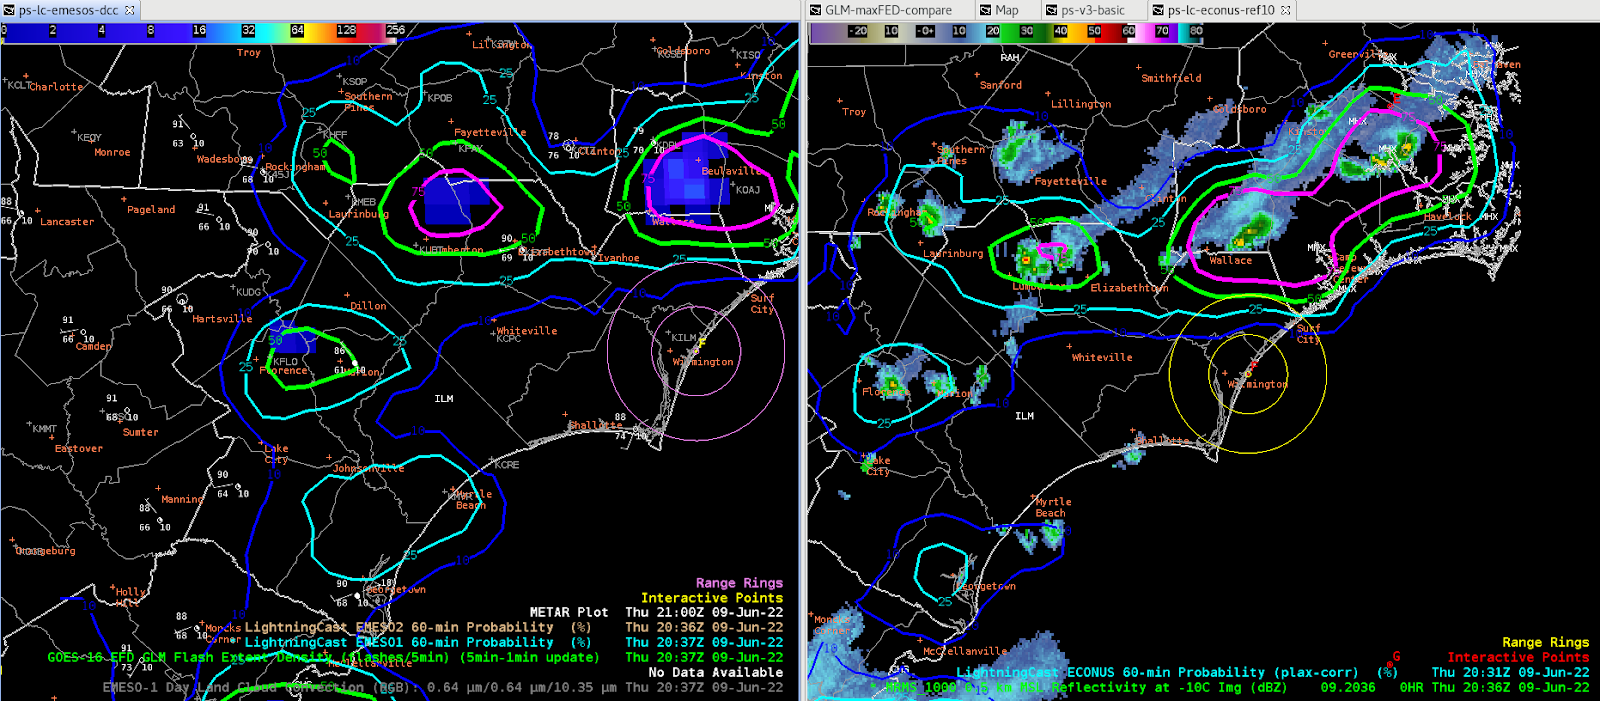
Comparison between parallax corrected and uncorrected lightning cast. You can see the image above and to the right (corrected) has some higher percentages getting into the 20 mi range ring compared to the non corrected data which just has the 25% grazing the 20 mi range ring. Having the corrected data could be more beneficial to providing DSS support.

- Mr. Bean

- Noctilucent

Thursday, May 23, 2019

Comparisons of NUCAPS and Model Data Lapse Rates...

So, it can be refreshing to see when NUCAPS data agree with model data, but I'm often more interested in those cases where there are differences, and potentially important differences.  Notice in the images below the comparisons between NUCAPS 850-500 mb lapse rates and various model data.

Image 1. 850-500 mb lapse rates from NUCAPS (upper left), HRRR (upper right), GFS (lower left), and NAM40 (lower right), valid ~18 UTC 23 May 2019

Notice the relatively large differences that stretch SW to NE from central W VA into New England.  Taking a look at nearby radar imagery, it's clear why this area had significantly lower lapse rate values in the NUCAPS data than the models; a line of showers and thunderstorms were present along this path of lower values that was displayed in the NUCAPS gridded data (Image 2).

Image 2.  850-500 mb lapse rates from NUCAPS (upper left), HRRR (upper right), GFS (lower left), and NAM40 (lower right), along with 0.5 Refl from the KCCX radar, valid ~18 UTC 23 May 2019

Of course, the NUCAPS retrievals certainly would have been affected by this area of denser clouds and precipitation.  Nevertheless, lapse rates would be affected (lowered) by the convection in those locations, which is depicted in the NUCAPS data only.  So, the lack of this feature in the models would then affect their forecast in this region going forward.  It will be interesting to see the NUCAPS forecast data in this type of scenario.  In fact, one of the forecasters here is taking a look.

-Kris W

Thursday, May 2, 2019

NUCAPS Modified Sounding Compared to Surface Obs


NUCAPS gridded 700-500mb Lapse Rate and Modified sounding points.  Lapse rates are favorable for storm intensification across the southern part of FWS CWA.


NUCAPS Modified sounding had 72/69 (temp/dewpoint), compared to closest surface METAR KLHB 74/69 (temp/dewpoint).  This sounding data showed un-capped and unstable environment supportive of surface based convection in southern FWS CWA.

-Jake Johnson

Wednesday, May 1, 2019

NUCAPS gridded data example


An example of NUCAPS gridded data over Texas. Convection was already underway at this time, as seen by the very high pixels in south OK and north TX. This field is 850-300mb RH. The dryline is evident, however the usefulness of this and other NUCAPS gridded data is questionable for operations because of the poor resolution. With so many other much higher resolution surface and gridded data sources available, I doubt I would be using these products much at all in operations.

-Dusty Davis

Thursday, May 24, 2018

DLH - Mesoscale Discussion

2100Z: Storms have been ongoing for a while across the region but waited to write this post until the modified NUCAPS soundings were in. Right off the bat the all-sky CAPE does not seem to capture the general spatial pattern well compared to SPC mesonalysis/HRRR & observations. The all-sky suggests CAPE over 1000 J/kg over NW MN & SE MN & along a narrow tongue from southern MN up towards the Twin Cities. However mesoanalysis shows CAPE minima in these areas along with high CIN. Furthermore the all-sky LAP CAPE does not seem to capture the extent of the stable capped region in NE MN where storms have struggled in so far today.
2030Z LAP all-sky CAPE:
2000Z MLCAPE Mesoanlysis:
Furthermore visible satellite shows little cu development in the regions of suggested highest instability in NW & SE MN, with minimal GOES CI probabilities as well. 
2030 Visible Satellite/CI probablities:
Gridded NUCAPS 500-700 mb lapse rates match up quite well with mesoanalysis with rather marginal values of 6-6.5 C/km across most of MN. However, NUCAPS does not appear to pick up on the EML moving up from SD up into SW MN where mesoanalysis as well as the HRRR/GFS/NAM all suggest values greater than 7 C/km.
NUCAPS/HRRR/GFS/NAM 500-700 mb lapse rates:
 Overall, the thermodynamic environment does not have me too concerned about widespread severe weather today. Effective bulk shear values of 30-40 kts suggests some organization is possible & it will be interesting to see if the current cells eventually merge into a line as the HRRR suggests, and create more of a damaging wind threat. Some cells have spiked up at times this afternoon with ProbHail & ProbWind values over 80% but otherwise have not been able to maintain this intensity.

Peter Sunday

Wednesday, May 23, 2018

UNR - Unfortunate data gaps on corrected NUCAPS

2040Z: Earlier we looked at the unmodified NUCAPS soundsings across SW SD & the sfc temperatures were 10+ degrees off from nearby surface obs, so I was excited to check out the modified soundings. Unfortunately... due to a processing error there were no corrected soundings available for SW SD which is the part of the CWA I'm focused on for severe weather. I was able to plot gridded NUCAPS data for 700-500 mb lapse rates but it looks like it's using the non-corrected soundings because the lapse rates look too low (7-7.5 C/km vs 8-8.5 C/km on Mesoanalysis). Obviously a one time data glitch but this would be unfortunate if it occurred during a high-end severe weather outbreak.
NUCAPS Sounding Gaps:

Tuesday, May 22, 2018

MAF - Comparison of low-latency & modified NUCAPS soundings

2200Z: While waiting on convection to develop I decided to do a comparison of the low-latency NUCAPS sounding & the slower but boundary layer corrected NUCAPS sounding. I looked at a "green" sounding point just south of KMAF at the 1932Z NOAA-20 pass. For ground truth, the 19Z observation at KMAF was 82 T/58 Td.
SPC mesoanlysis values at 19Z were:
SBCAPE: 1500-2000 J/kg
MLCAPE: 1500-2000 J/kg
MUCAPE: Slightly less than 2000 J/kg

SFC-3 km Lapse rates: 8 C/km
500-700 mb lapse rates: ~6.5 C/km

The low-latency, uncorrected, NUCAPS sounding was much too cool at the surface with a satellite derived surface observation of 76 T/60 Td. However CAPE values were still in line with the SPC mesoanlysis, potentially because the mid-level lapse rates were likely too steep on the NUCAPS soundings

SBCAPE: 1768 J/kg
MLCAPE: 2036 J/kg
MUCAPE: 1680 J/kg

Sfc-3 km lapse rate: 7.7 C/km
850-500 mb 7.3 C/km

Unmodified NUCAPS sounding:


The modified NUCAPS sounding was much closer to the ob at KMAF with a NUCAPS derived sfc ob of 82 T/ 58 Td. CAPE values & lapse rate values were also closer to SPC mesoanlysis which is what you would hope for.

SBCAPE: 1841 J/kg
MLCAPE: 1657 J/kg
MUCAPE: 1841J/kg

SFC-3 km lapse rate: 8.8 C/km
850-500 mb: 7.9 C/km
700-500 mb: 6.6 C/km

Modified NUCAPS sounding:

I still continue to place much more confidence in the modified soundings vs the low-latency unmodified ones. The soundings performed much better today vs yesterday compared to mesoanalysis values (which of course are not ground truth by any means but are about as close as we can get with traditional products). Personally, I would not anticipate myself using the low-latency soundings much knowing that the more accurate modified NUCAPS soundings are only an hour or two away. However I find a great deal of value in both the corrected NUCAPS point soundings & gridded fields in analyizng the early afternoon environment.

Peter Sunday

MAF - Gridded NUCAPS comparisons

2045Z: With the first echoes appearing over the Davis Mountains, I was able to look at gridded NUCAPS to determine the state of the atmosphere. I was most interested in looking at the mid-level lapse rate fields, especially if they were steeper than  my initial analysis earlier this afternoon.

NUCAPS 700-500 mb lapse rates were generally around 6.5-7 C/km over SE NM & W TX. Comparing these lapse rates to the HRRR, GFS, & NAM40 the NUCAPS were the least steep with the GFS & NAM40 especially forecasting 700-500 mb lapse rate values of 7-7.5 C/km. In this case NUCAPS actually compared the best to SPC mesoanalysis values which are what I usually look at in a warning operation environment. This helped add to my confidence in the overall evolution of the event & widespread severe weather still looks unlikely.
NUCAPS 700-500 mb lapse rates 4panel:


Earlier this afternoon I was looking at the gridded NUCAPS fields with the data blacked out in areas with bad NUCAPS soundings. It was difficult to piece together spatial trends & gradients with all of the data blackouts & I did not find these fields very useful. As of this blog post we now have the NUCAPS gridded fields with continuous data & the blacked out areas now filled in. While this data may not be as "realistic" it is much easier to spatially analyze the data & use the product in an operational sense. I would highly recommend preesenting the data this way in an operational setting.
NUCAPS Spatially Continuous Data:
Peter Sunday