Tuesday, June 13, 2023

Day 2 Review of Products & Operational Applications

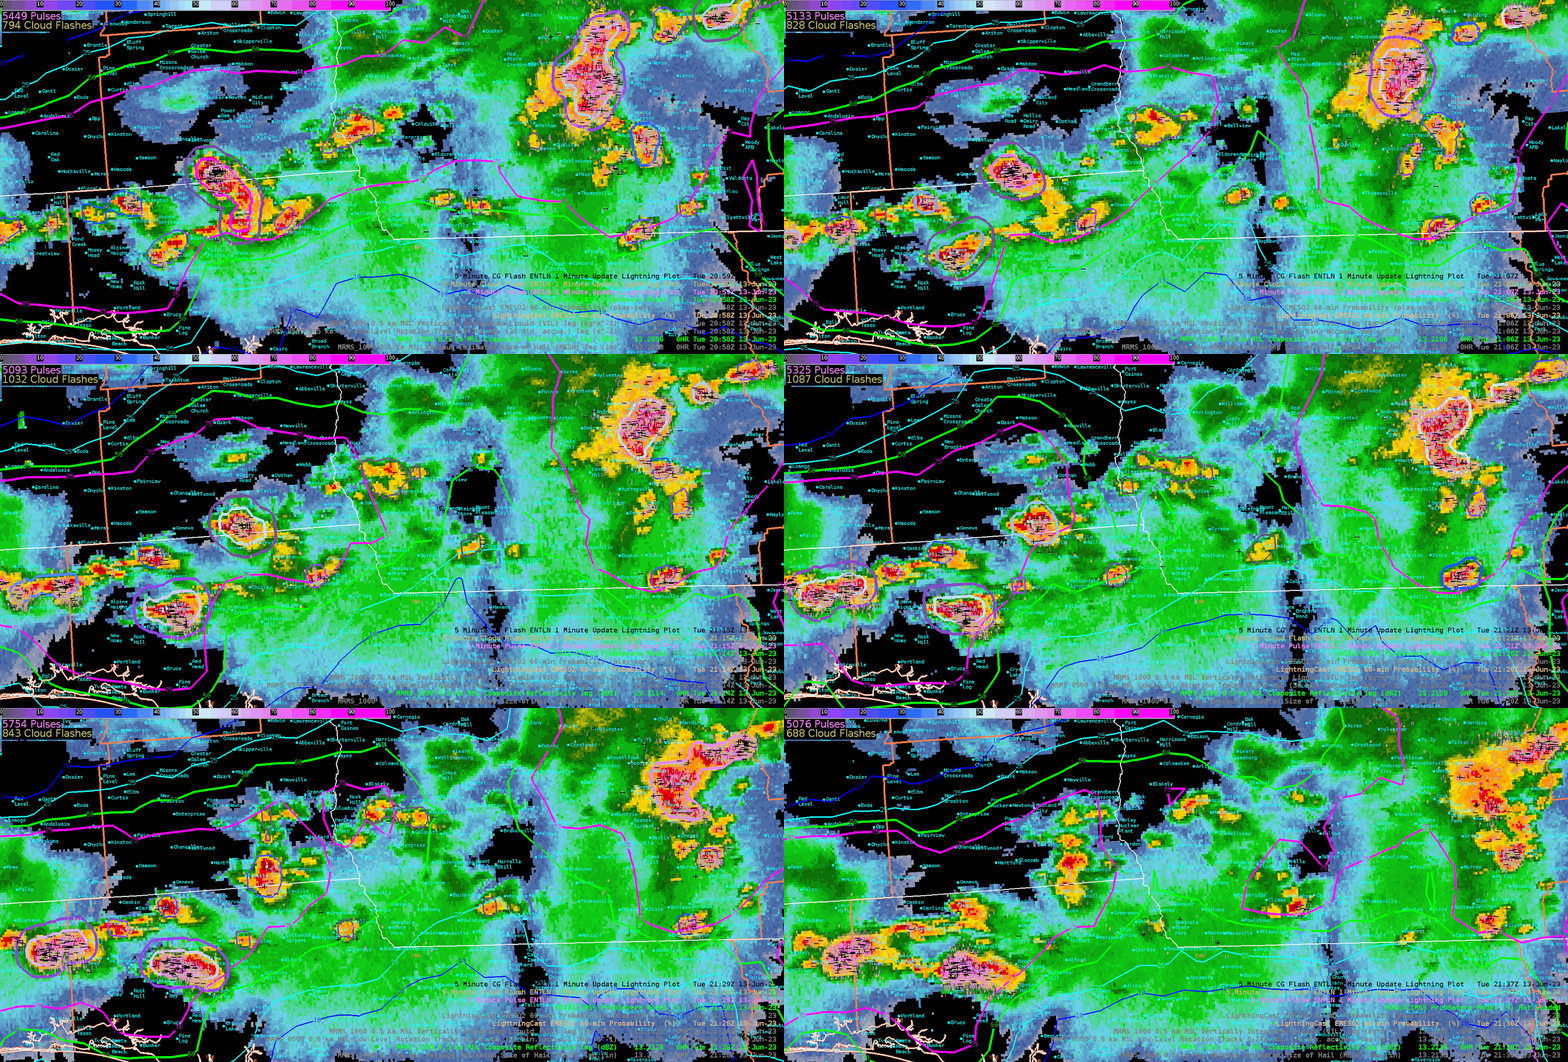
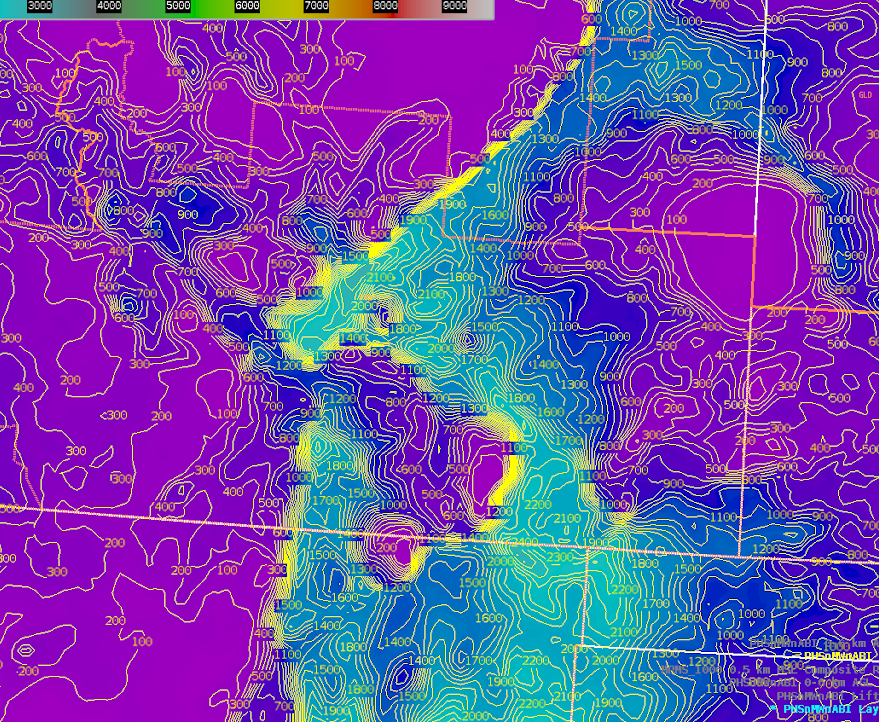
 I took on the DSS role during today’s operational period. There were no afternoon NUCAPS-Forecast runs and the morning runs provided minimal coverage over the AMA CWA. So, I opted for PHS data today (namely SBCAPE) with MRMS 0.5 km Composite Reflectivity and ProbSevere overlaid (Figure 1) to diagnose the environment. Much of AMA was socked in by stratocumulus at the start of the operational period, but severe storms just to the west posed a concern as they tracked eastward into a gradually destabilizing environment.
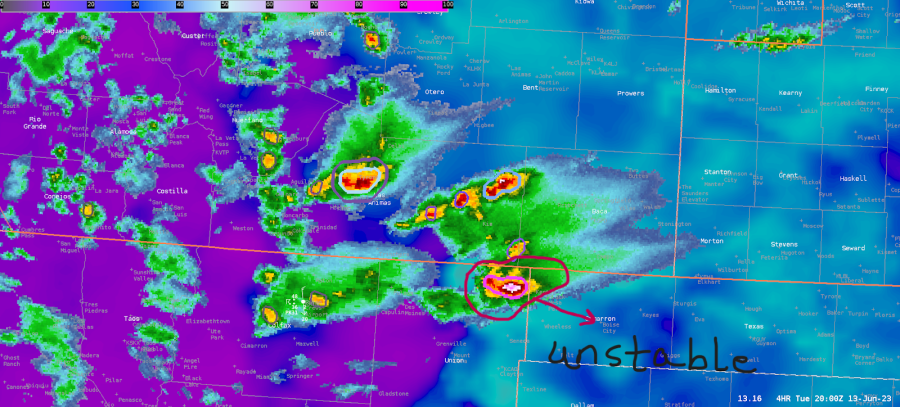
Figure 1

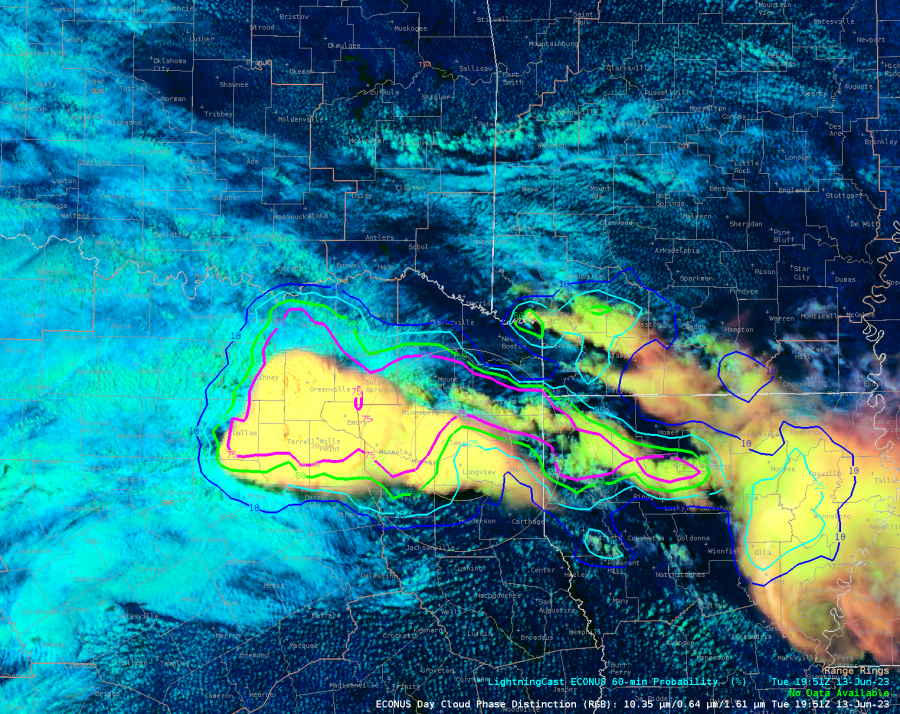
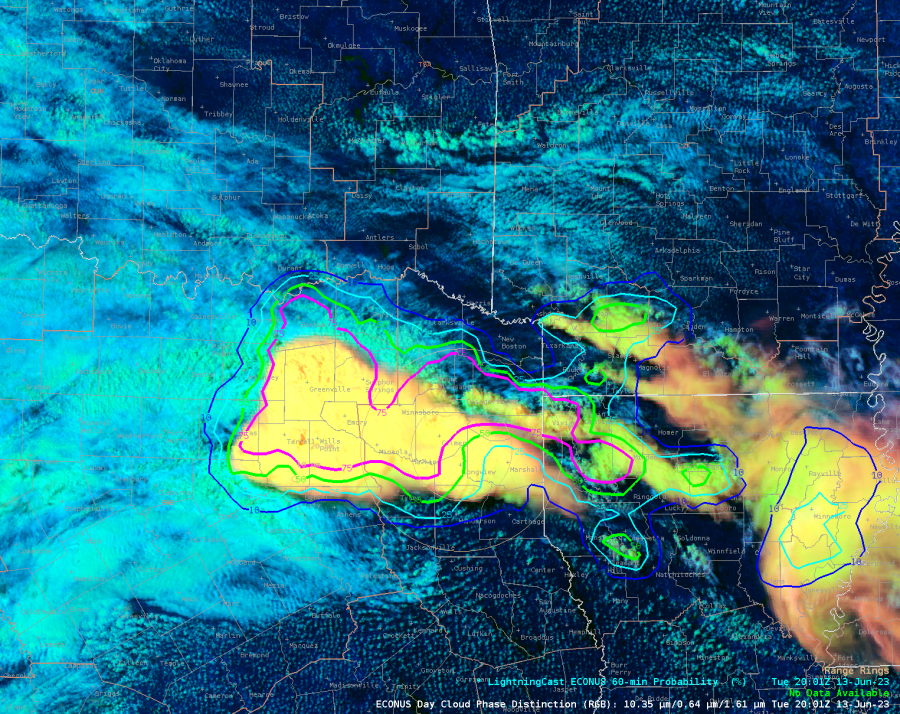
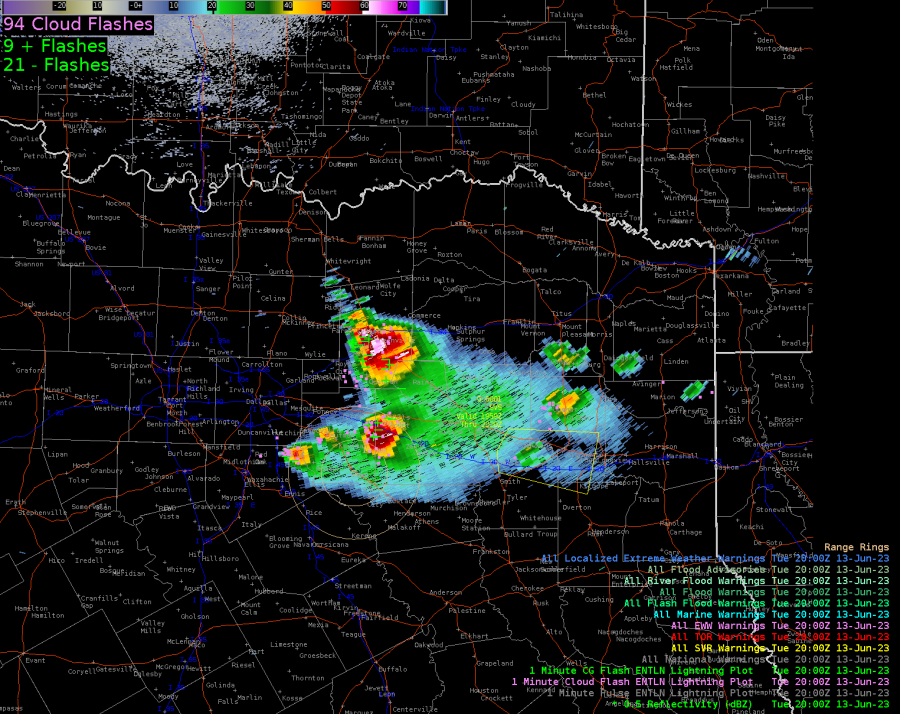
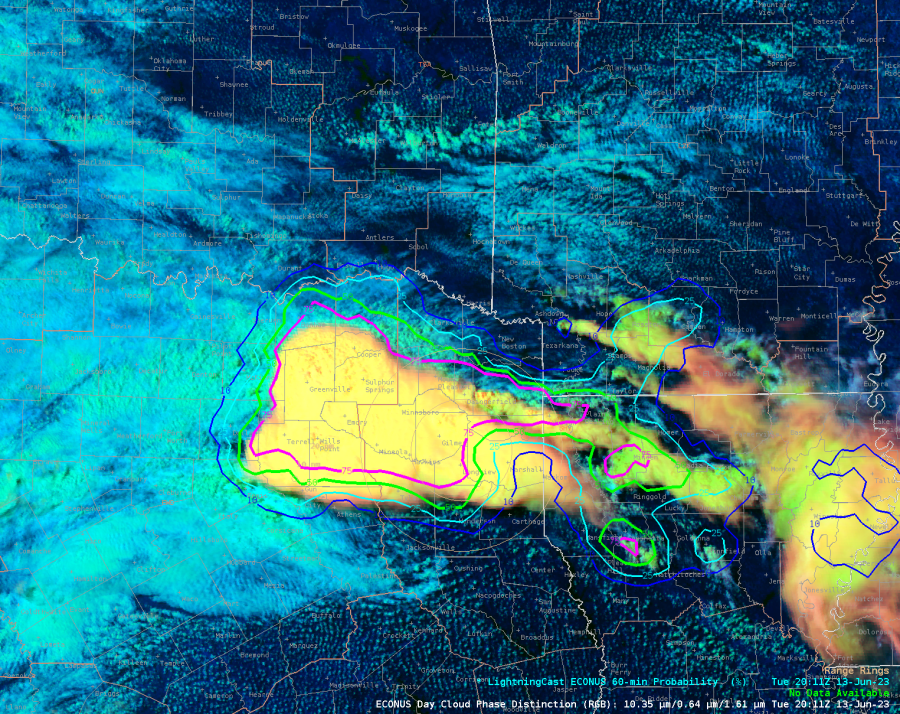
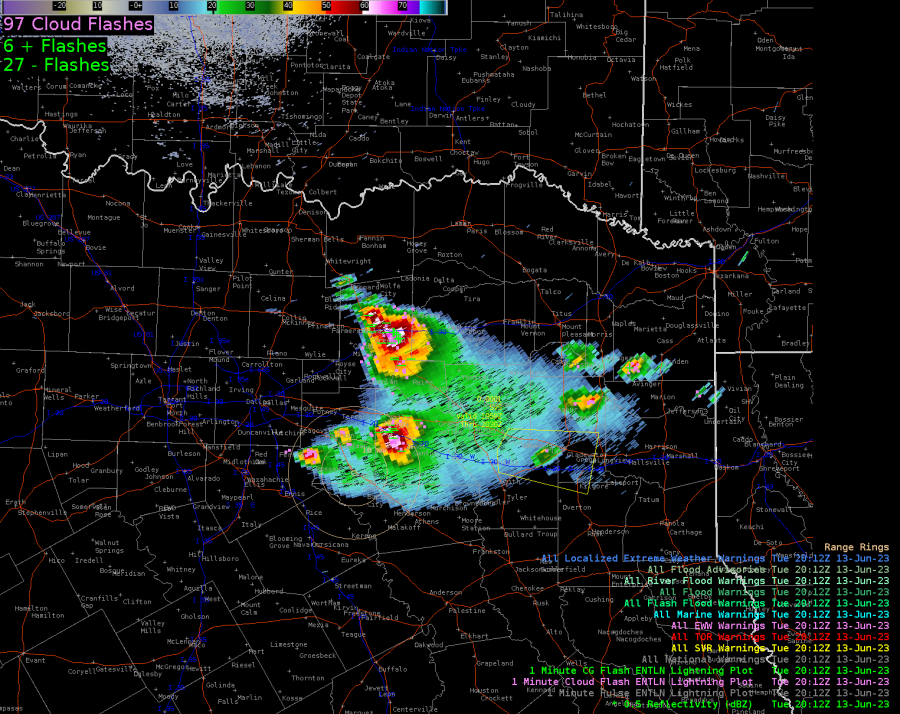
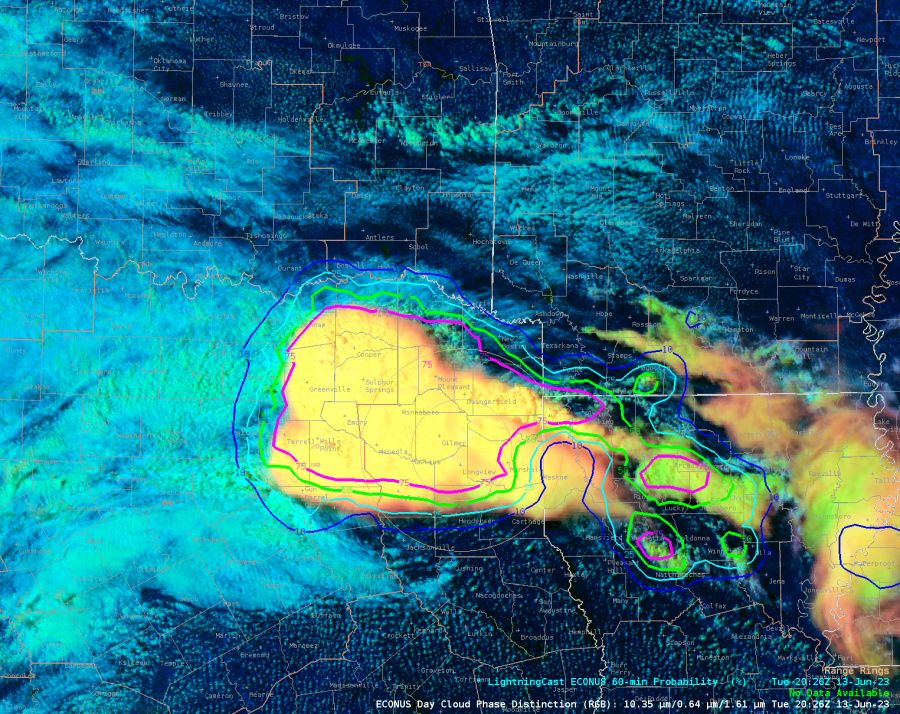
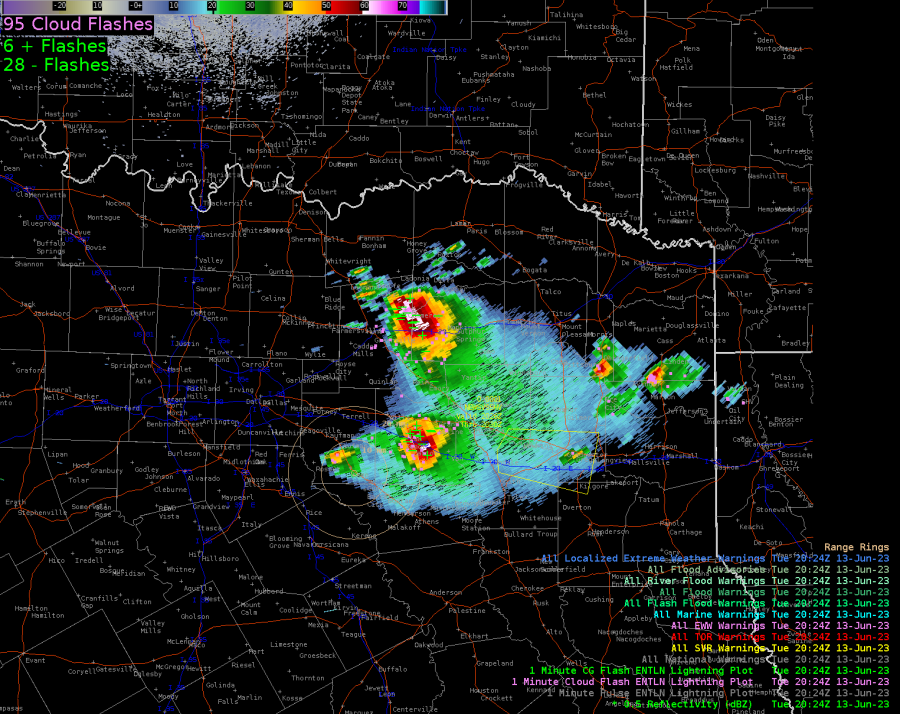
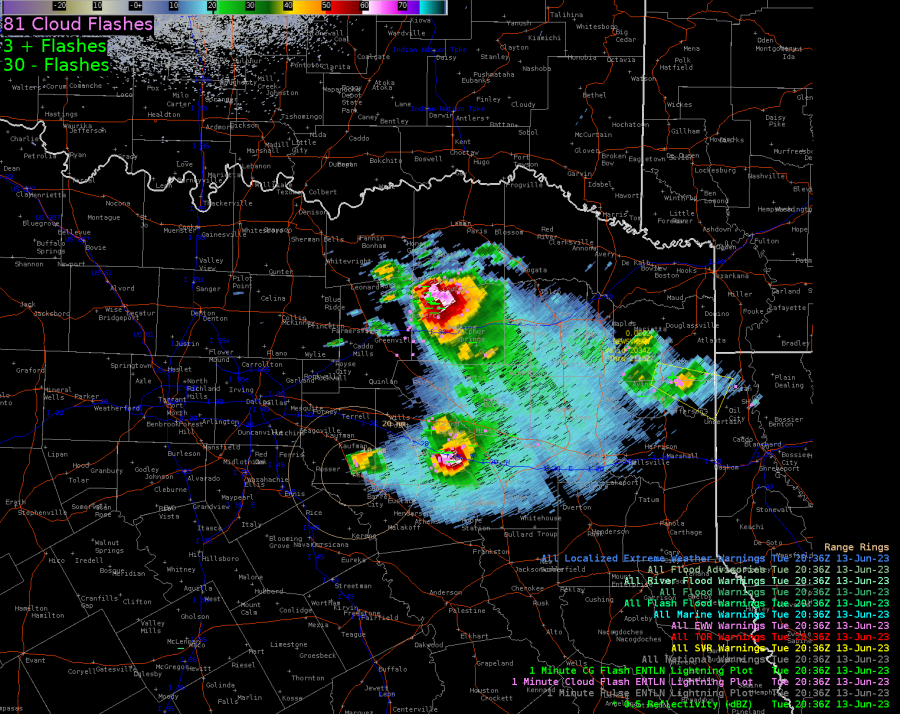
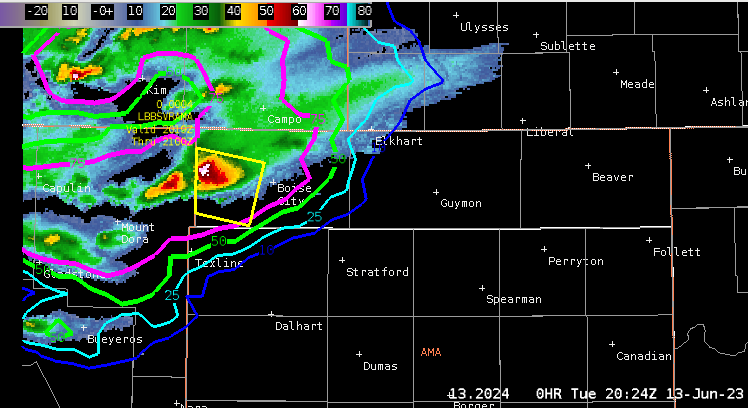
The assigned DSS event was a hypothetical RC plane show at Texoma Municipal Airport (denoted by a yellow star in Figure 2). I was instructed to alert the hypothetical POC for the event when either of the following hazards were expected within 20 minutes: winds or gusts of 15 kts at the airport OR lightning within 10 miles. I used LightningCast probability contours along with ENI 5-minute pulse lightning plots (reddish orange tick marks) to monitor the proximity of lightning to the event range ring (Figure 2). I issued a DSS update with “lightning likely” wording after the LightningCast meteogram depicted a steadily increasing likelihood of lightning at the airport within an hour (Figure 3).
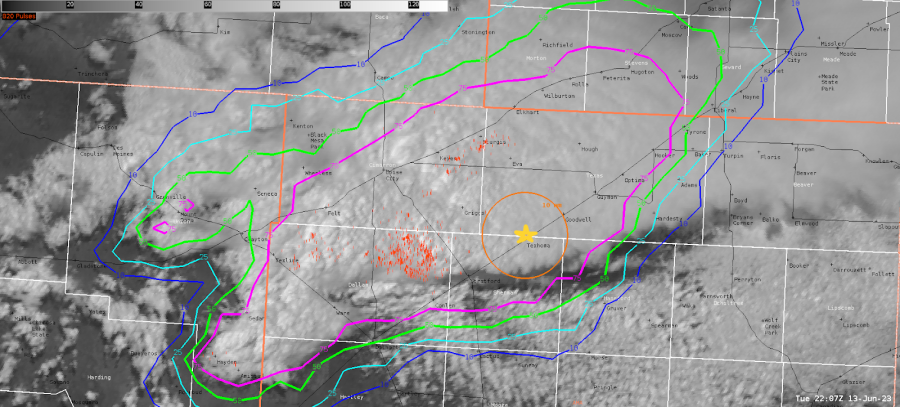
Figure 2
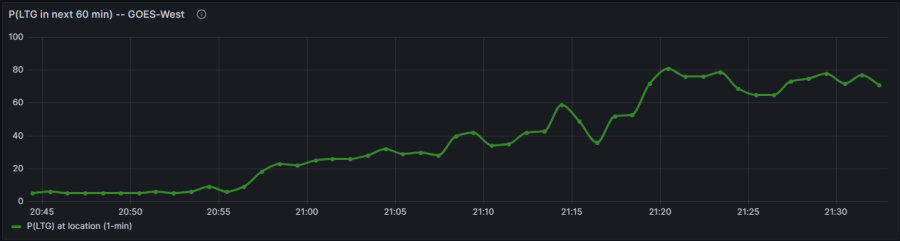
Figure 3

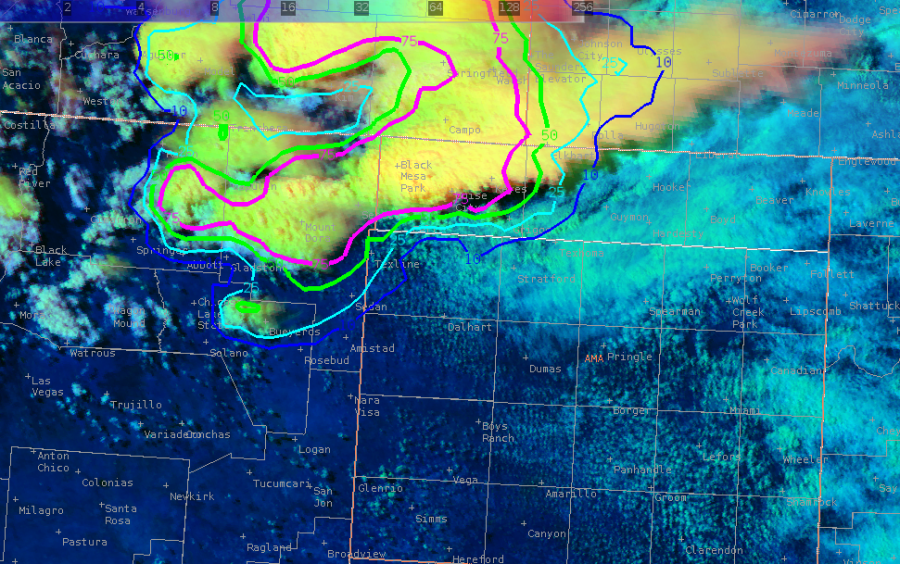
A LightningCast observation: the footprint of the 75% probability contour was much larger than the actual area in which lightning strikes occurred (at least according to ENI 5-minute pulse lightning) mainly in the anvil region. That said, GLM Flash Extent Density did indicate low-value pixels in the anvil region, so perhaps I missed some anvil lightning strikes by looking at just ENI 5-minute pulse lightning.

- Vort Max  
PHS Blog Post AMA 6/13

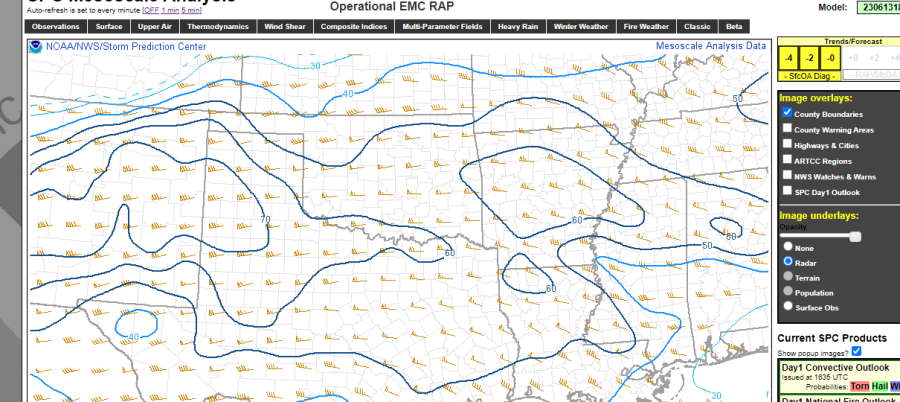
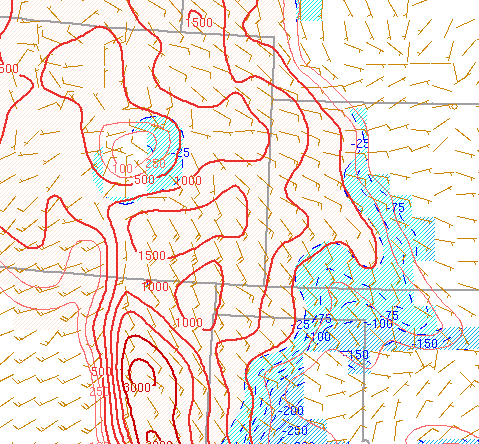
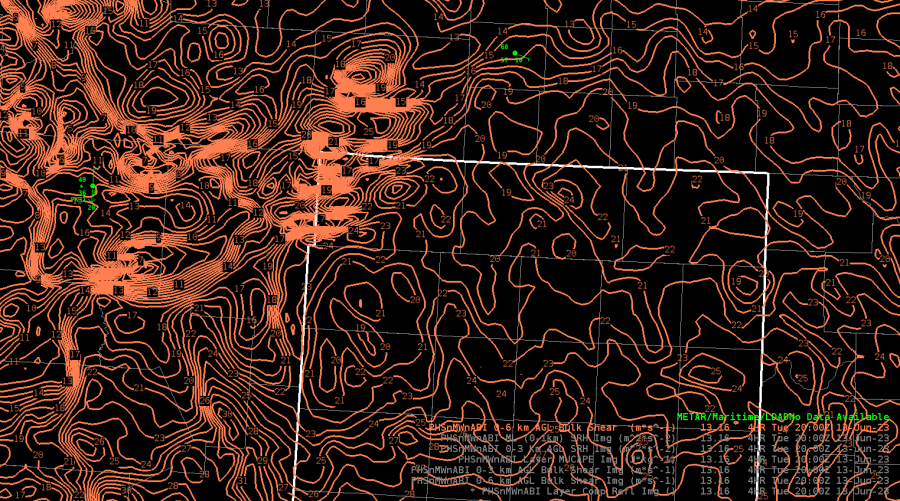
 PHS today was interesting given some of the local convective parameters. The main one that caught my attention was the lesser 0-6km bulk shear that it was giving just ahead of an incoming storm in the Oklahoma Panhandle. The PHS was around 20-30 knots whereas other guidance and SPC Mesoanalysis was showing 50+ knots. I did look at other parameters such as MUCAPE and SBCAPE for example and they were in the ballpark of other guidance including SPC Mesoanalysis.  If the PHS was correct then the storm mode would feature more multicell with some organization vs more of a discrete supercell mode so it was going to be interesting to see what would occur. 

What wound up occurring was a persistent long track supercell along with other convection which was anticipated given the PHS wind shear.  Overall, I was impressed with the PHS wind shear forecast as that tailored away any thinking that there may be additional supercells as additional updrafts would interfere with the intensification of other cells. The PHS however was around 1-2 hours slow with convection moving into the AMA CWA, however the composite reflectivity forecast did show more of a cluster of storms developing. The PHS was also showing a corridor of stronger 0-3 and 0-1 SRH which in reality the intense cell did move through and actually wound up producing a few tornadoes. The ProbTor was also showing tornado potential as high as 40% as it was moving through this corridor.  Overall, I was impressed with the PHS today and think that it could create good DSS messaging opportunities along with being skillful in Mesoanalysis.

PHS showing the lesser values of 0-6 bulk shear in contoured form

SPC Mesoanalysis depicting the 0-6km bulk shear at the same time

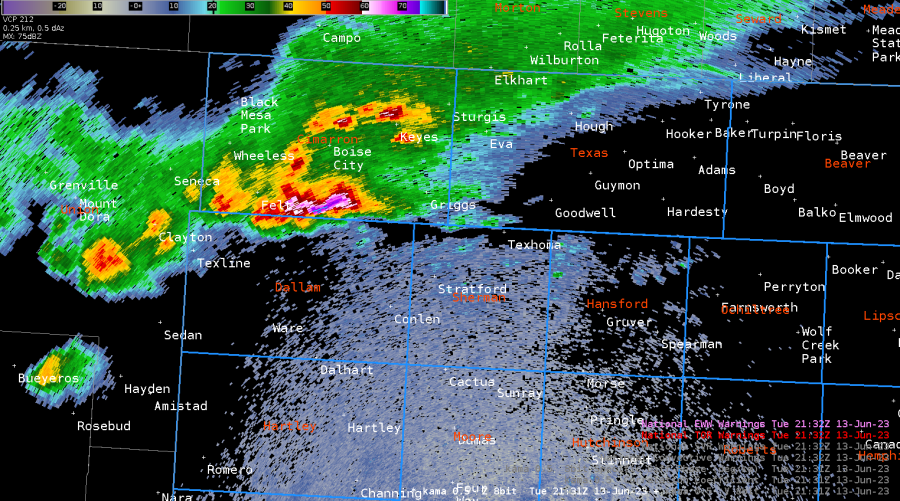
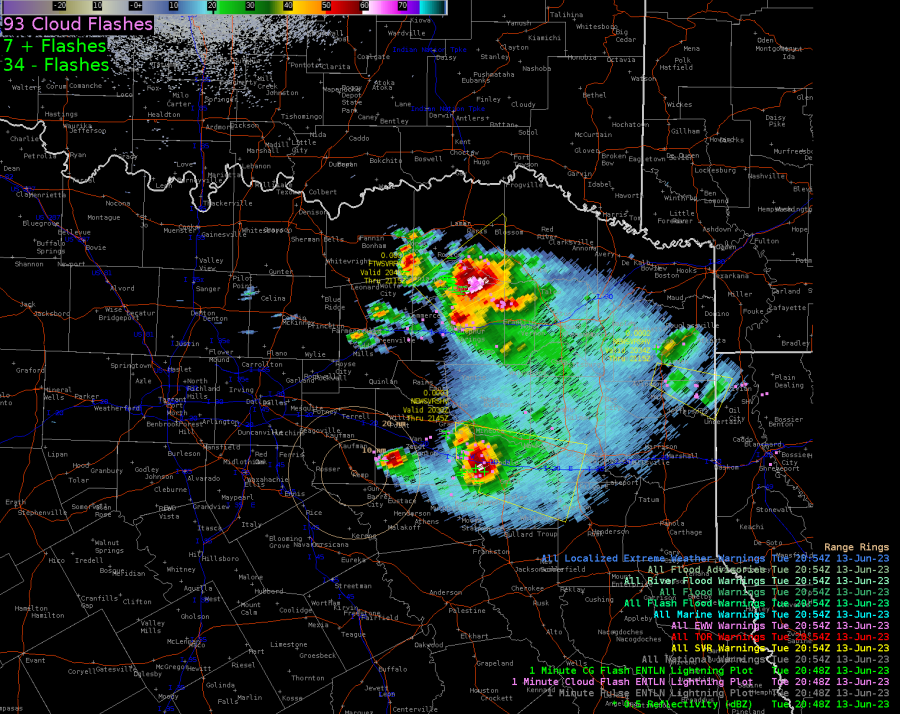
How the radar wound up turning out at 2130Z with the multiple cells

- Tor Nader  

LtgCast Precursor to Storms Diverging

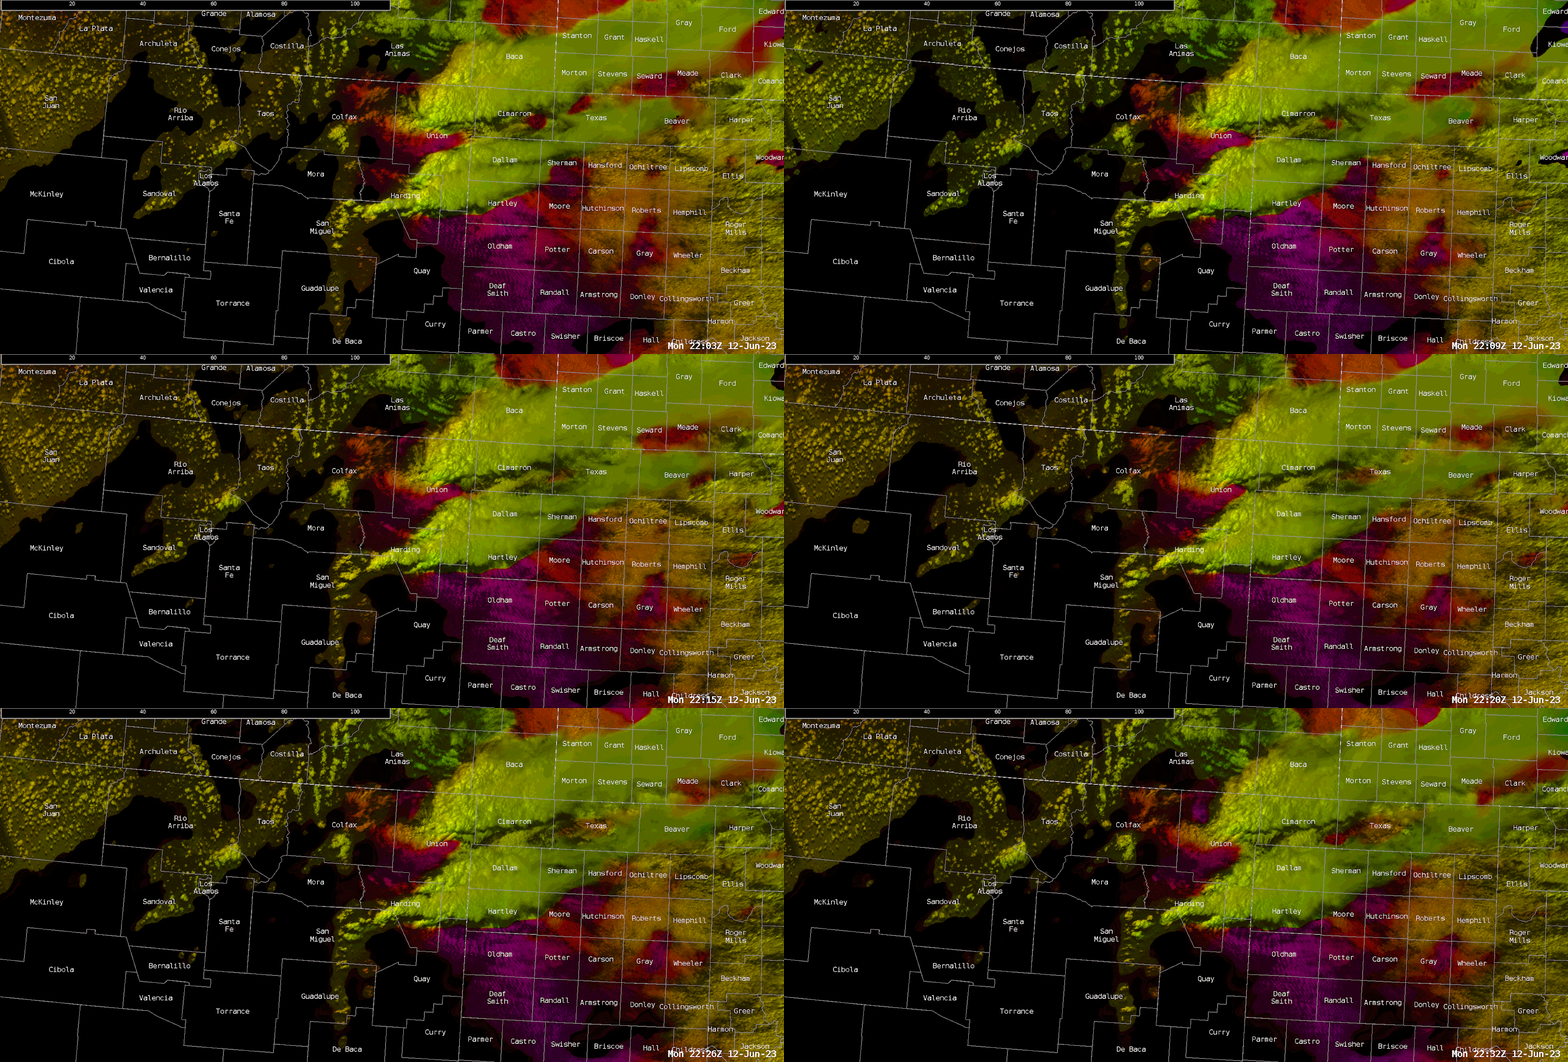
 LtgCast gave advanced indication (about an hour) in the FWD region that the northern storms were diverging to the north away from the original track that was more easterly. Below you can see the LtgCast extending to the north into clear skies in the first two images. The next four pairs of images are the LtgCast paired with the radar at about the same time. The last two images are the next 20 minutes of radar.

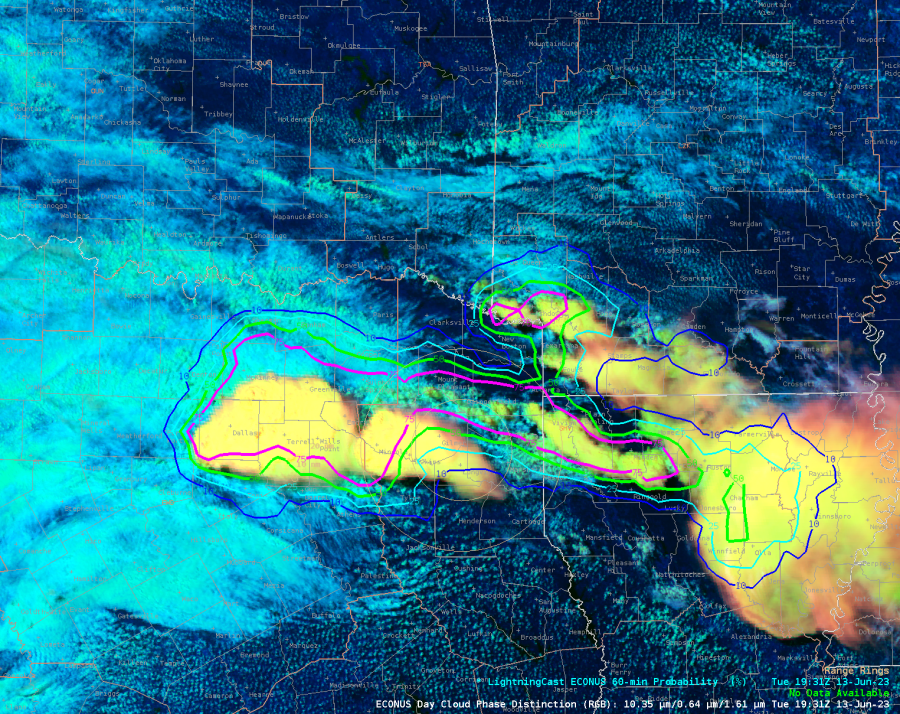
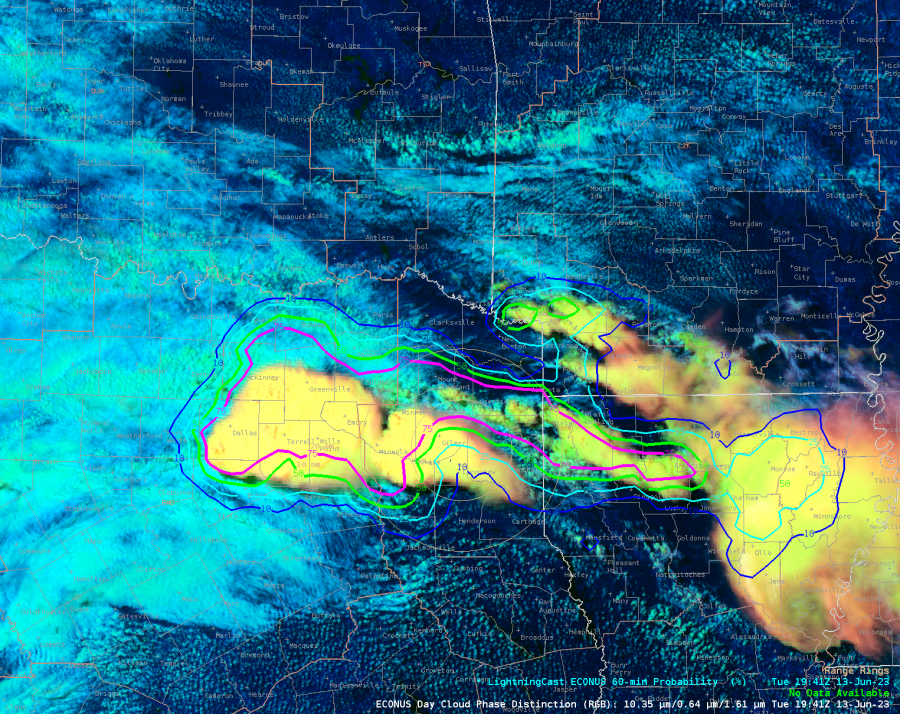
In the TAE area, the LtgCast wasn’t as effective. Behind the storms, LtgCast kept >75% probs for lightning in clear air as seen in satellite imagery, possibly as much as 50 miles or more. This was odd in that it usually quick to pull in the probs behind the storms. It wasn’t that the storms were slow moving or inconsistent in their motions; they were moving uniformly to the southeast at a constant rate (didn’t measure the speed, but would estimate the line speed 20 kts or more).

- Super Bolt

Strong to Severe Thunderstorms This Evening

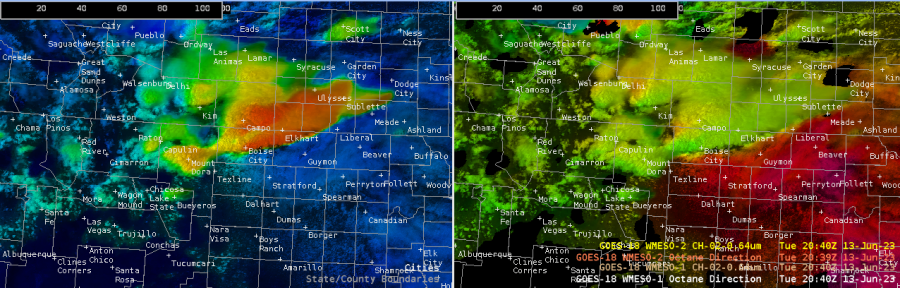
 Based on the latest satellite and radar data, a supercell thunderstorm has moved into the very northwestern corner of our cwa (northwest of Boise City). A Severe Thunderstorm Warning has been issued for the Boise City area with the greatest threat being large hail, damaging winds, and maybe an isolated tornado. Echo (cloud) tops are ranging between 40-50 kft. LightningCast data is showing lightning activity increasing over that area as CAPE values have increased to 2,000 J/kg.Based off the OCTANE Motion and Speed Sandwich product, storm top divergence is evident near Boise City with the tight color gradient with winds to the north of Boise City at 234 degrees vs 188 degrees south of Boise City. This activity is being driven by a surface low near the TX/OK state line. As this feature continues to shift to the east-northeast there is the potential for this storm to strengthen and/or for additional showers and thunderstorms to develop across the area.

-SATGLM_84

Assessing LightningCast in Ongoing Convection

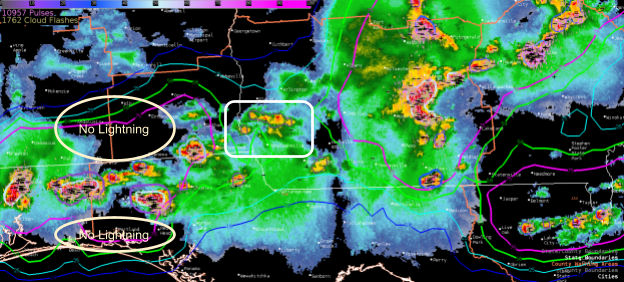
 In the Tallahassee CWA, convection was ongoing at about 21z over the western portions of the Florida Panhandle.  In order to get a quick assessment of the convective trends, loading up LightningCast with ProbSevere and MRMS radar is a good start. A loop is provided in Figure 1 below. 

Figure 1: Loop of MRMS reflectivity overlaid with LightningCast and ProbSevere. 

I noticed in southeast Alabama into southwest Georgia that LightningCast was teetering back and forth between the 50 and 75 percentile contours.  LightningCast even went down to the 25% contour for a brief stint at 2041z.  Looking at NLTN data, there was certainly plenty of lightning left within that storm, so I couldn’t quite understand why it went down but then pulsed back up. The other issue I ran into is the contours suggesting lightning, but convection is nowhere near the 75% contour (See Figure 2). 

Figure 2: 2041z LightningCast with ProbSevere and NTLN lightning. 

-Podium 

Storms surging in northeast Texas

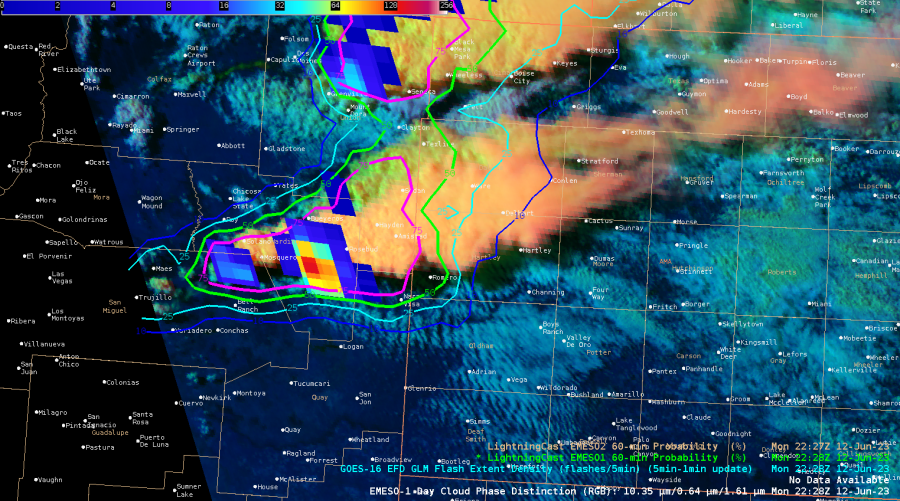
As we begin today's HWT shift, storms are already developing quickly. ProbSevere LightningCast was able to readily give objective probabilistic guidance on the next-hour probability of lightning for these storms, which developed under clear skies.


Figure 1: LightningCast probabilities (contours), GOES-16 ABI daytime cloud phase distinction RGB (background), and GOES-16 GLM flash-extent density (orange-foreground). 


The Dallas / Fort Worth metro is seeing severe hail from these rapidly developing storms. The GOES-R satellite growth rates are contributing to high probabilities of severe for both ProbSevere v2 and v3 (huge CAPE and effective shear doesn't hurt, either). 

Figure 2: ProbSevere v3 contours, MRMS MergedReflectivity, and NWS severe weather warnings for storms near the Dallas / Fort Worth metro.


Monday, June 12, 2023

6/12 Observations from ABQ CWA

 OCTANE

Have knots abbreviated as “KTS” instead of “KN”

Change direction of movement from to lettered degrees instead of a numerical value

This product does help me become more aware, in realtime of the winds vertically.  However, not entirely sure how to adapt this into my forecasting routine yet.

NUCAPS

Great to see the better sampling/readout of the data compared to what it was 2-3 years ago

The parcel count is a great way to help me gauge the validity of the data (confidence in how accurate it is)

Overlaying a NUCAPS forecast field with the parcel count allows me to sample what the field has and what the parcel count is so I can have more of less confidence in the data

No less than six hours for operational needs.  9 hours might be the perfect duration.  I usually don’t use hourly data much beyond 9 hours due to my lack of confidence in the reliability of the data.

Hourly data is very nice.  Half hour spacing is a bit too much data for that duration.
-Something to consider is could there be half hour spacing in the data for the first three hours?  However I don’t know if that would be enough of a benefit to use.

I would use the 700-500mb lapse rates, ML CAPE, temp and dew point, and parcel count most often.

PHS

Very easy to look at; very smooth data

Didn’t have much time to look at the data

Lightningcast

Noticed on a well defined supercell the lightning probability is not over 80% despite lightning ongoing.  Does the program cap at 75-80%?
-Have GLM ligthning data displayed too

Otherwise this does help draw my eye to where lightning could occur in the near future.

Prob Severe

Didn’t have time to look at it much. Did notice the storm in eastern CWA had higher values for version 3 than for version 2

- Rainman

Day 1 Review of Products & Operational Applications

 OCTANE-Direction

  • Distinguish different air masses when they are characterized by different advection regimes
    • Stable cloud streets in magenta (Figure 1)
    • Agitated Cu and deep, moist convection in yellow/green (Figure 1)
  • Locate boundaries
    • Identify areas of convergence based on the depicted flow directions
  • Suggestion: it would be great to be able to sample the cardinal direction (i.e. NW, SE) in AWIPS in addition to the direction already given in degrees

Figure 1

NUCAPS & PHS

  • Attempts at convective initiation failed over Guadalupe County and De Baca County… but why? Isobaric analysis revealed supportive dynamics for ascent south of the already-occurring convection.
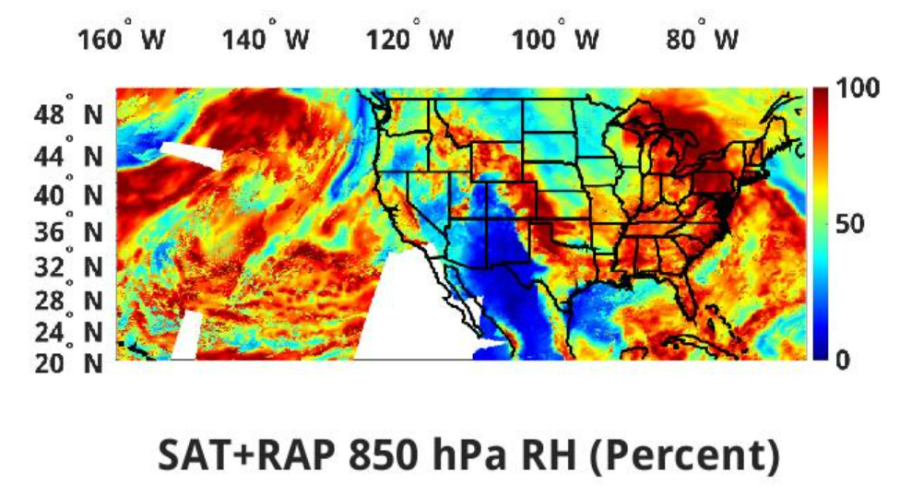
    • 700 mb relative humidity and 850 mb humidity data (Figure 2) reveal a sharp moisture gradient across northeastern New Mexico
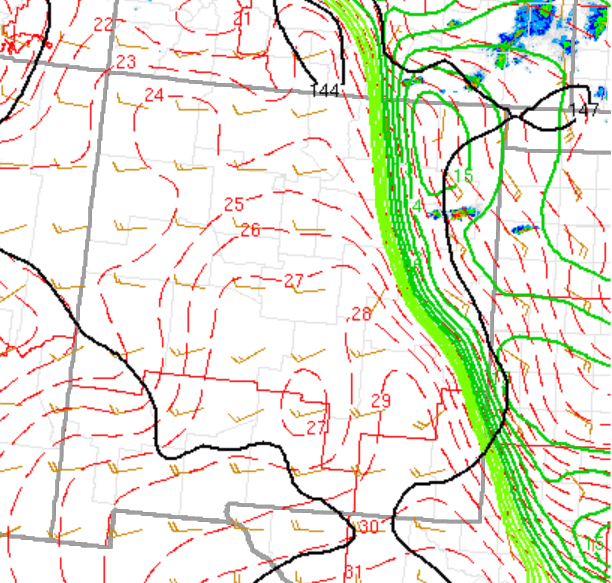
      • SPC 850 mb Td mesoanalysis verifies this (Figure 3)
    • Dry air was already moving across both counties from the west and was progged to continue over the next few hours, thus hindering convective initiation

Figure 2

Figure 3

- Vort Max

Comparing PHS Data with SPC Mesoscale Analysis and MRMS Data

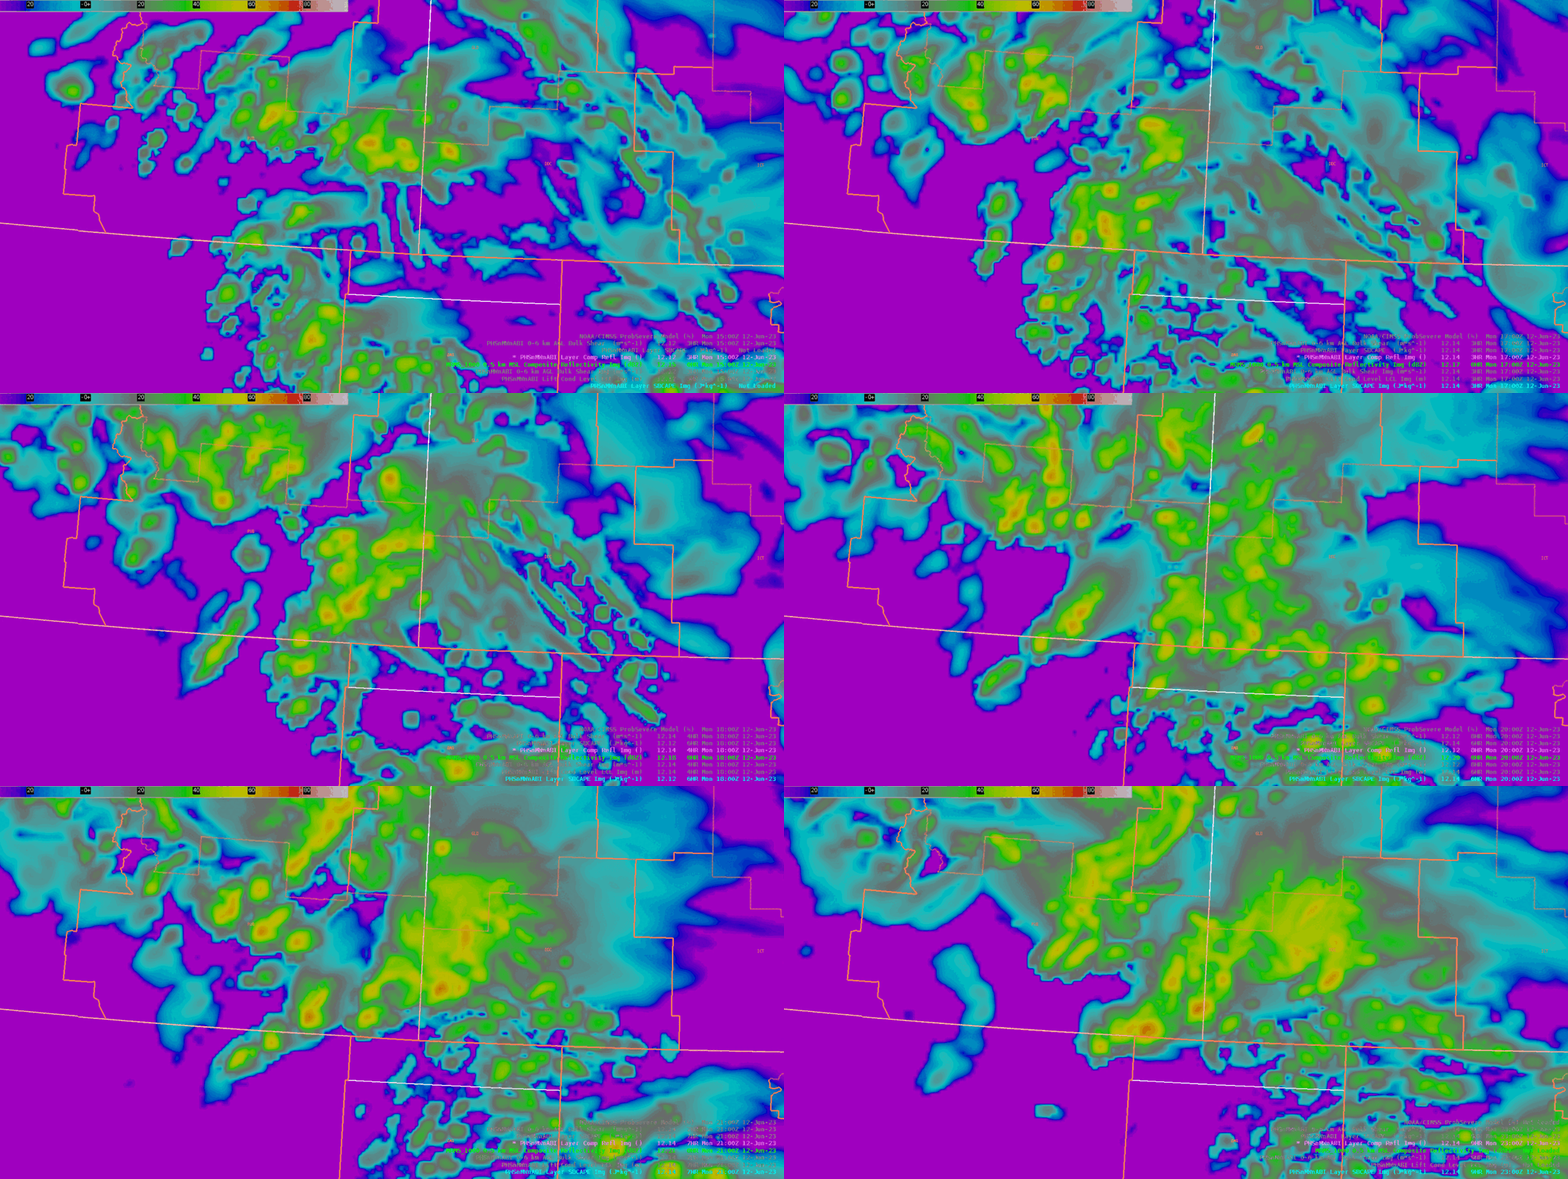
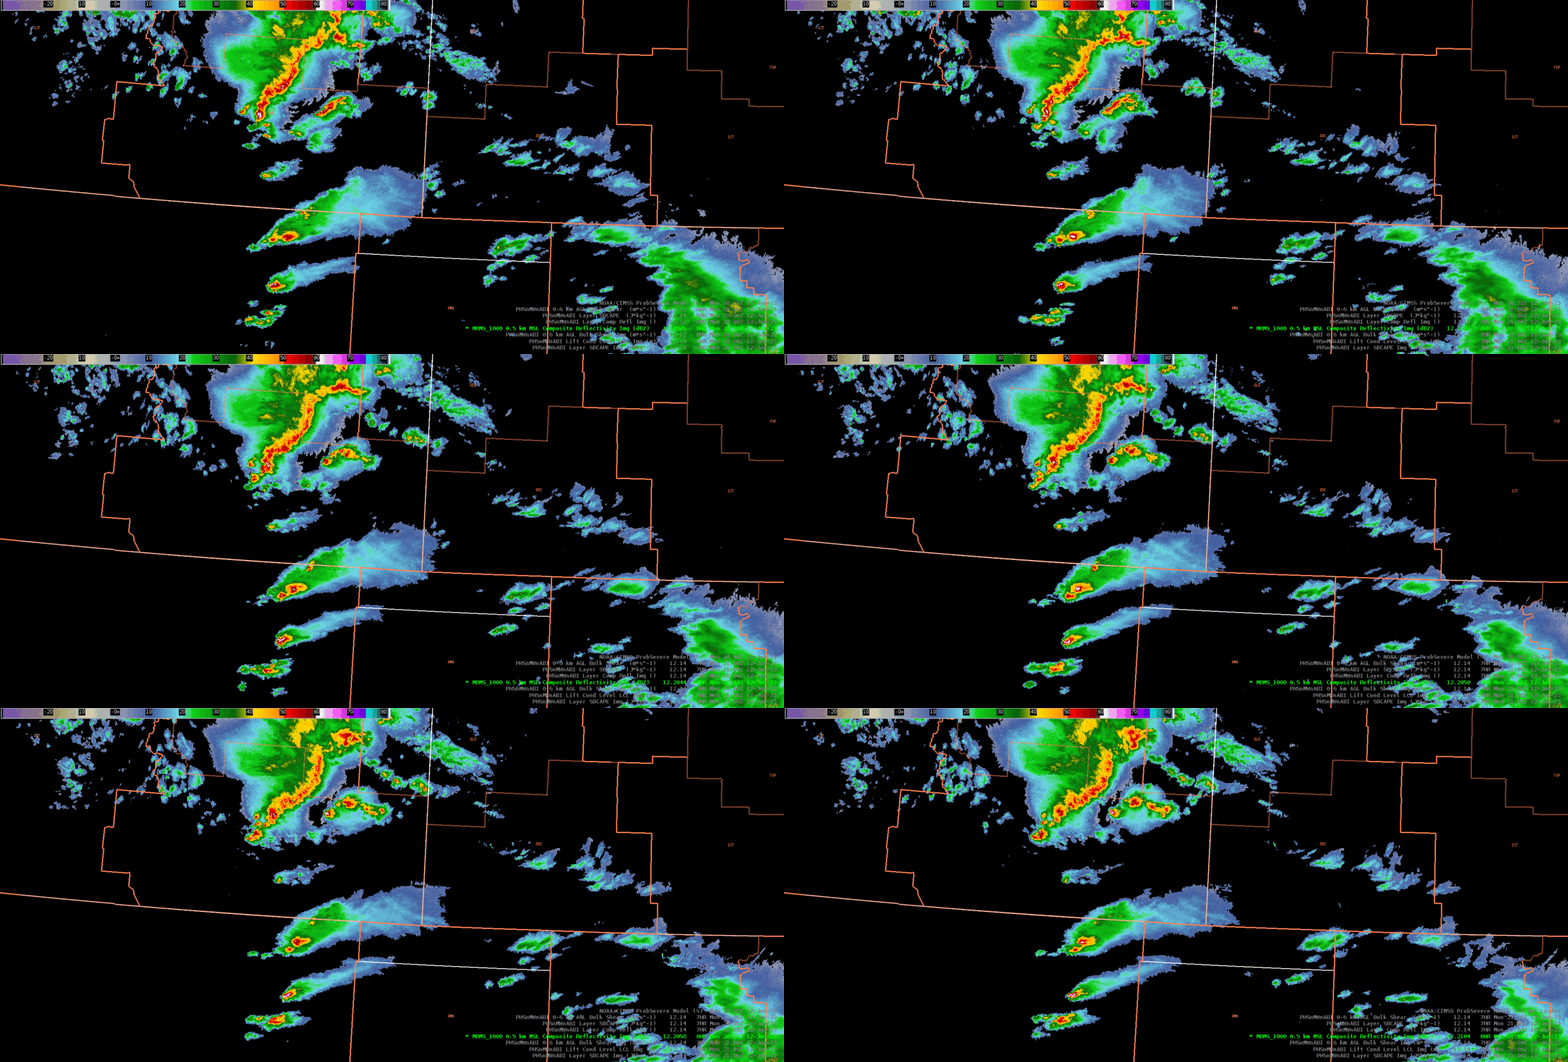
 The first day was slightly overwhelming with all the different products to test out this week. I decided to focus on one of the products I was unfamiliar with and that was PHS data. I compared PHS SBCAPE/MUCAPE values from the 12.14z model run to the latest SPC Mesoscale Analysis data. At first glance, the PHS SBCAPE/MUCAPE values depicted were generally higher over southern Colorado and northern New Mexico than the SPC data. However, I did notice a small bullseye of CAPE minimums in south-central Colorado and was curious about why that was depicted (See Figure 1). The SPC data was not as detailed with the gradients and had no mention of the minimum in south-central Colorado (See Figure 2). Thankfully, one of the developers was in the room and mentioned that the model might be depicting storms in that location. I loaded up the composite reflectivity from PHS (See Figure 3) and sure enough, PHS was suggesting storms in south-central Colorado.

Figure 1: Top image shows PHS SBCAPE at 20z with a minimum in south-central Colorado.

Figure 2: The bottom image is the SPC Mesoscale Analysis at 20z.

The composite reflectivity had the right idea with convection near that location compared to MRMS data. It was slightly further north with the maximum dBz values, but for an 8-9 hour forecast, it depicted the convection fairly well IMO.  The PHS did much better with the convection over the northern portions of PUB CWA as it showed a decent line of storms at 22z which matched up well with MRMS.  For obvious reasons, this model could certainly be helpful in providing higher confidence in convective storms for various NWS partners and DSS events.

Figure 3: top loop showing the PHS layer composite reflectivity.  This is the 12.14z model initialization.

Figure 4: MRMS loop of the composite reflectivity for the hour of 20:00z to 21:00z.

- Podium

Monday 6/12 Initial Post

 Lots of products to look at and test. It’s a daunting task to know if you are looking at everything enough and in the correct way.

Appreciate the interaction with the developers and the openness to questions.

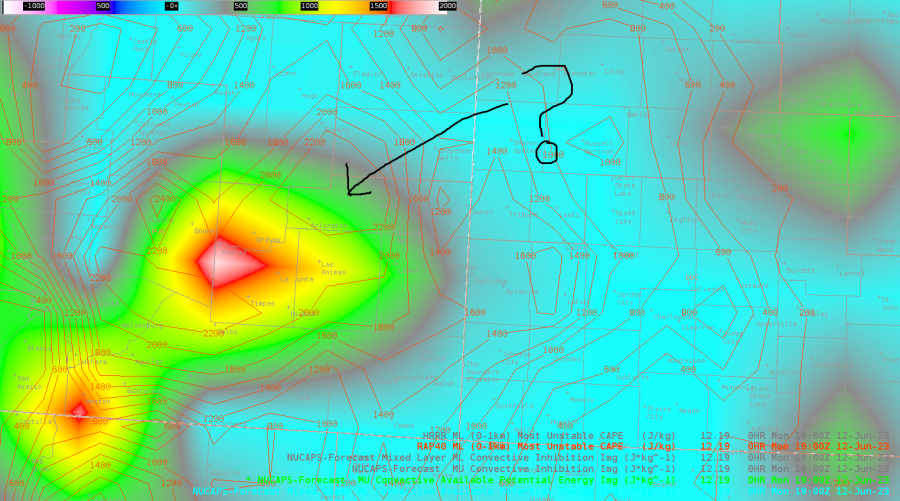
Below is a quick screen capture of the 6/12 19z 0hr NUCAPS MUCAPE (image) with the 19z 0 hour RAP40 MUCAPE contours. The developer mentioned that NUCAPS was good at depicting gradients but in this instance the gradient in the image is more smoothed than the RAP data while also being much less value than the RAP data. This raises questions on which analysis is best? Why? Is that same reasoning valid across the entire domain?

I would like to see observational data used as check point against model initialization. Where could larger errors in the model initialization raise questions about future forecasts. Asking the operational forecaster to quality control initial conditions has been a common ‘task’ assigned to maintaining situational awareness. I would like to see computers help with that task.

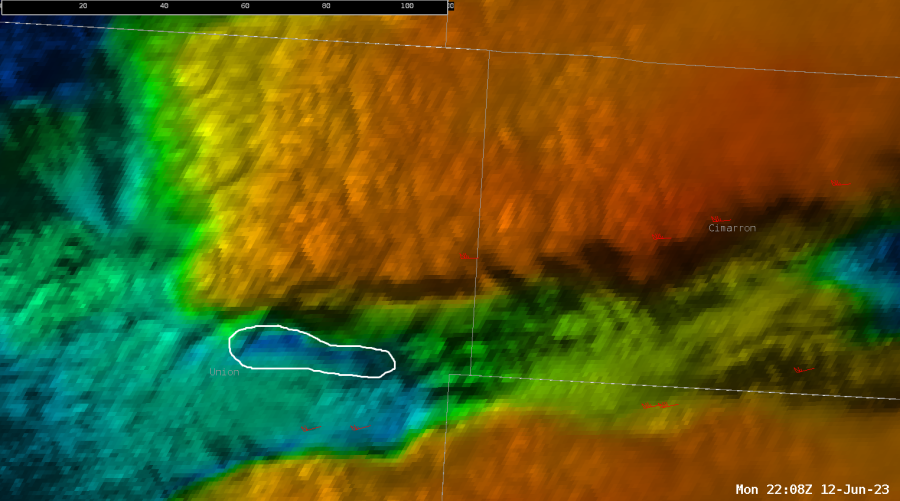
Quick update. Captured this image in the OCTANE data of an ongoing storm (likely supercell) in far NE New Mexico. The narrow corridor of light wind speeds (circled in white) matches my conceptual model of where the forward flank outflow boundary would be located. If this is the correct interpretation I think it would be very useful application in warning operations.

-jbm