Tuesday, June 13, 2023

Assessing LightningCast in Ongoing Convection

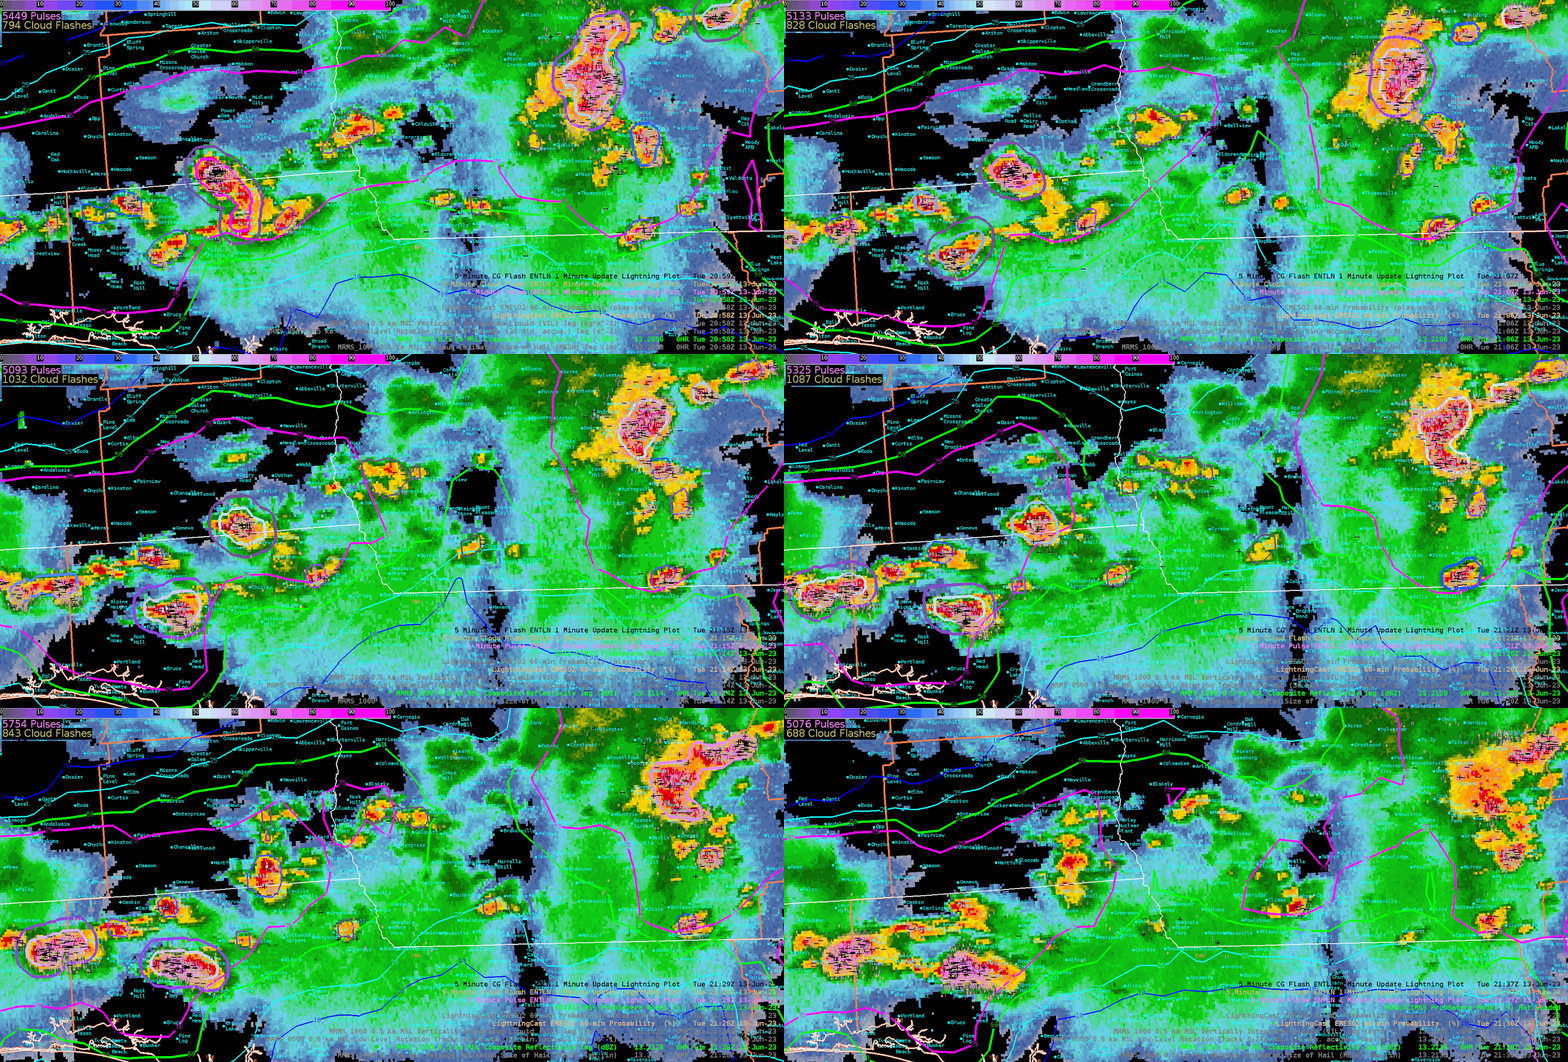
 In the Tallahassee CWA, convection was ongoing at about 21z over the western portions of the Florida Panhandle.  In order to get a quick assessment of the convective trends, loading up LightningCast with ProbSevere and MRMS radar is a good start. A loop is provided in Figure 1 below. 

Figure 1: Loop of MRMS reflectivity overlaid with LightningCast and ProbSevere. 

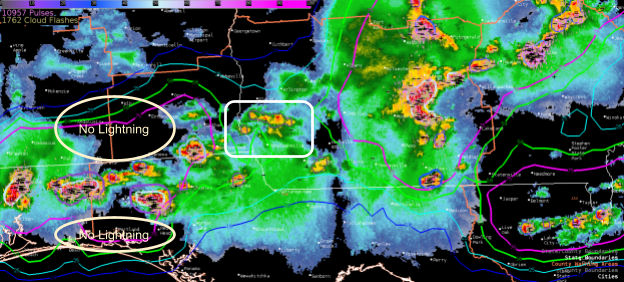
I noticed in southeast Alabama into southwest Georgia that LightningCast was teetering back and forth between the 50 and 75 percentile contours.  LightningCast even went down to the 25% contour for a brief stint at 2041z.  Looking at NLTN data, there was certainly plenty of lightning left within that storm, so I couldn’t quite understand why it went down but then pulsed back up. The other issue I ran into is the contours suggesting lightning, but convection is nowhere near the 75% contour (See Figure 2). 

Figure 2: 2041z LightningCast with ProbSevere and NTLN lightning. 

-Podium 

Storms surging in northeast Texas

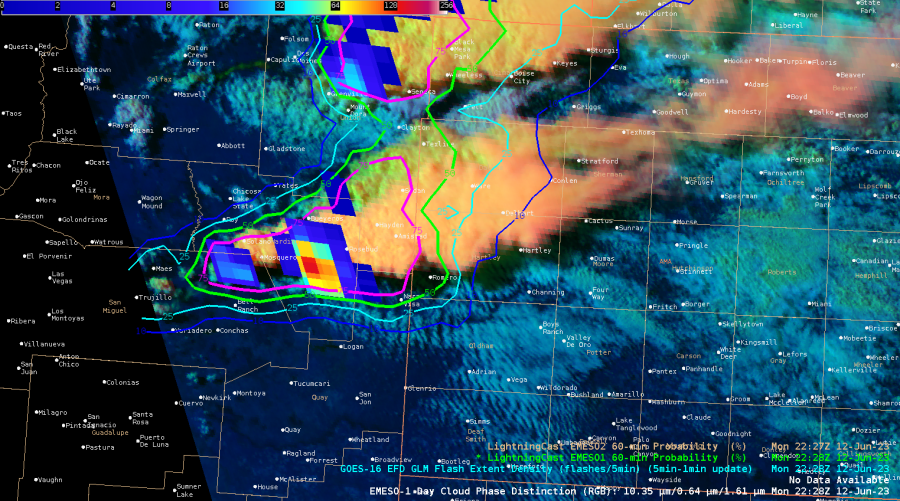
As we begin today's HWT shift, storms are already developing quickly. ProbSevere LightningCast was able to readily give objective probabilistic guidance on the next-hour probability of lightning for these storms, which developed under clear skies.


Figure 1: LightningCast probabilities (contours), GOES-16 ABI daytime cloud phase distinction RGB (background), and GOES-16 GLM flash-extent density (orange-foreground). 


The Dallas / Fort Worth metro is seeing severe hail from these rapidly developing storms. The GOES-R satellite growth rates are contributing to high probabilities of severe for both ProbSevere v2 and v3 (huge CAPE and effective shear doesn't hurt, either). 

Figure 2: ProbSevere v3 contours, MRMS MergedReflectivity, and NWS severe weather warnings for storms near the Dallas / Fort Worth metro.


Monday, June 12, 2023

6/12 Observations from ABQ CWA

 OCTANE

Have knots abbreviated as “KTS” instead of “KN”

Change direction of movement from to lettered degrees instead of a numerical value

This product does help me become more aware, in realtime of the winds vertically.  However, not entirely sure how to adapt this into my forecasting routine yet.

NUCAPS

Great to see the better sampling/readout of the data compared to what it was 2-3 years ago

The parcel count is a great way to help me gauge the validity of the data (confidence in how accurate it is)

Overlaying a NUCAPS forecast field with the parcel count allows me to sample what the field has and what the parcel count is so I can have more of less confidence in the data

No less than six hours for operational needs.  9 hours might be the perfect duration.  I usually don’t use hourly data much beyond 9 hours due to my lack of confidence in the reliability of the data.

Hourly data is very nice.  Half hour spacing is a bit too much data for that duration.
-Something to consider is could there be half hour spacing in the data for the first three hours?  However I don’t know if that would be enough of a benefit to use.

I would use the 700-500mb lapse rates, ML CAPE, temp and dew point, and parcel count most often.

PHS

Very easy to look at; very smooth data

Didn’t have much time to look at the data

Lightningcast

Noticed on a well defined supercell the lightning probability is not over 80% despite lightning ongoing.  Does the program cap at 75-80%?
-Have GLM ligthning data displayed too

Otherwise this does help draw my eye to where lightning could occur in the near future.

Prob Severe

Didn’t have time to look at it much. Did notice the storm in eastern CWA had higher values for version 3 than for version 2

- Rainman

Day 1 Review of Products & Operational Applications

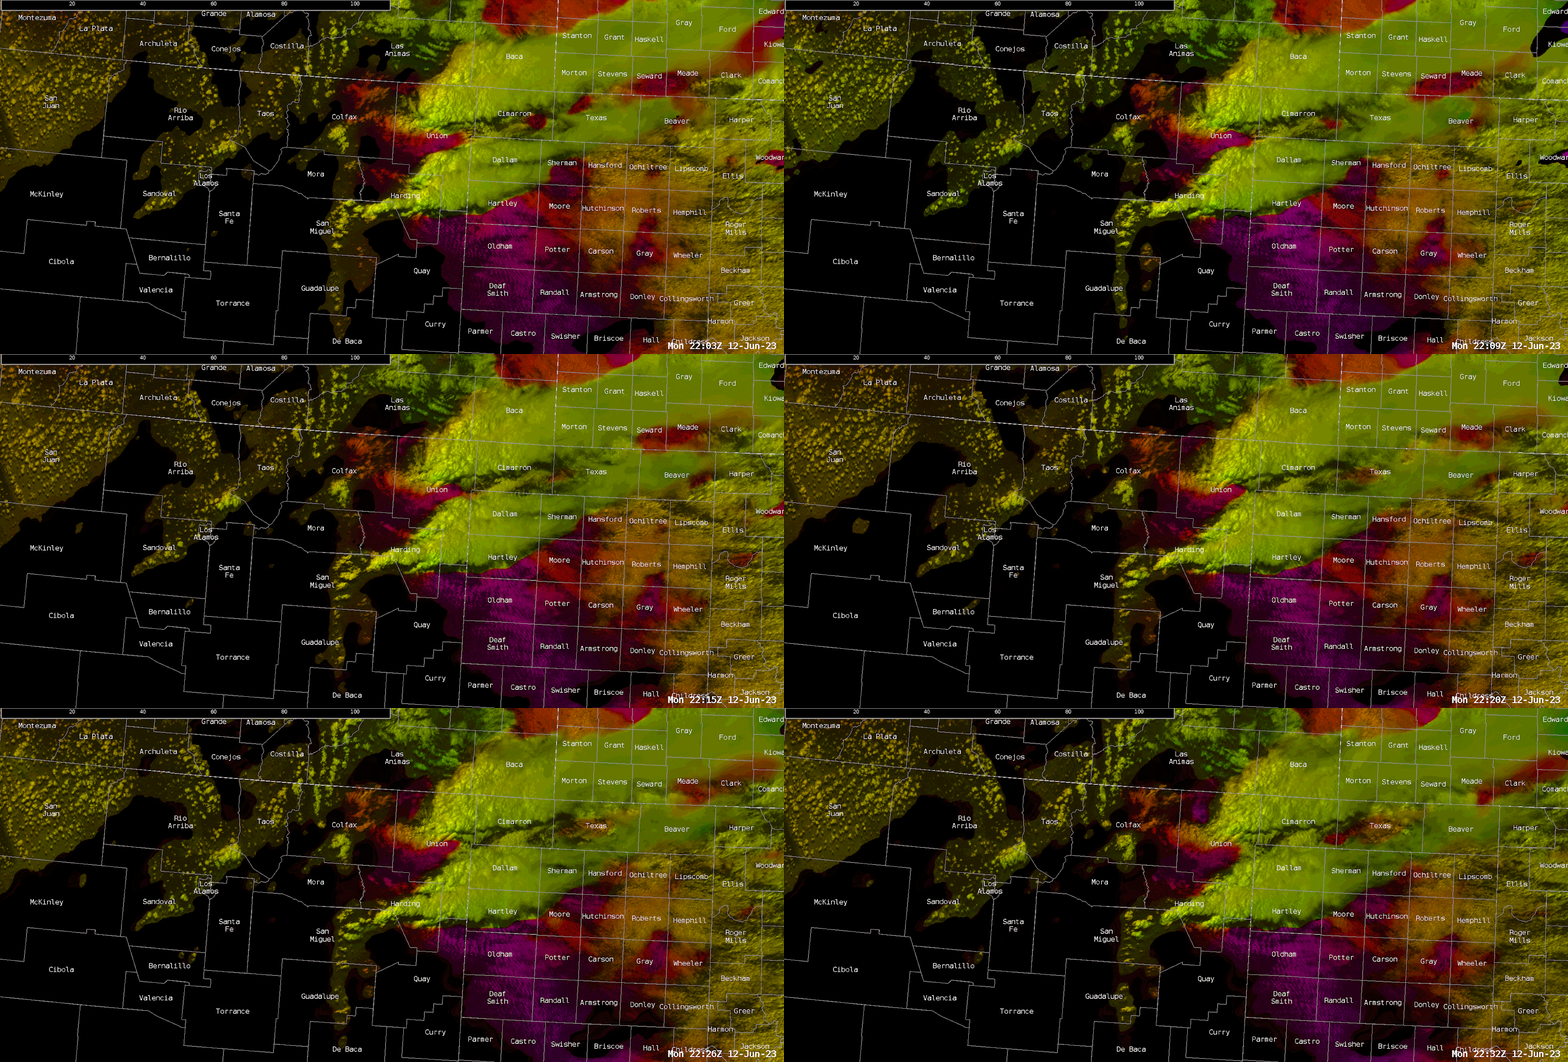
 OCTANE-Direction

  • Distinguish different air masses when they are characterized by different advection regimes
    • Stable cloud streets in magenta (Figure 1)
    • Agitated Cu and deep, moist convection in yellow/green (Figure 1)
  • Locate boundaries
    • Identify areas of convergence based on the depicted flow directions
  • Suggestion: it would be great to be able to sample the cardinal direction (i.e. NW, SE) in AWIPS in addition to the direction already given in degrees

Figure 1

NUCAPS & PHS

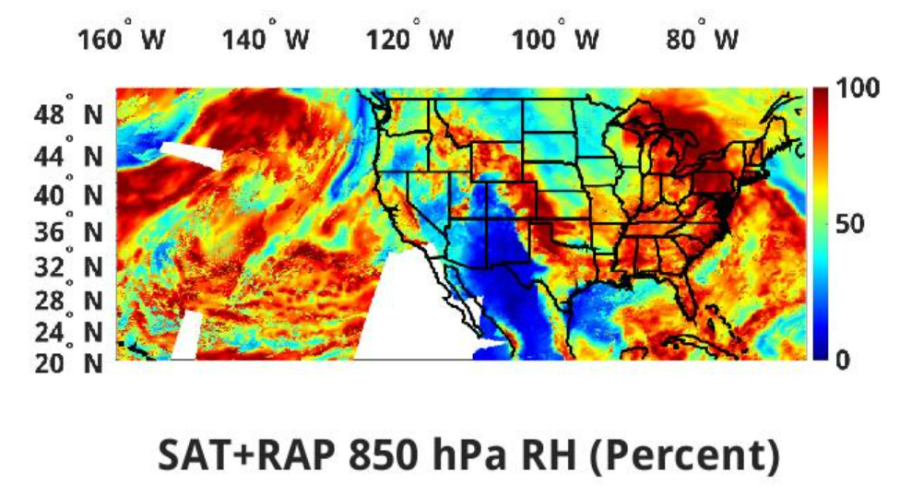
  • Attempts at convective initiation failed over Guadalupe County and De Baca County… but why? Isobaric analysis revealed supportive dynamics for ascent south of the already-occurring convection.
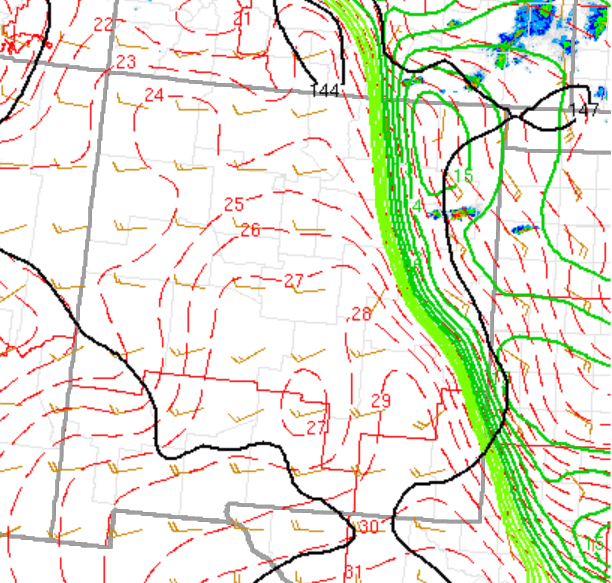
    • 700 mb relative humidity and 850 mb humidity data (Figure 2) reveal a sharp moisture gradient across northeastern New Mexico
      • SPC 850 mb Td mesoanalysis verifies this (Figure 3)
    • Dry air was already moving across both counties from the west and was progged to continue over the next few hours, thus hindering convective initiation

Figure 2

Figure 3

- Vort Max

Comparing PHS Data with SPC Mesoscale Analysis and MRMS Data

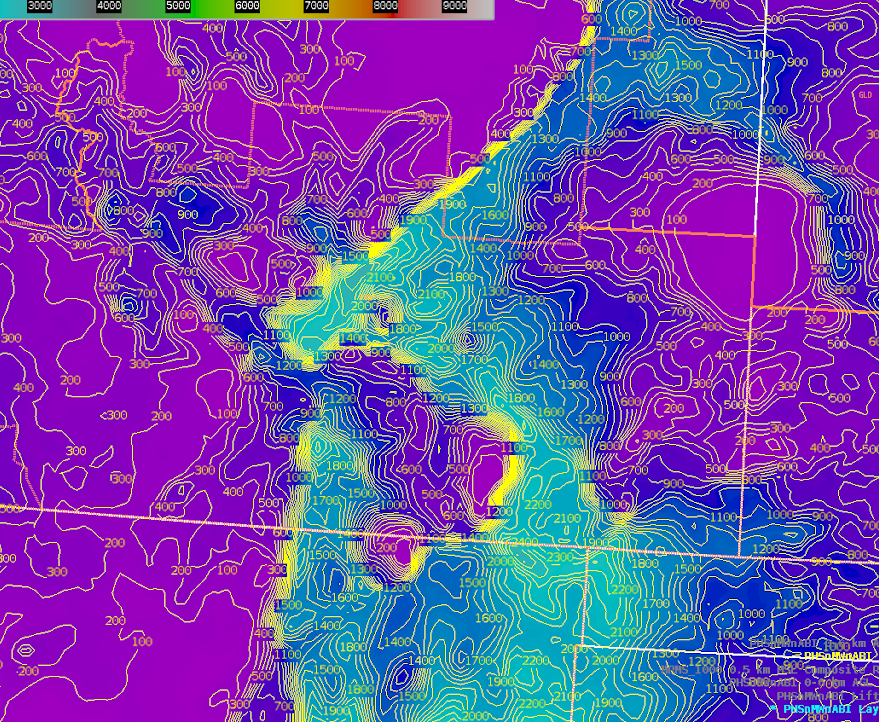
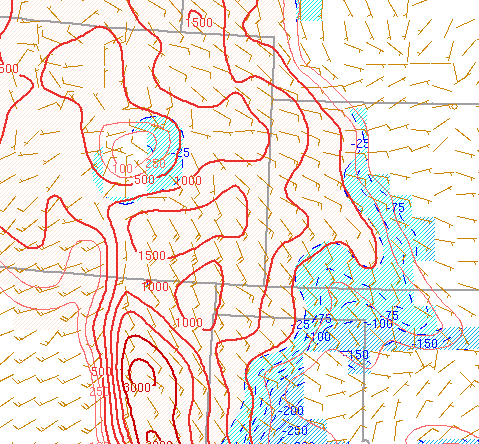
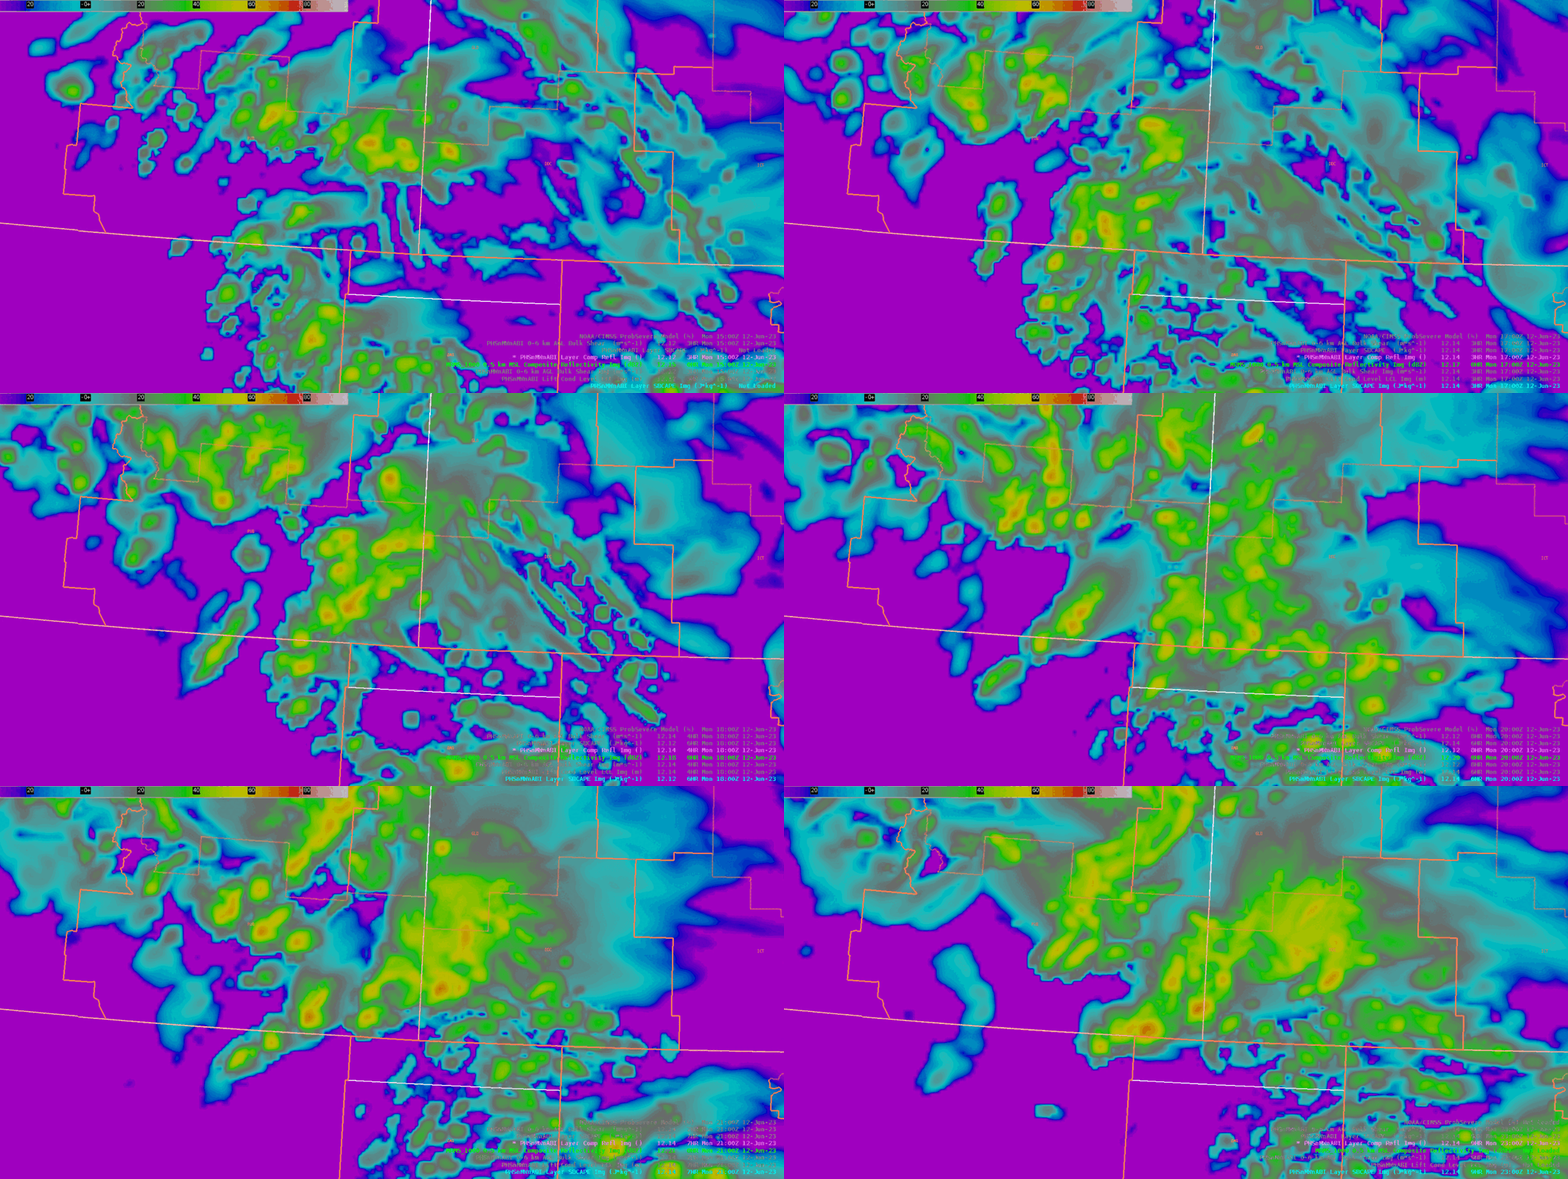
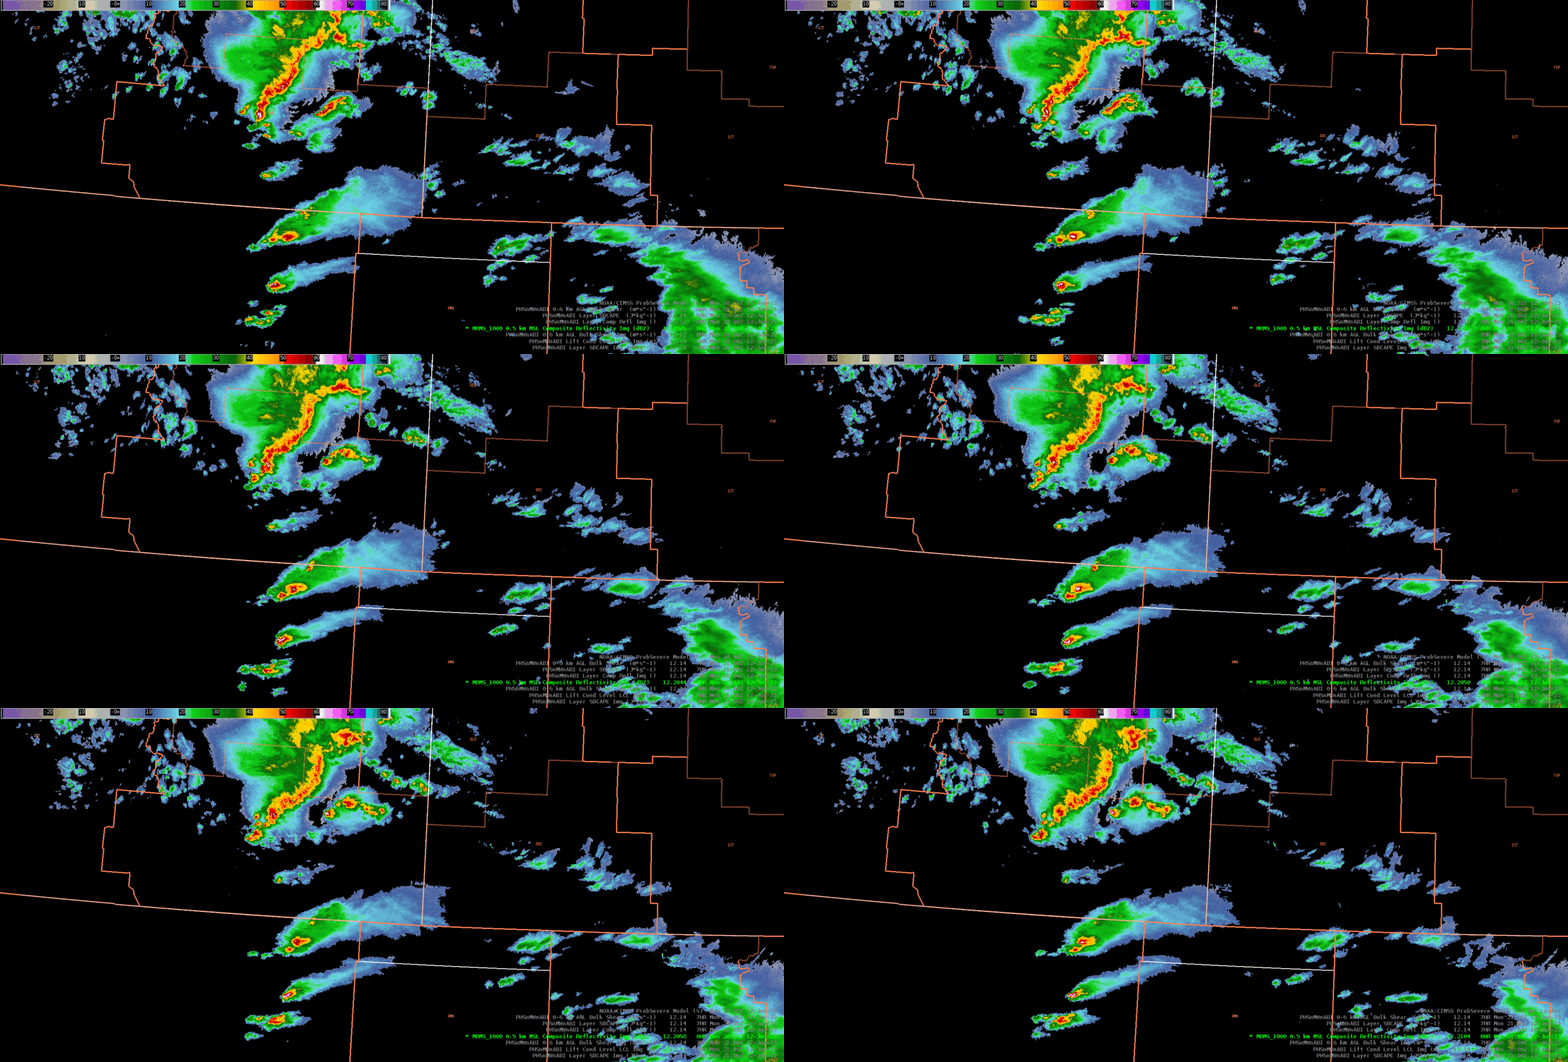
 The first day was slightly overwhelming with all the different products to test out this week. I decided to focus on one of the products I was unfamiliar with and that was PHS data. I compared PHS SBCAPE/MUCAPE values from the 12.14z model run to the latest SPC Mesoscale Analysis data. At first glance, the PHS SBCAPE/MUCAPE values depicted were generally higher over southern Colorado and northern New Mexico than the SPC data. However, I did notice a small bullseye of CAPE minimums in south-central Colorado and was curious about why that was depicted (See Figure 1). The SPC data was not as detailed with the gradients and had no mention of the minimum in south-central Colorado (See Figure 2). Thankfully, one of the developers was in the room and mentioned that the model might be depicting storms in that location. I loaded up the composite reflectivity from PHS (See Figure 3) and sure enough, PHS was suggesting storms in south-central Colorado.

Figure 1: Top image shows PHS SBCAPE at 20z with a minimum in south-central Colorado.

Figure 2: The bottom image is the SPC Mesoscale Analysis at 20z.

The composite reflectivity had the right idea with convection near that location compared to MRMS data. It was slightly further north with the maximum dBz values, but for an 8-9 hour forecast, it depicted the convection fairly well IMO.  The PHS did much better with the convection over the northern portions of PUB CWA as it showed a decent line of storms at 22z which matched up well with MRMS.  For obvious reasons, this model could certainly be helpful in providing higher confidence in convective storms for various NWS partners and DSS events.

Figure 3: top loop showing the PHS layer composite reflectivity.  This is the 12.14z model initialization.

Figure 4: MRMS loop of the composite reflectivity for the hour of 20:00z to 21:00z.

- Podium

Monday 6/12 Initial Post

 Lots of products to look at and test. It’s a daunting task to know if you are looking at everything enough and in the correct way.

Appreciate the interaction with the developers and the openness to questions.

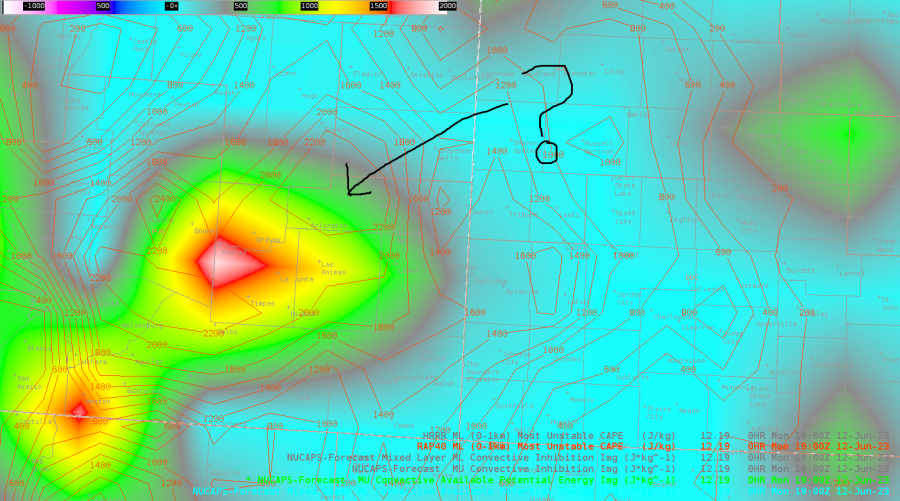
Below is a quick screen capture of the 6/12 19z 0hr NUCAPS MUCAPE (image) with the 19z 0 hour RAP40 MUCAPE contours. The developer mentioned that NUCAPS was good at depicting gradients but in this instance the gradient in the image is more smoothed than the RAP data while also being much less value than the RAP data. This raises questions on which analysis is best? Why? Is that same reasoning valid across the entire domain?

I would like to see observational data used as check point against model initialization. Where could larger errors in the model initialization raise questions about future forecasts. Asking the operational forecaster to quality control initial conditions has been a common ‘task’ assigned to maintaining situational awareness. I would like to see computers help with that task.

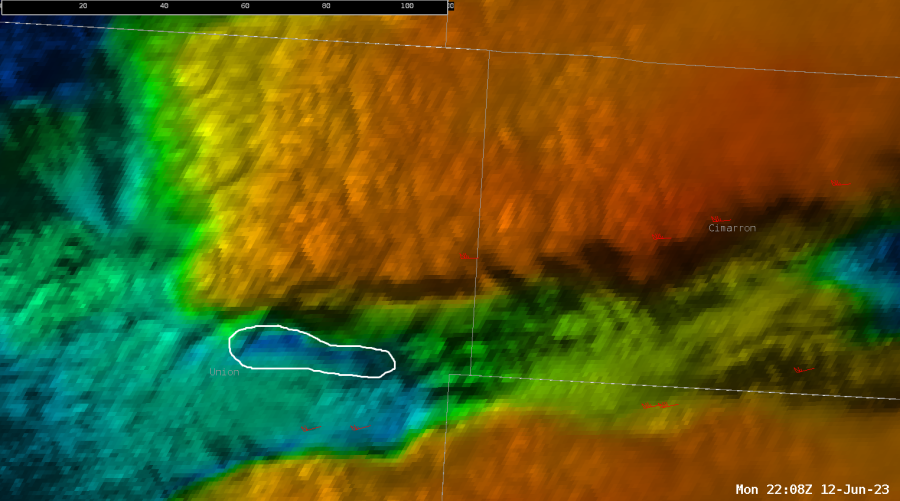
Quick update. Captured this image in the OCTANE data of an ongoing storm (likely supercell) in far NE New Mexico. The narrow corridor of light wind speeds (circled in white) matches my conceptual model of where the forward flank outflow boundary would be located. If this is the correct interpretation I think it would be very useful application in warning operations.

-jbm

Day 1 Observations

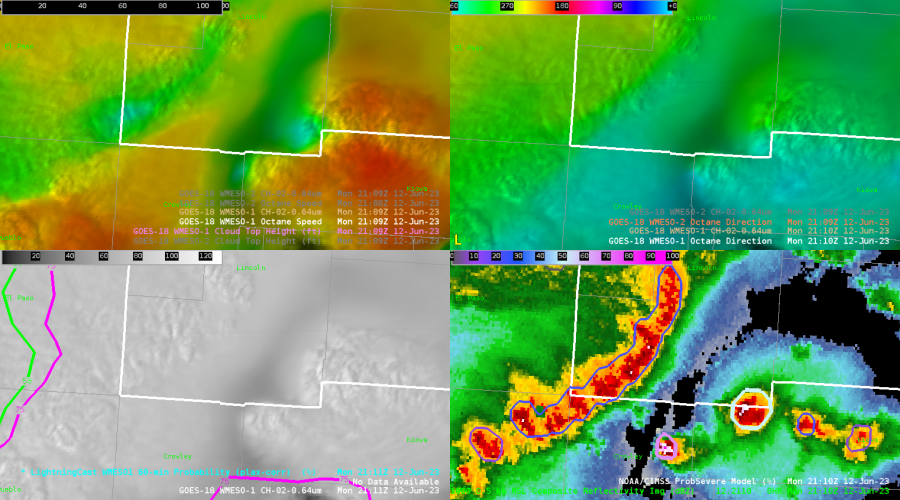
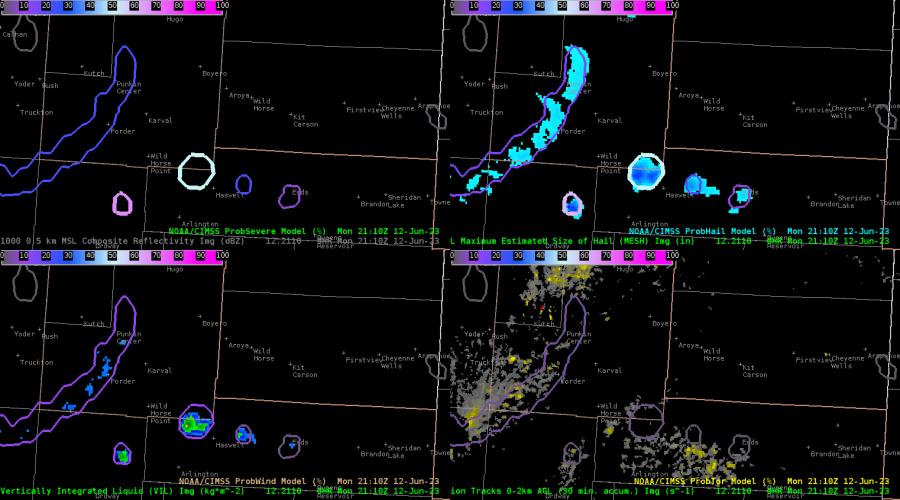
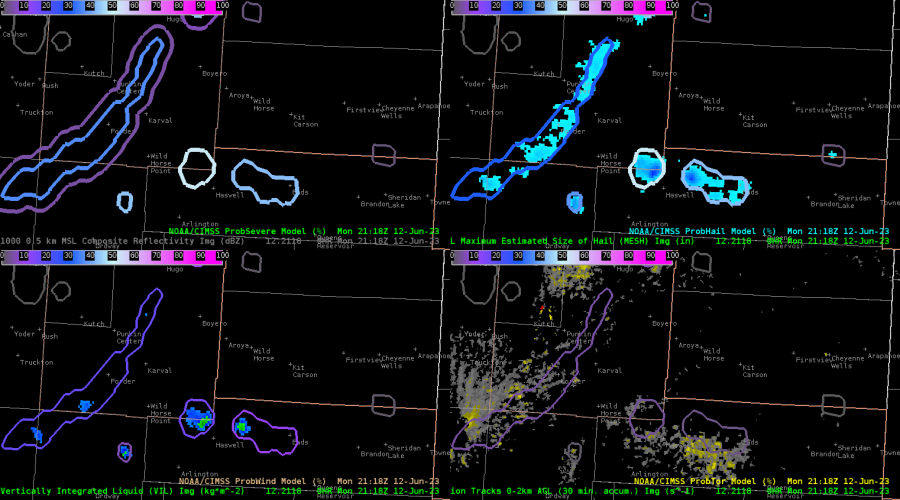
 The one thing I found today from looking at PUB CWA, was that the Octane satellite image may have been picking up on areas of intensification before it was radar indicated. The areas of interest lie on the Lincoln, Cheyenne, Kiowa county lines and Lincoln, Kiowa lines as seen in the upper left image below. There is a gradient between the yellow and blue which identifies areas of divergence.  The bottom right image is the radar showing that there are cells in the area.

This next image shows the probsevere predictability at the time of the above image. Note the values, especially on the prob hail (upper right)

The next image below shows that the probsevere values actually did increase in under 10 minutes on ProbSevere (Top Left and Prob Hail Top Right) The intensification could be from locally enhanced wind shear as Octane shows convection developing locations of strong shear in the localized areas of divergence aloft. It will be interesting to see if this trend continues throughout the week.

-Tornader

Assessing Potential for Additional Severe Convection in ABQ June 12, 2023

 Our group role played as ABQ on June 12, 2023, where severe convection was already underway in the northern third of the CWA during the early to mid afternoon. Rather than interrogating ongoing storm strength and hazards, we were curious as to whether or not additional severe convection was possible south of the current convection. In essence, we were performing tasks of a mesoanalyst.
The synoptic environment was composed of upper troughing over the Great Basin region, with a stout, unseasonably strong mid to upper level jet at its base overspreading New Mexico, and a shortwave trough pushing out of the Four Corners into southeastern Colorado as well as northern New Mexico. GOES-16 mid level water vapor imagery showed the location of the bulk of synoptic forcing through steadily cooling brightness temperatures (not associated with deep convection). Overlaying NAM 500mb geopotential heights helped illustrate where strongest height falls associated with the shortwave trough were located. In this case, strongest height falls/cooling brightness temperatures were located within southern Colorado into far northern New Mexico, and was driving the ongoing severe convection in northern ABQ. However looking south and upstream within central New Mexico, there were still cooling brightness temperatures within water vapor imagery, just not as robust relative to the north. This implied there was still some synoptic forcing for ascent to overspread areas like San Miguel, Guadalupe and De Baca counties, the counties we were most interested in for additional initiation.
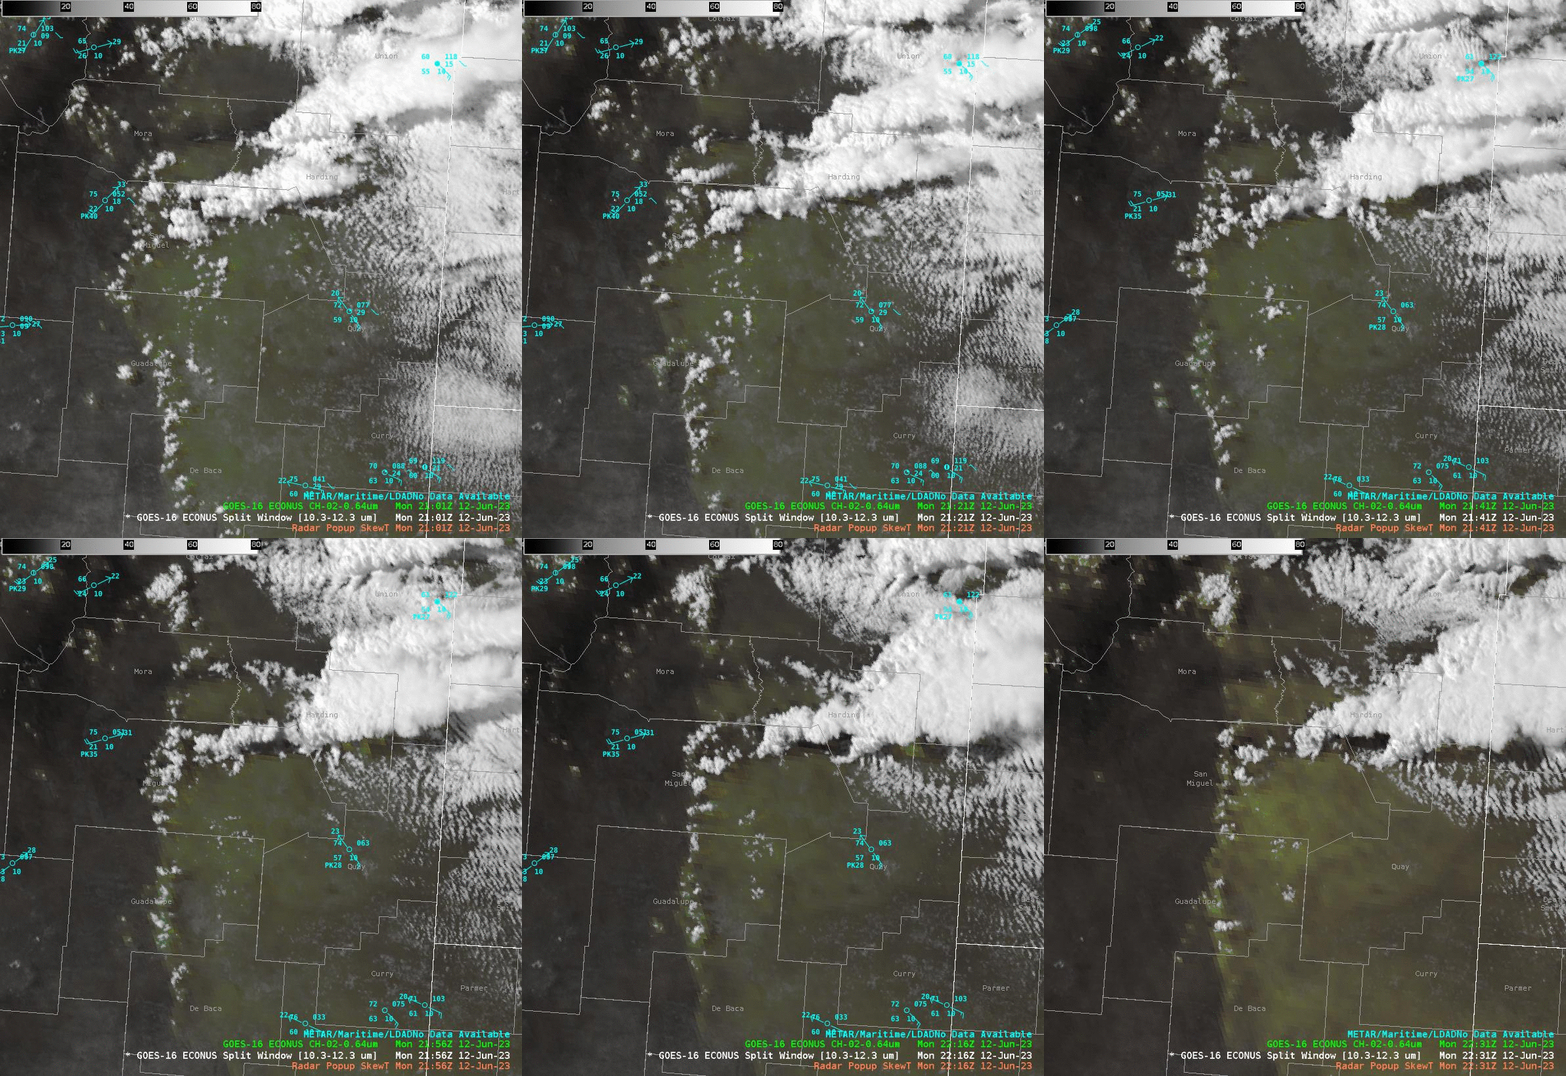
Another display we referenced to assess low level moisture content was GOES “Clean LWIR 10.3um - Dirty LWIR 12.3um” Split Window Difference sandwiched with visible imagery to show current areas of Cu development/maintenance. This showed low level moisture pooling up nicely along higher elevation of the Sangre de Christo Mountains southward to the higher elevations along the western flanks of the southern High Plains, along with agitated Cu at the terminus of these moisture gradients. Additionally, local areas where there were easterly pushes of the moisture gradients suggested dryline dynamics were at play, potentially providing additional forcing for ascent.

After assessing the current state of the environment, we referred to PHS Layer Composite Reflectivity, which is simply just simulated reflectivity offered by the WRF that runs within PHS environment that incorporates latest hyperspectral sounder information on thermodynamics via polar orbiting satellites while merging it with the motion and high spatiotemporal resolution of GOES ABI . The 18Z model run indeed sparked additional convection off of the higher terrain within Guadalupe County.
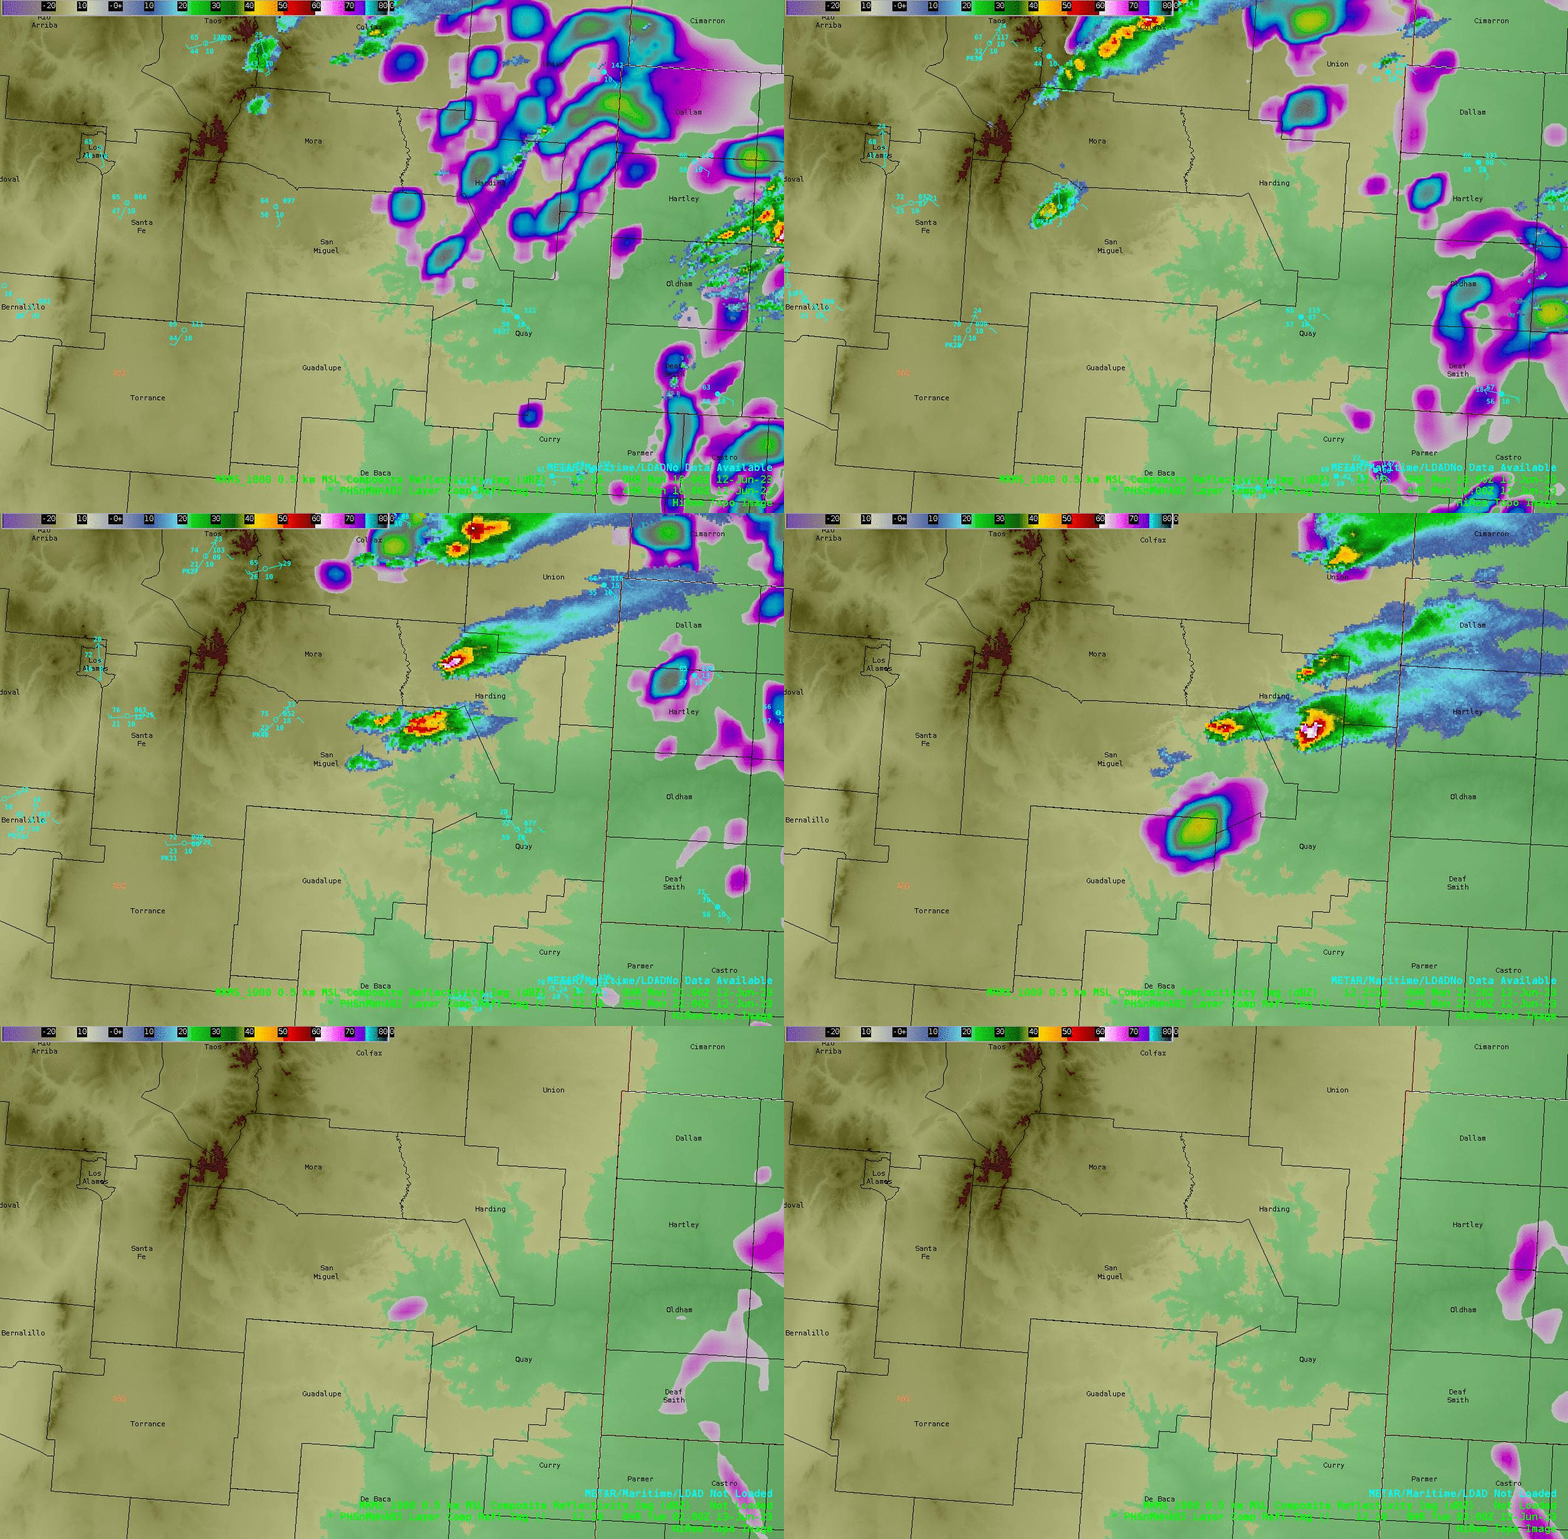
So in the eyes of this model, the potential was still there. It was also nice to compare current radar (in this case MRMS Composite Reflectivity) in the same display as PHS reflectivity to see how the model was performing in this aspect thus far.

But let’s not take this for face value as this is modeled convection. We desired other datasets to help provide insights on the thermodynamic environment that may play a role in allowing additional convection, or lack thereof. With this, we referenced other datasets within PHS:
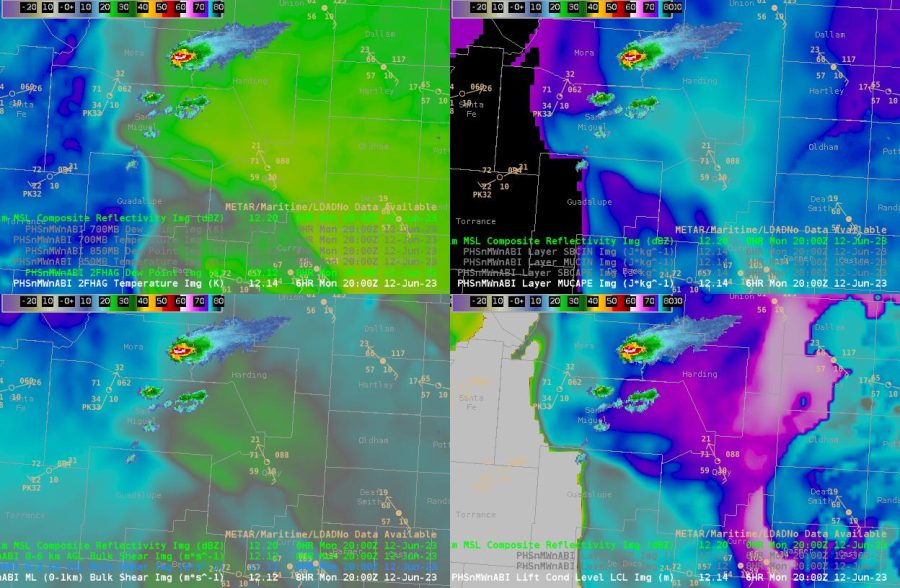
This display shows MRMS Composite Reflectivity and surface observations overlaid with PHS thermodynamic parameters in the top and right halves, and shear parameters in the lower left. Focusing on the two right panels, PHS suggested moderate instability (~1500 - 2500 J/kg) lee of the southern Sangre de Christo Mountains into the southern High Plains of northeastern New Mexico, with perhaps slightly lower instability within Guadalupe and De Baca counties. More interestingly was the stark increase in LCL heights within these counties compared to the environment just to its north. This raised a yellow flag, leading us to to think thermodynamics may not be as favorable as the area with current convection. Perhaps relatively drier air may be located in this area of interest compared to that currently driving convection? We referred to other satellite-derived datasets like NUCAPS soundings, Gridded NUCAPS and NUCAPS-Forecast (not shown) to assess upstream mid level moisture (namely 700 mb RH) advecting into the area, of which reveals a well developed and strong EML with notably strong inversion nested around 700 mb. We also referenced PHS CIN (not shown) which exposed a relatively higher area of capping in this same area where LCLs were higher.

It was nice having the high spatial and temporal resolution offered by PHS when performing mesoanalysis, and in my opinion had an advantage over objective analysis (e.g. SPC Mesoanalysis), with its higher resolution and ability to step forward in time on an hourly basis.

Here is the full loop of this PHS display between 18 UTC to 23 UTC:
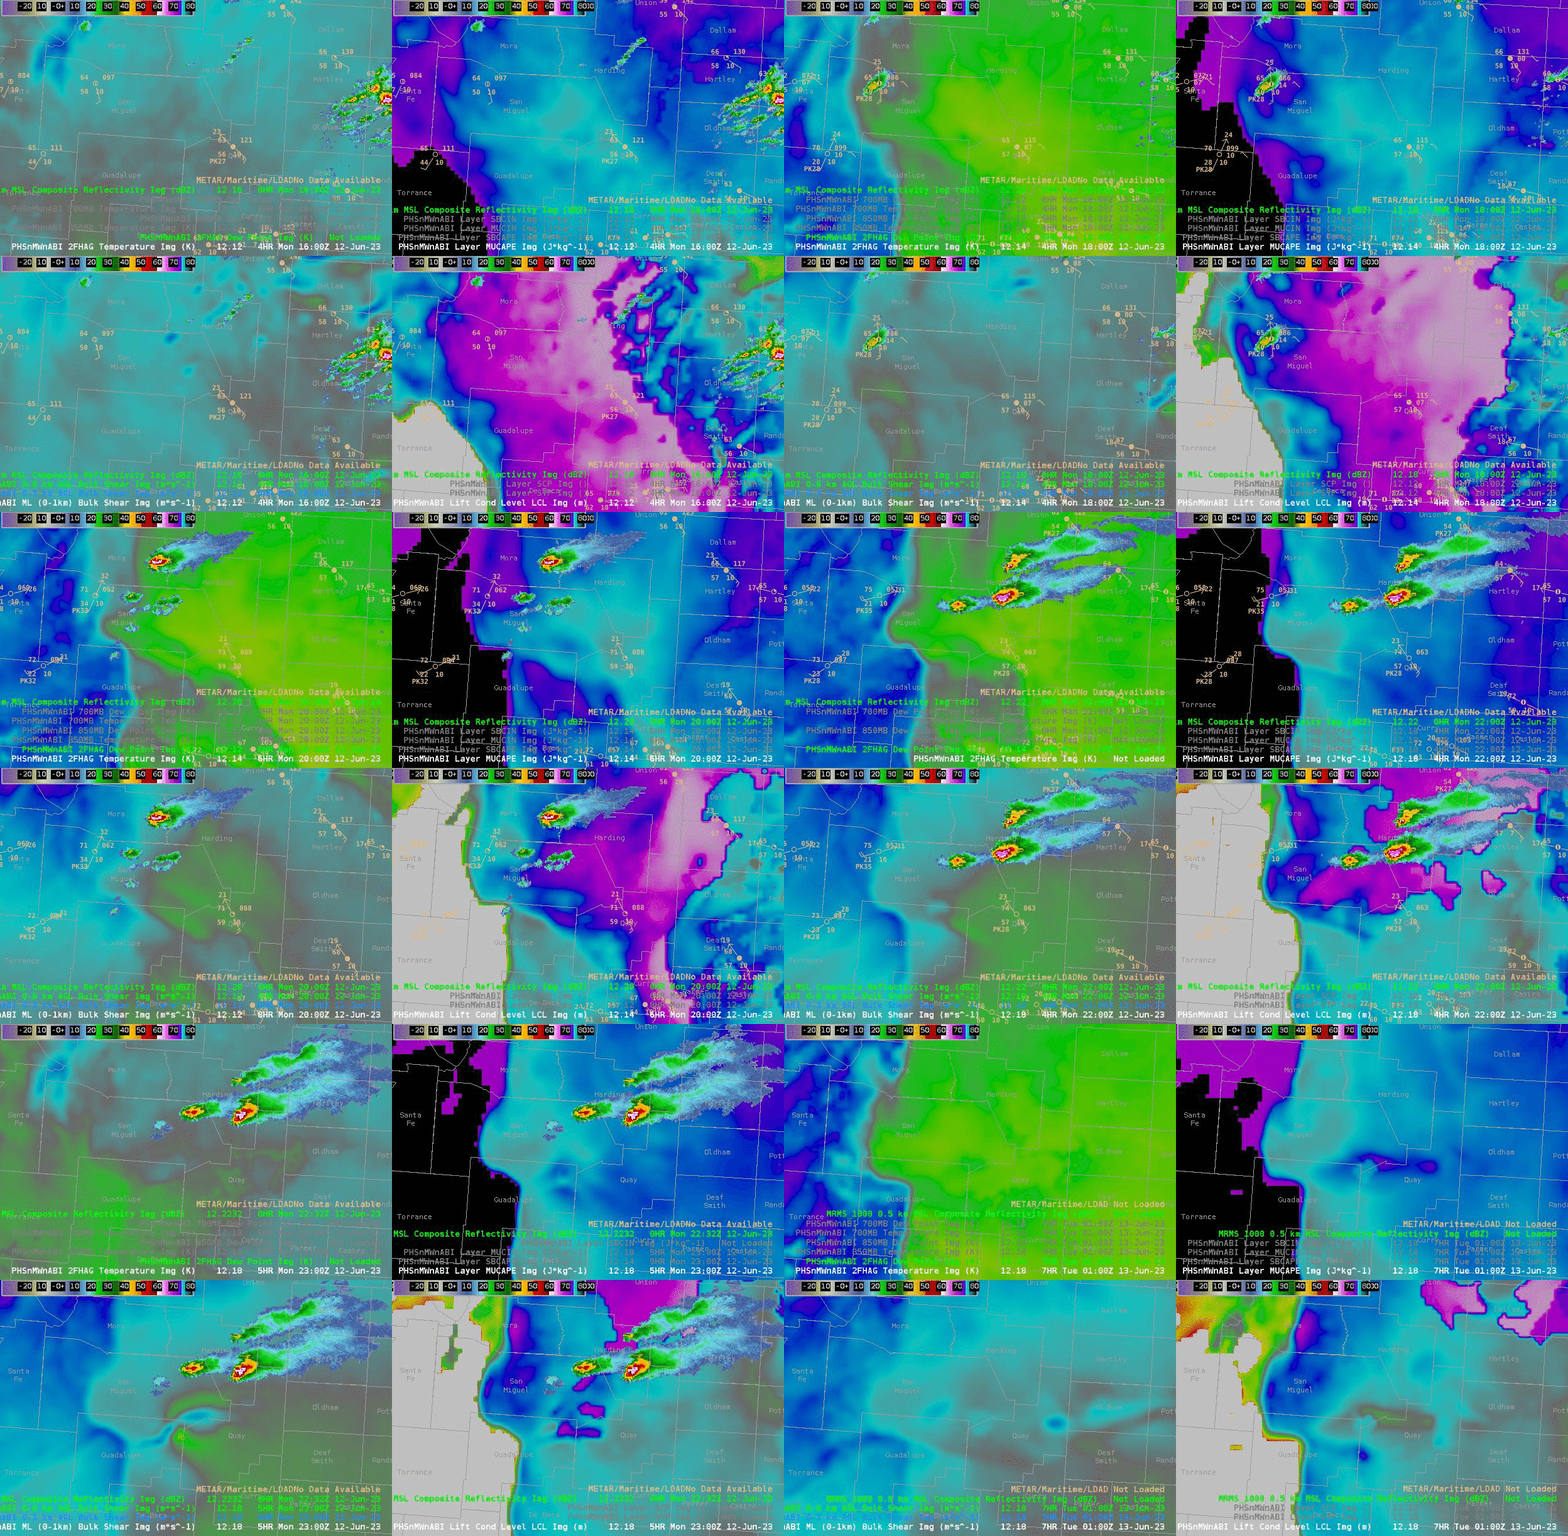
Within our area of interest, the considerations of relatively higher CIN, strong EML advecting over this area, relatively weaker forcing compared to points north, we had some concerns that sustained convection would develop, but we still didn’t discount the possibility should enough subtle forcing via synoptic (DCVA/height falls) and mesoscale (dryline) lift contribute together to overcome locally higher capping likely in place. Ultimately, we gave around a 20-30% chance of additional severe convection within Guadalupe and De Baca counties in the next 1-3 hours starting at 21Z.
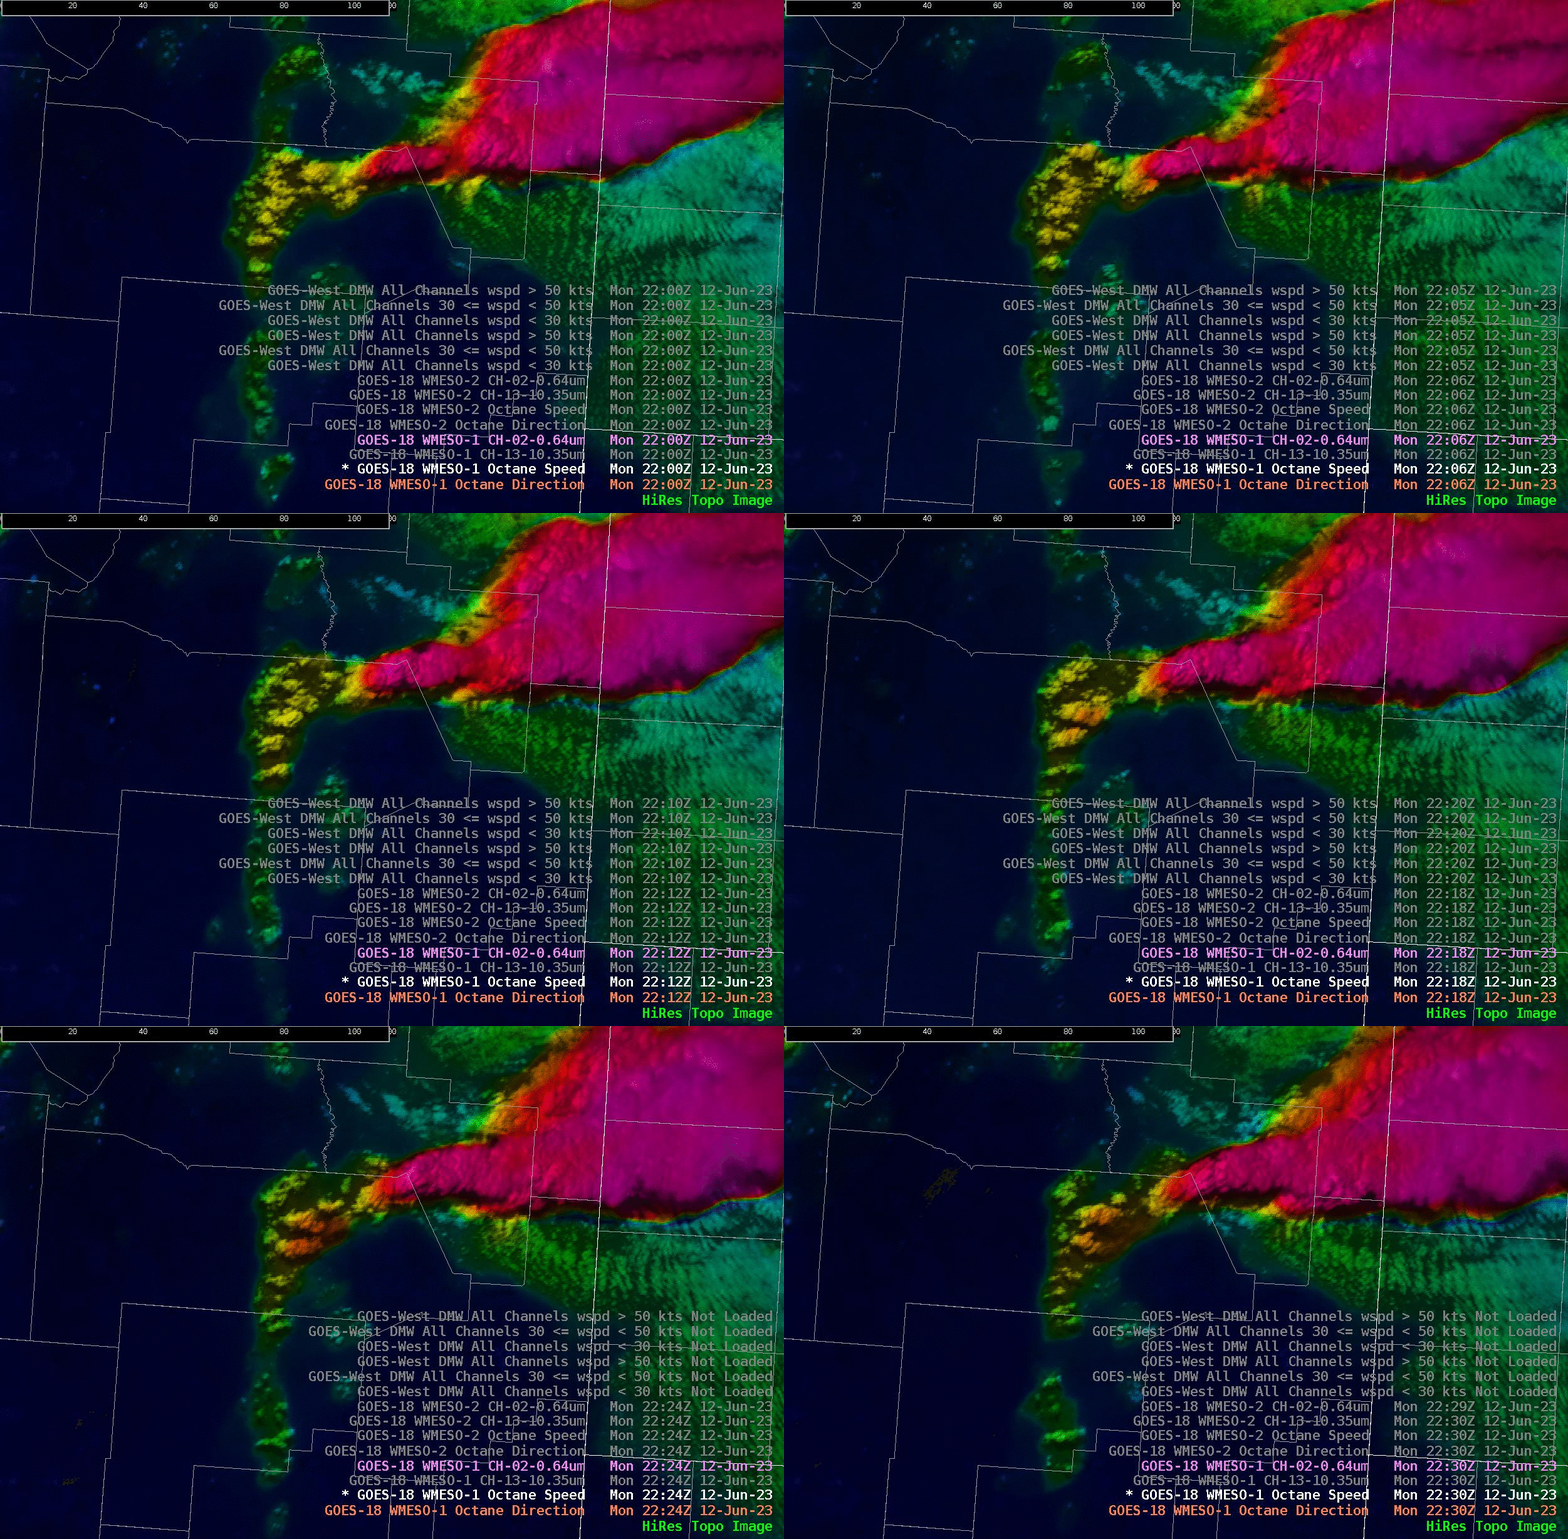
Just before today’s HWT window closed, OCTANE hinted at attempts of deep convection within central San Miguel County via the warming colors collocated with agitated Cu turned orphaned anvils behind exiting deep convection. This was advantageous as it caught our eye perhaps faster than Day Cloud Phase Distinction RGB indicated for attempts at deep convection.

Ultimately, deep convection did not occur within Guadalupe and De Baca counties.

- OSMBLSN     
Thursday, June 8, 2023

CHS OCTANE Orphan Anvils

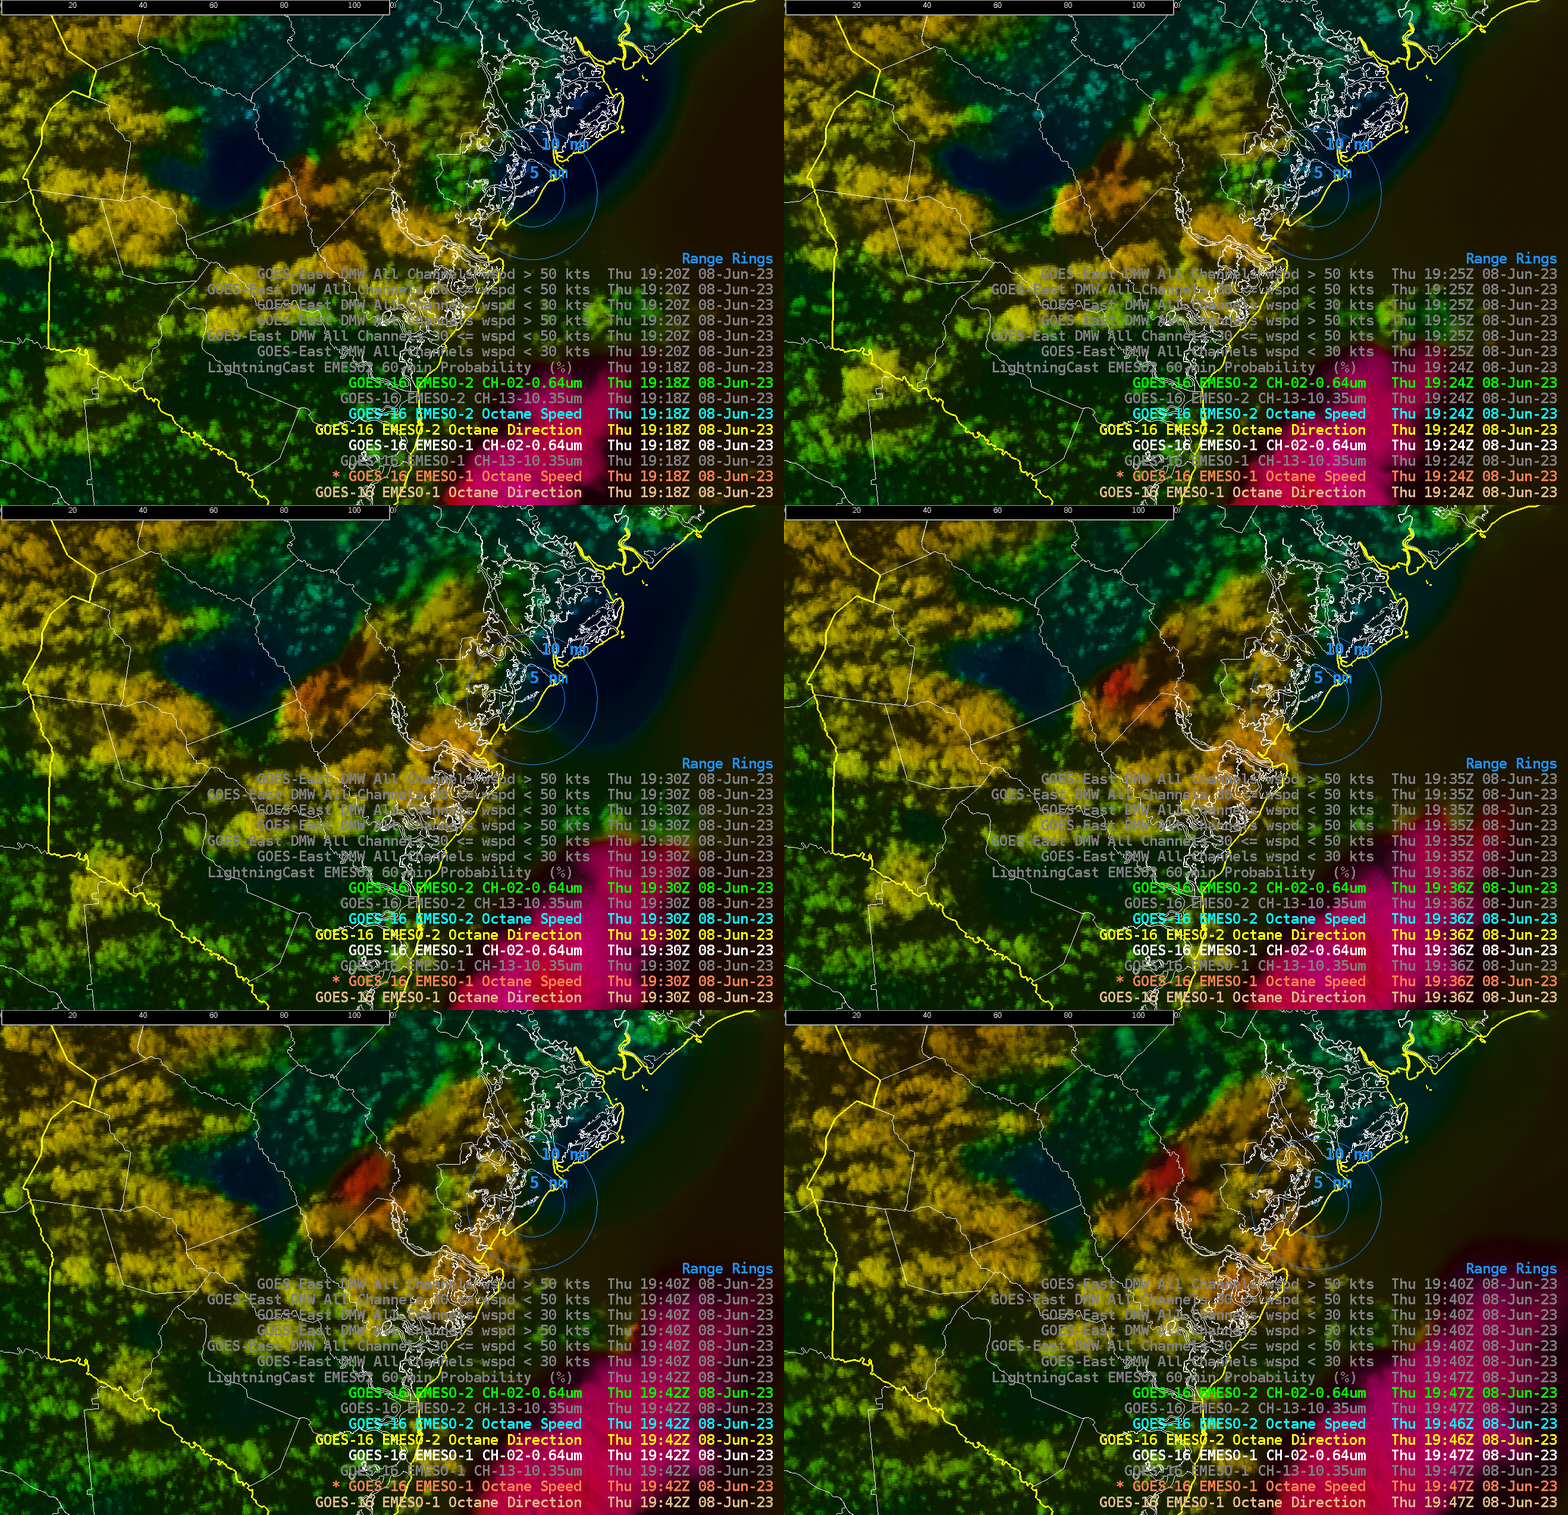
 While watching for convective initiation over the Charleston CWA, we noticed that the deepest convection over land started to produce orphan anvils; two of them during this loop. It made us curious if we could see any precursor in the OCTANE Speed Sandwich RGB to a developing orphan anvil. At the typical color bar range of 0-200, it was minimally visible, but as we shrunk the range, a precursor became more evident. The example here has a range of 0-75. Note the cell in the center of the screen. At the beginning of the loop an orangish reddish color can be seen just before the orphan anvil develops, then a more noticeable color enhancement can be seen as another anvil is about to be orphaned. From a forecaster standpoint, knowing anvils are about to be orphaned can be helpful to know that a particular cell is not likely to intensify and will probably diminish. Although orphan anvils can be seen with the OCTANE Speed Sandwich, orphan anvils still may be better seen in day cloud phase or day cloud type RGBs.

OCTANE Speed Sandwich loop of two orphan anvils developing.

- Burton Guster & Displar

Severe Storms over Central Texas.

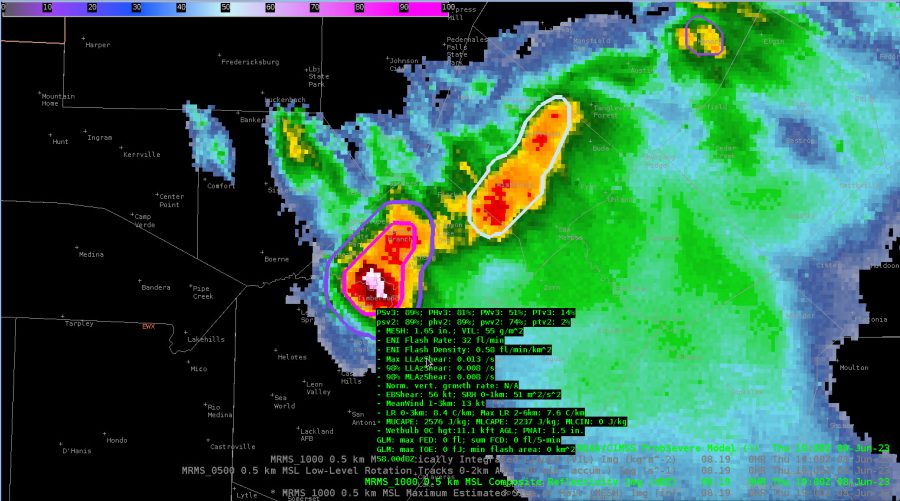
 Storms over northern Bexar and southern Comal have had hail up to golfball size reported. This is in good agreement with the MESH signature. Additionally, Prob hail for both v3 and v2 are up over 80%, so in good agreement with the algorithm.

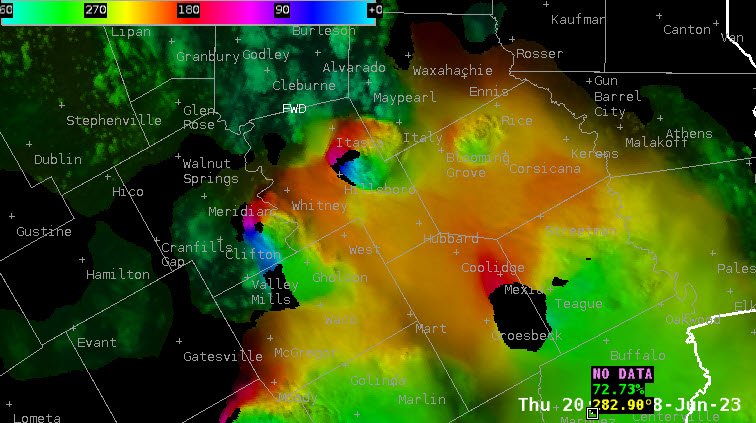
Animation of storms with the latest OCTANE. Looks like storm top divergence can be inferred from 70 kt anvil level winds to the south and 30 knot winds to the northwest. Would equate to strong divergence aloft and indicative of a severe storm.

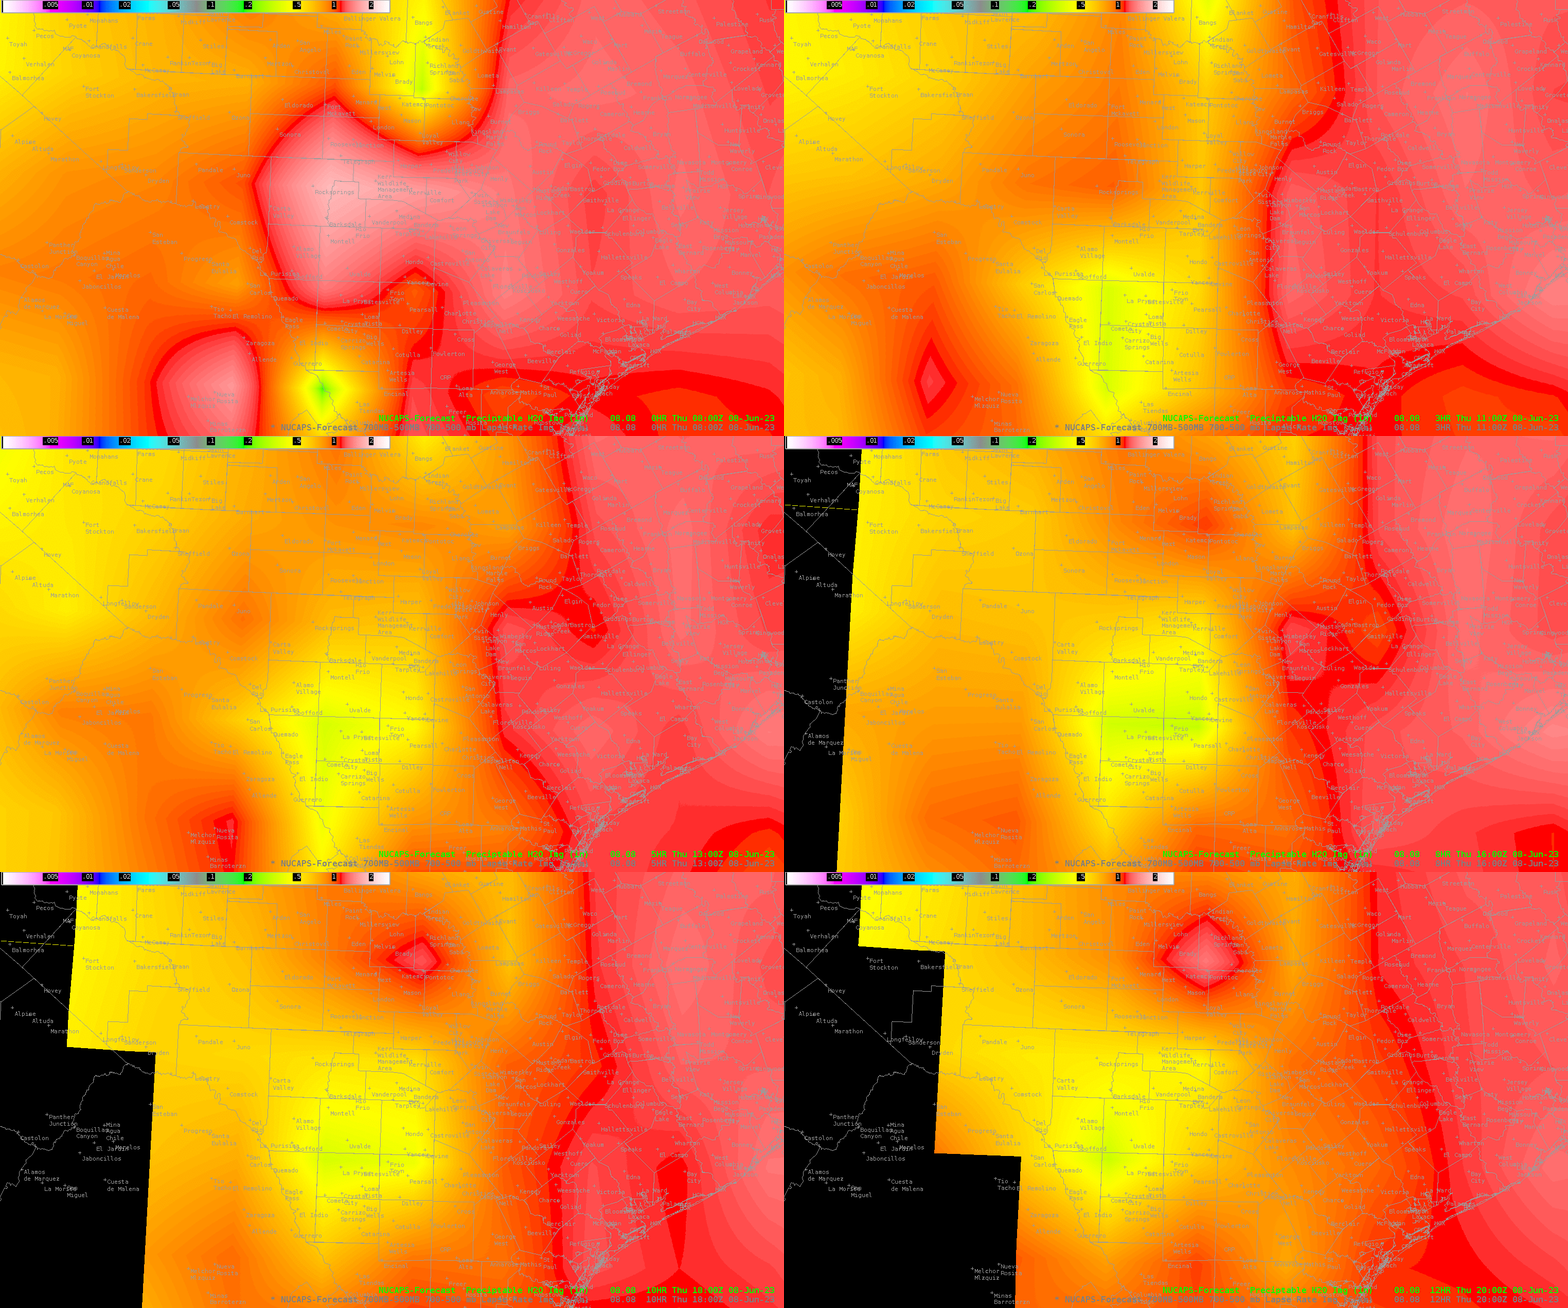
The 08Z Pass of NUCAPS shows a rather impressive PWAT/Moisture gradient this morning, which would likely lead to increased storm chances along the theta gradient over the Hill Country and stretching eastward into the I-35 Corridor. The gradient ranged from 1.25” over the Coastal Plains to .50” over the Edwards Plateau and western EWX CWA.

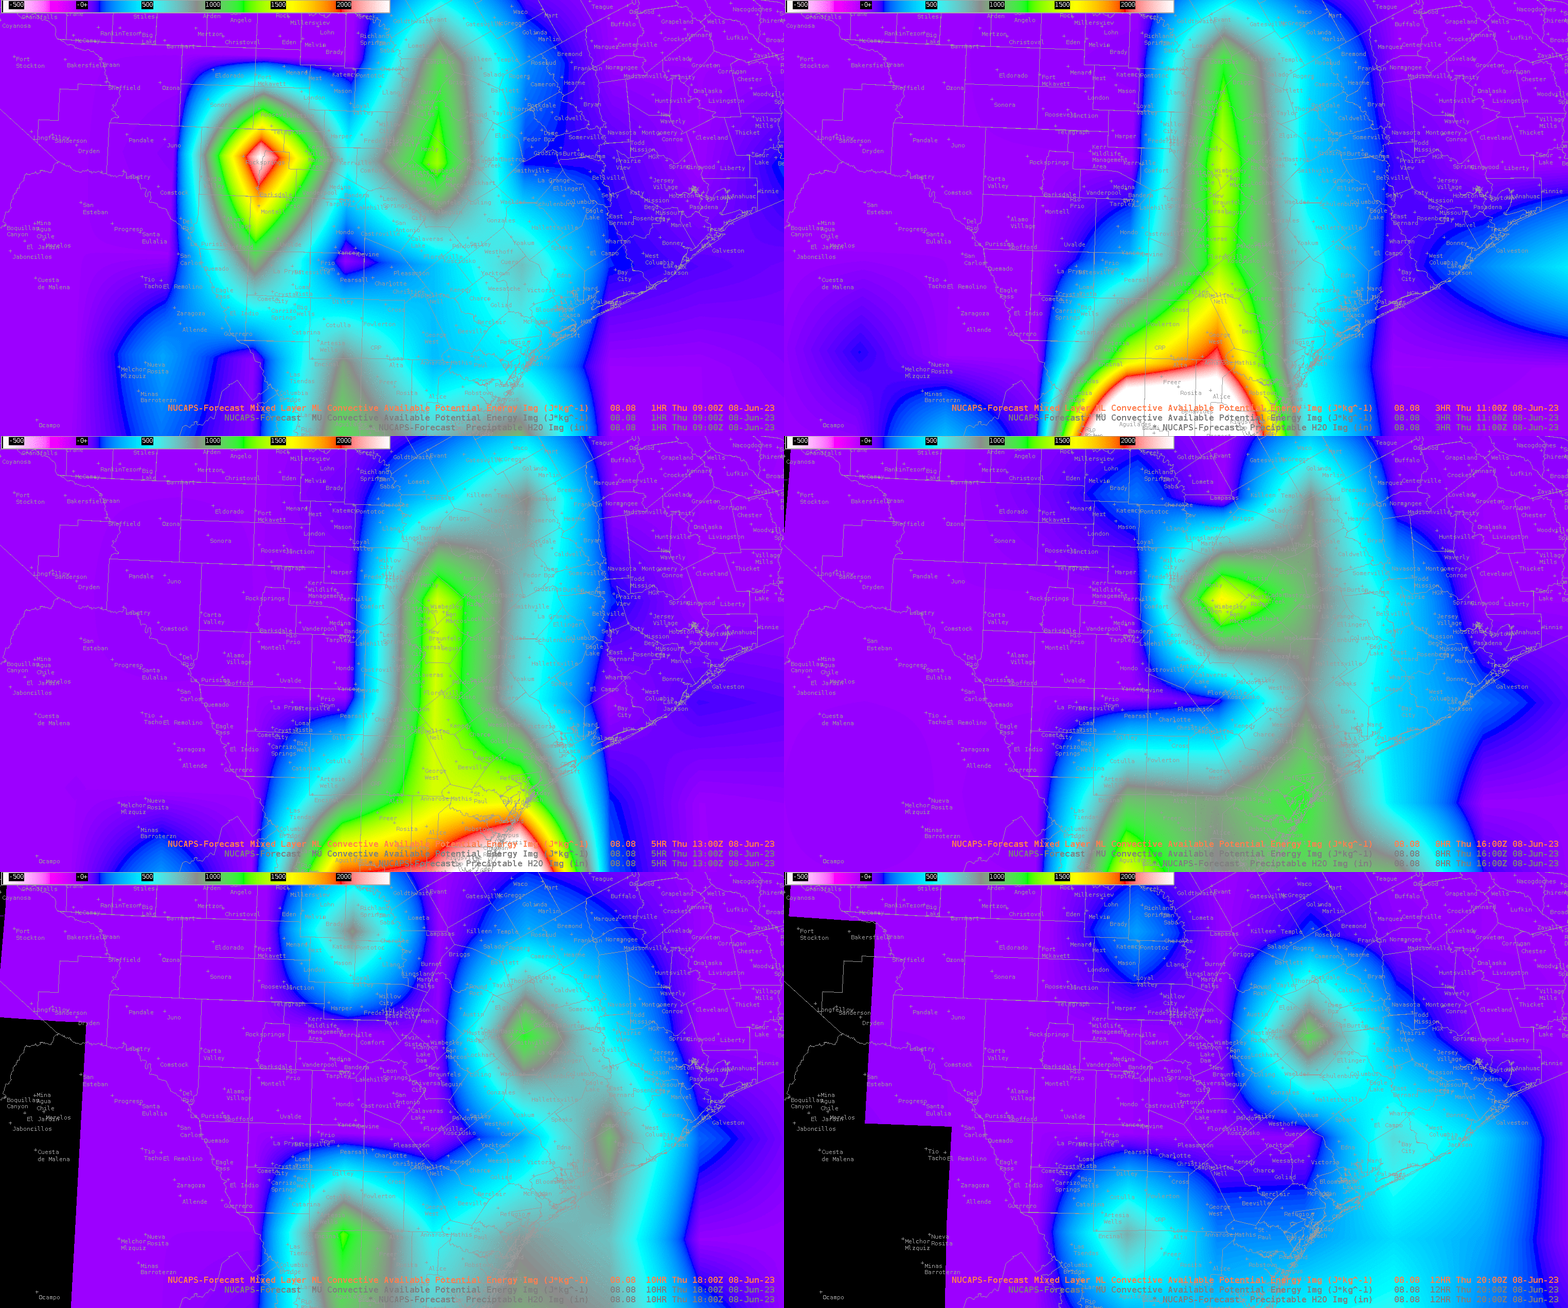
This ties in nicely with the MLCAPE available this morning.

Storms going up in a weaker shear environment with a rainbow color distribution all around the storm from the OCTANE direction window. Very interesting. You may actually be able to infer the type of storm/environmental conditions just based on OCTANE direction depending on the situation.

- Satellite Steve, StormofCentury , Bolt