Wednesday, May 24, 2023

Afternoon High Plains Convection in Southern Colorado

 Today we focused on the Pueblo, Colorado  CWA for afternoon High Plains convection. Scattered convection developed across the CWA leading to large hail and damaging winds. The first Severe Thunderstorm formed on our CWA border with Albuquerque and drifting south into their CWA. A second Severe storm developed and tracked north towards our DSS Event in Pueblo, bringing the potential for large damaging hail and strong winds.

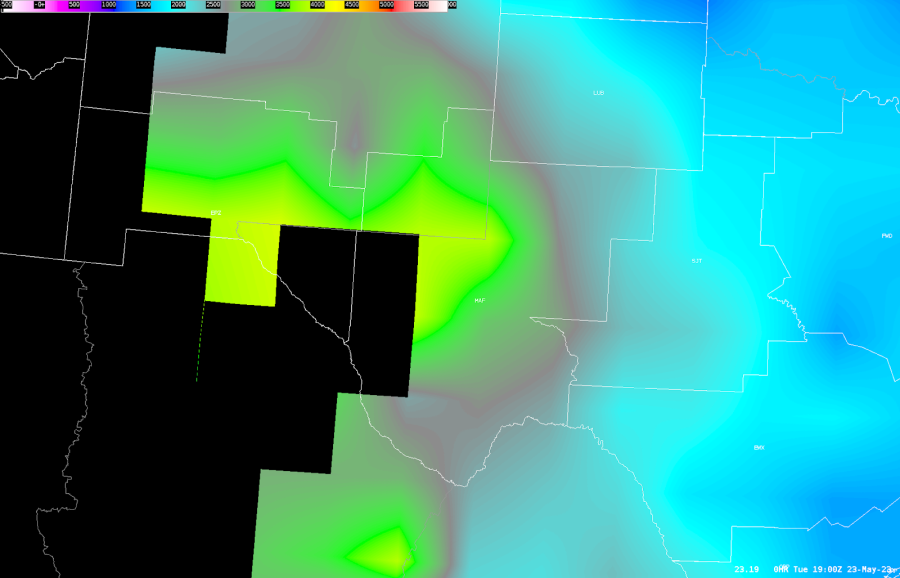
15Z PHS MUCAPE valid at 18Z showed around 2000  to 2500 J/kg for green areas while areas in blue had roughly 1000 to 2000 J/kg.
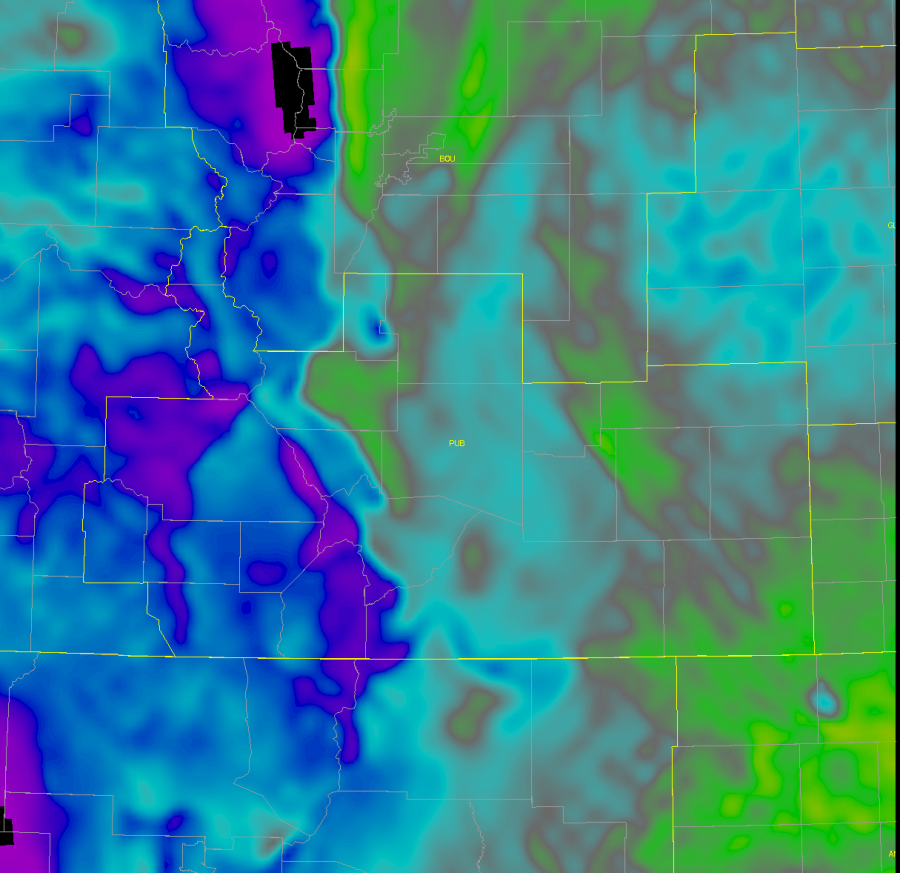
SPC MUCAPE Mesoanalysis valid at 18Z shows similar trends to the 15Z PHS MUCAPE values.
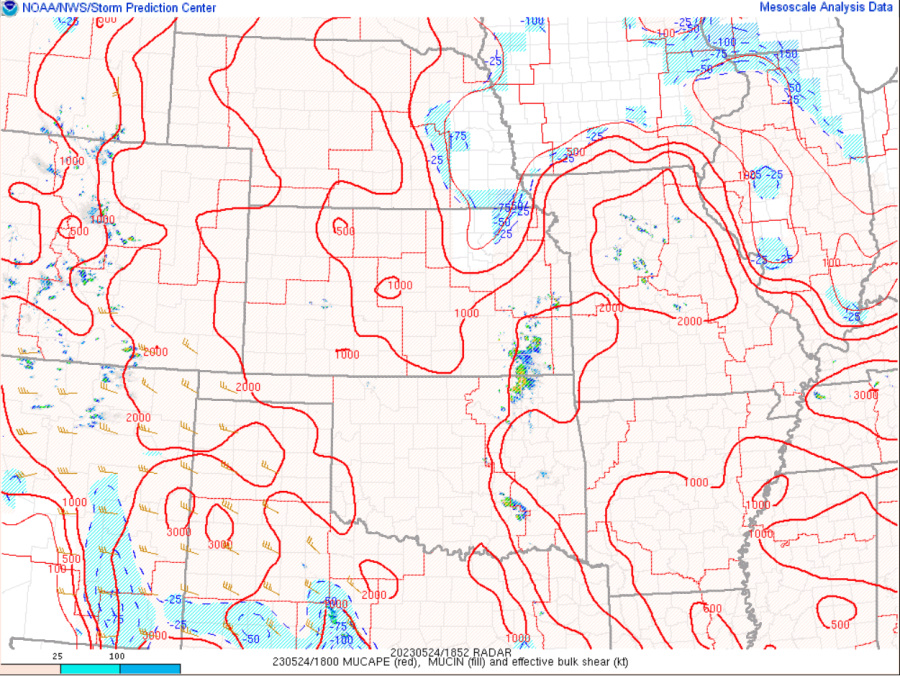
16Z PHS valid at 21Z showed a slight upward trend of MUCAPE in the eastern half of the CWA. 
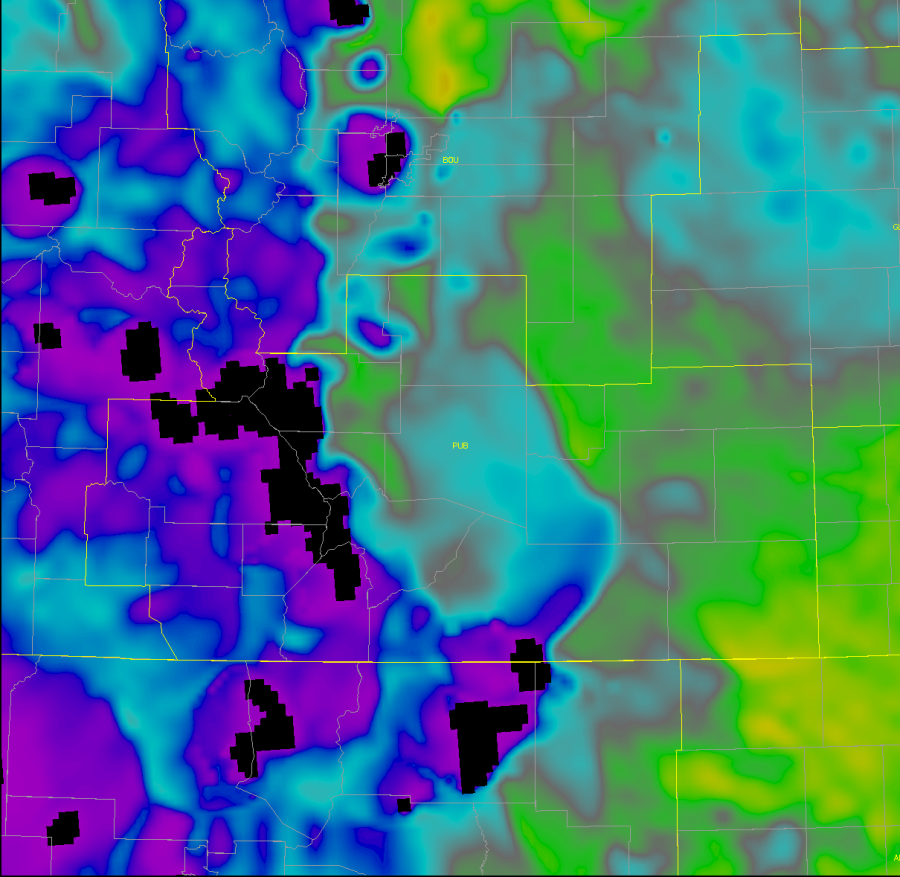
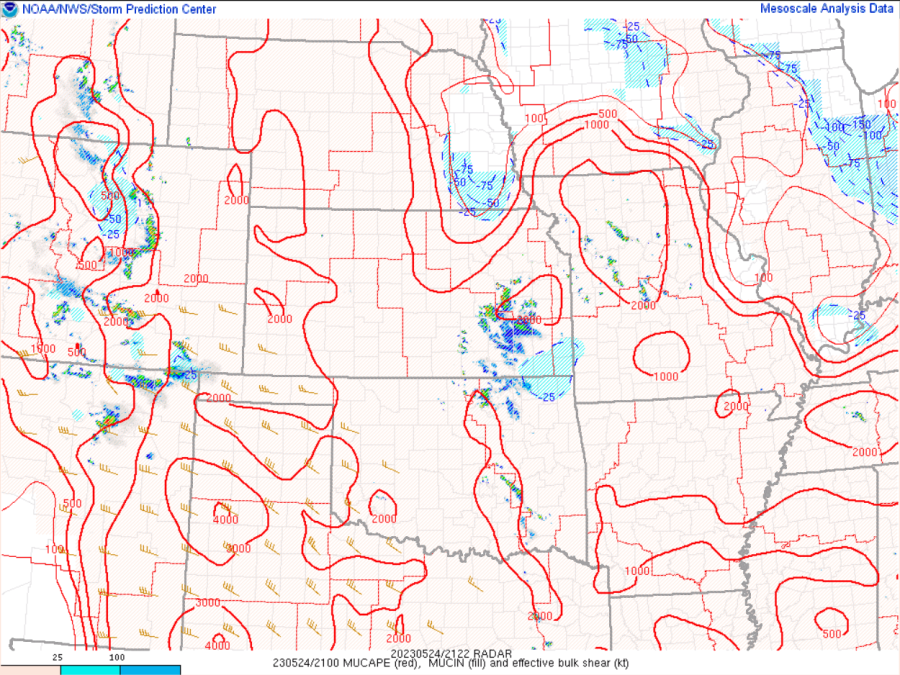
21Z SPC Mesoanalysis showed increasing values of MUCAPE developing just south-southeast of the CWA, similar to the 16Z run of the PHS shown above. 
 

15Z PHS STP valid at 18Z showing little overall threat for tornado concerns through early afternoon, for the most part values were less than 0.25. 
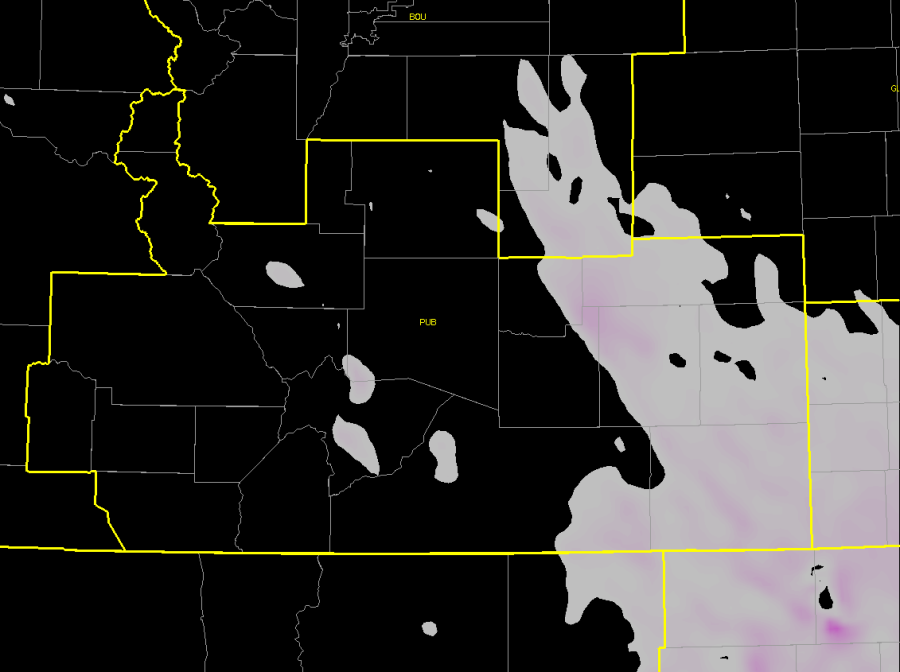
SPC Mesoanalysis page showing 18Z STP values similar to the 15Z PHS forecast. 


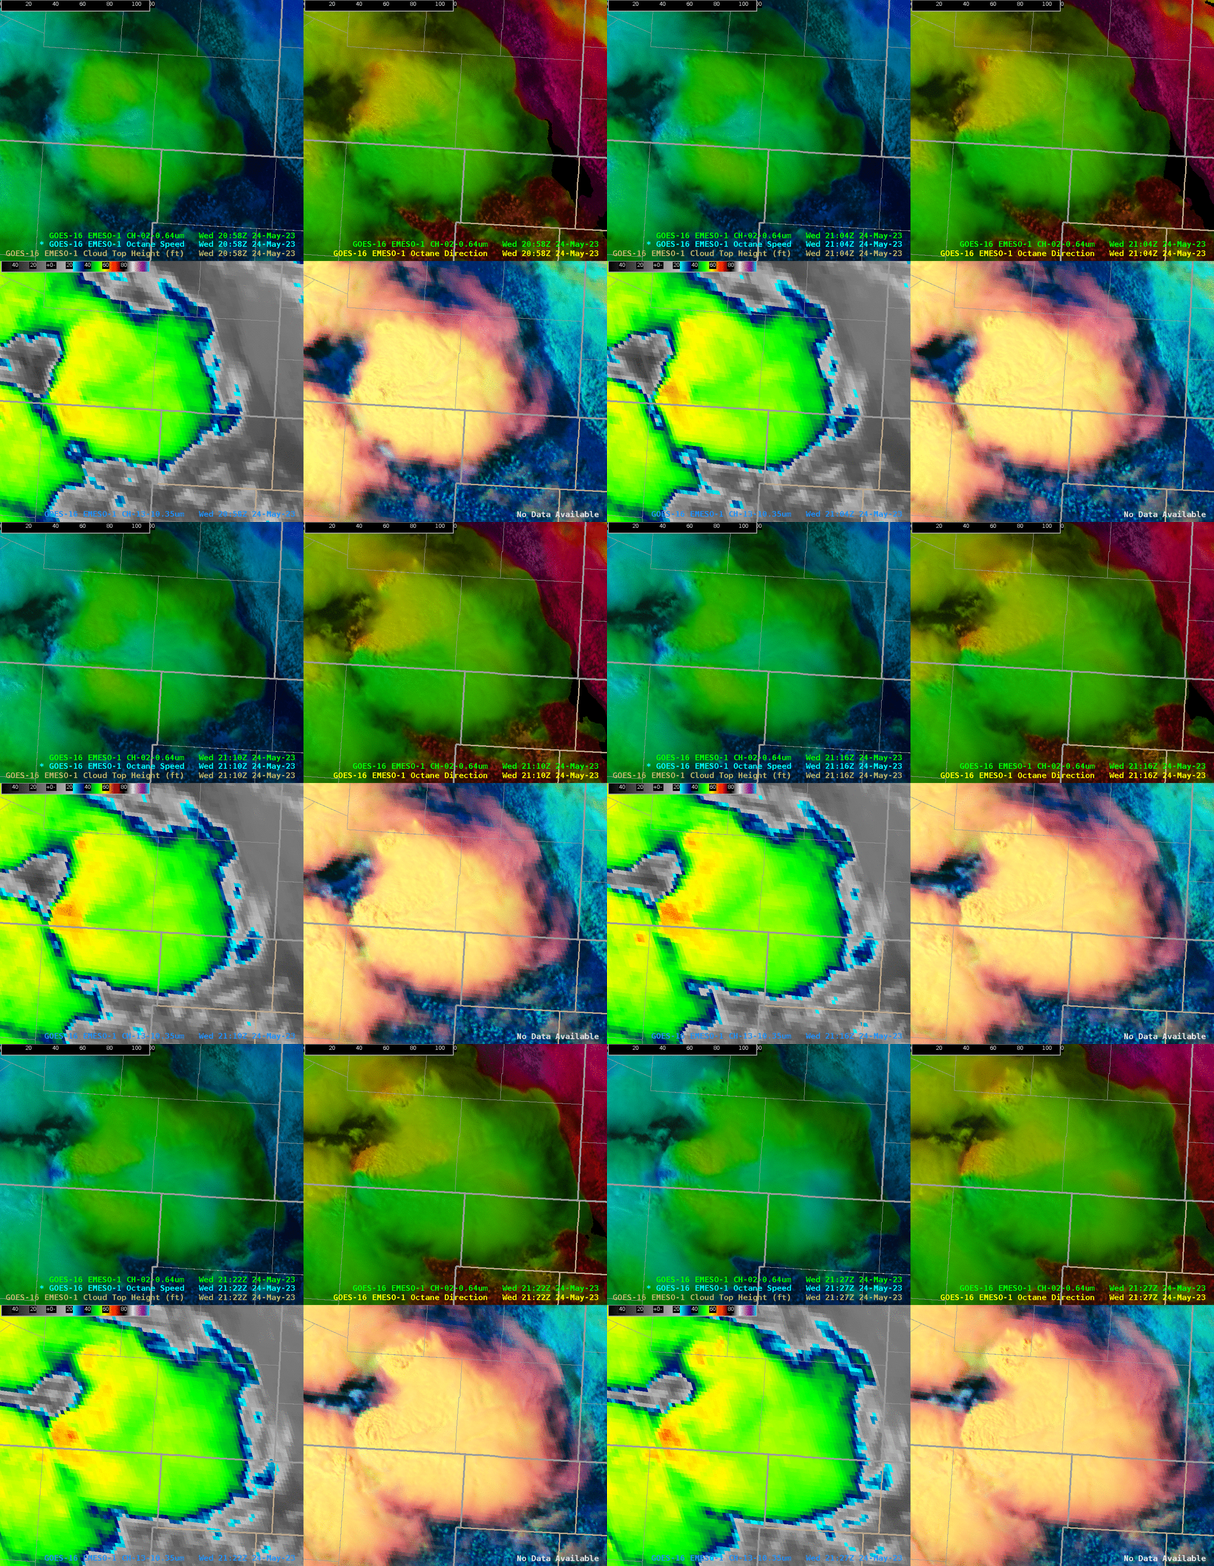
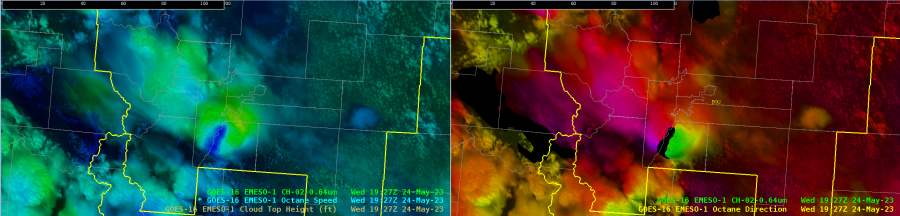
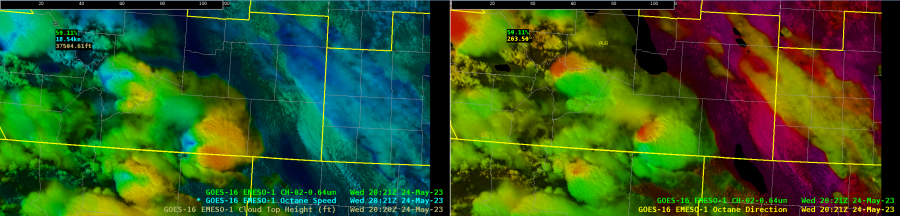
The image below shows the Octane Speed product on the left and the Octane Direction product on the right, focusing on a cluster of activity near the Jefferson/Douglas County line in Colorado. Picked this screen capture as it showed a wide range in values, mainly for the Direction product. The Octane Speed product shows some speed shear present with the lighter speeds (darker blue, ~5 kts) transitioning to brighter green/a bit of yellow (~30 kts). The magnitude of directional shear was higher, showing direction of motion/divergence ranging from ~170 degrees (core of red area) to ~295 degrees (core of green area).
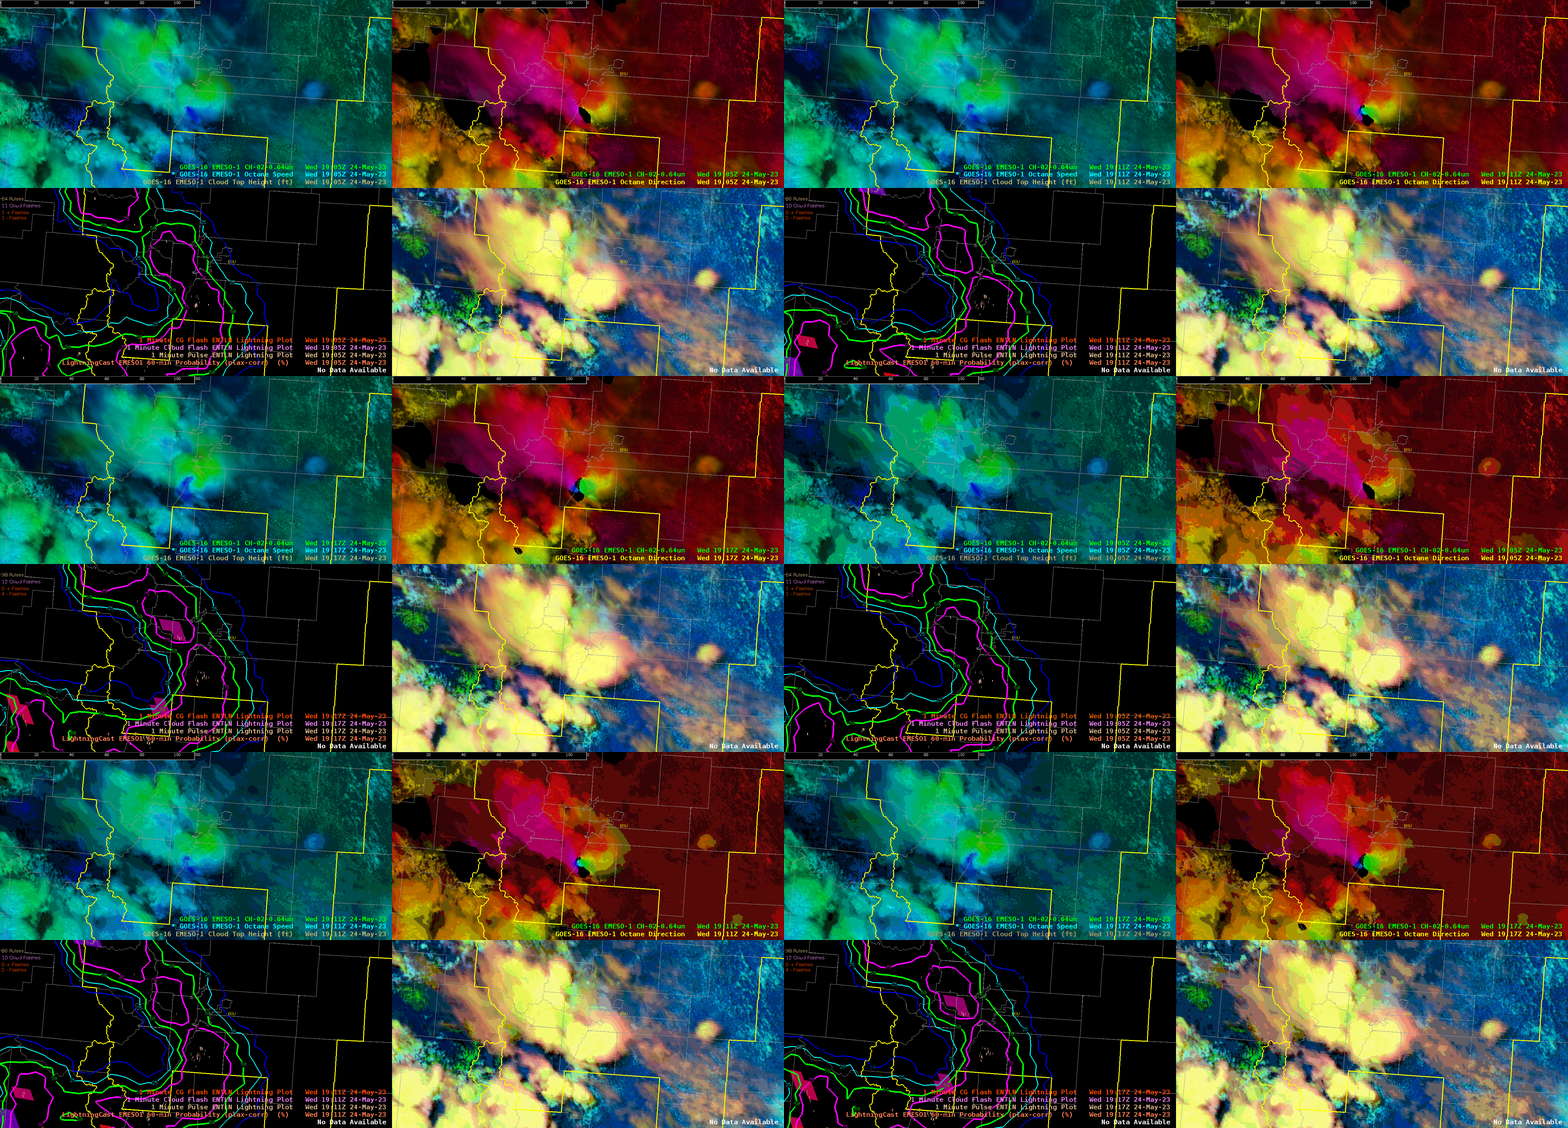
Below is a animated graphic showing the transition in both products. 
----------------------------------------------------------------------------------------------

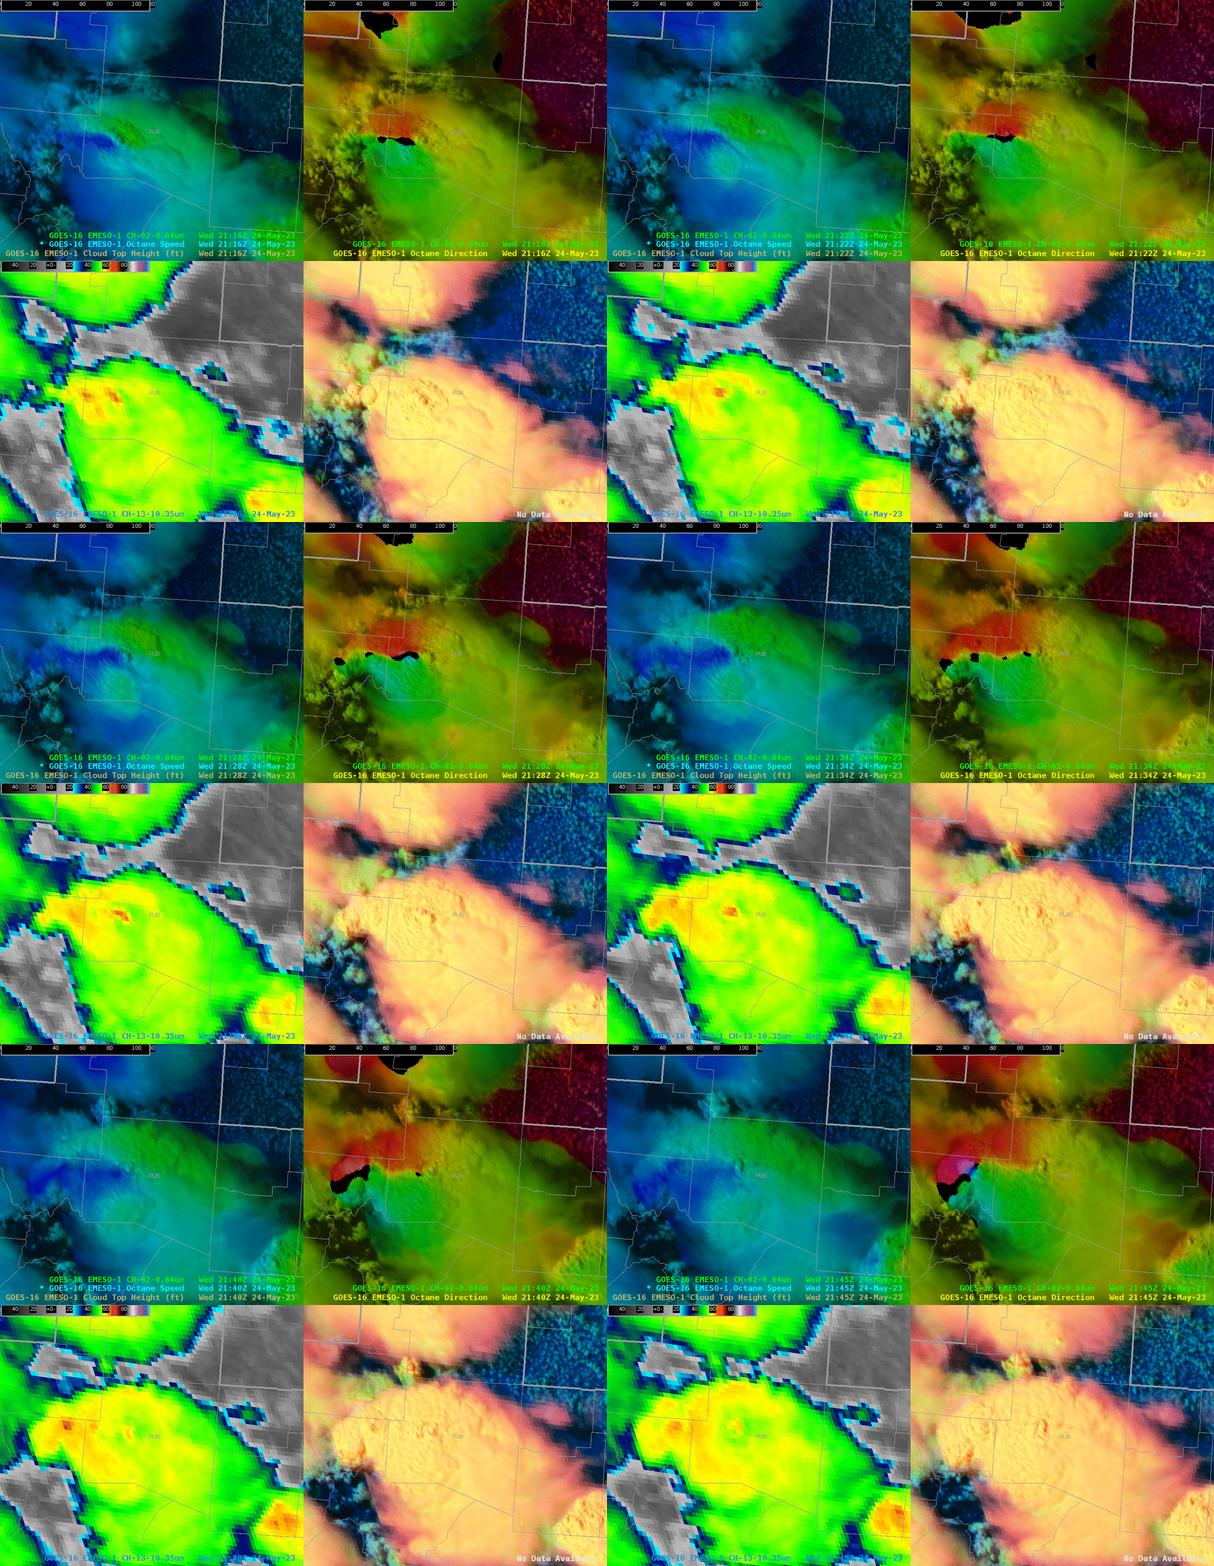
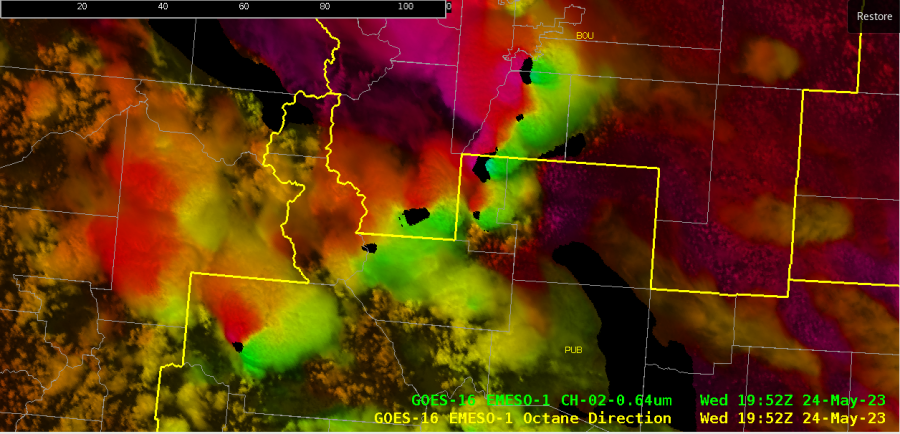
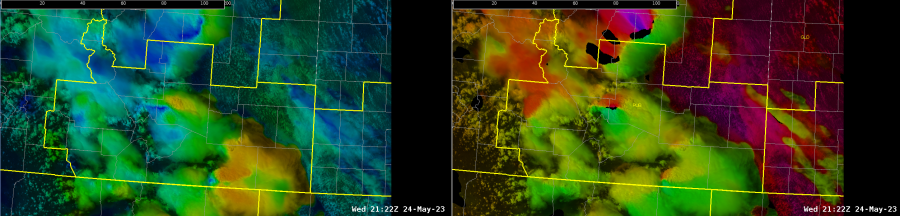
Chose to grab this Octane Direction product screen capture as it shows an elongated area of storm top divergence through central Colorado.  The red/magenta colors show direction generally from the 170-190 degree range, while the green/yellow colors show values from the 275-285 degree range. The black areas are spots of data dropout, which can occur when the speed shear product drops below 5kts.
----------------------------------------------------------------------------------------------

First Severe Thunderstorm Warning issued for this area today came right after 20Z, based on ProbSevere values/time series as well as the Octane Speed Sandwich product. 
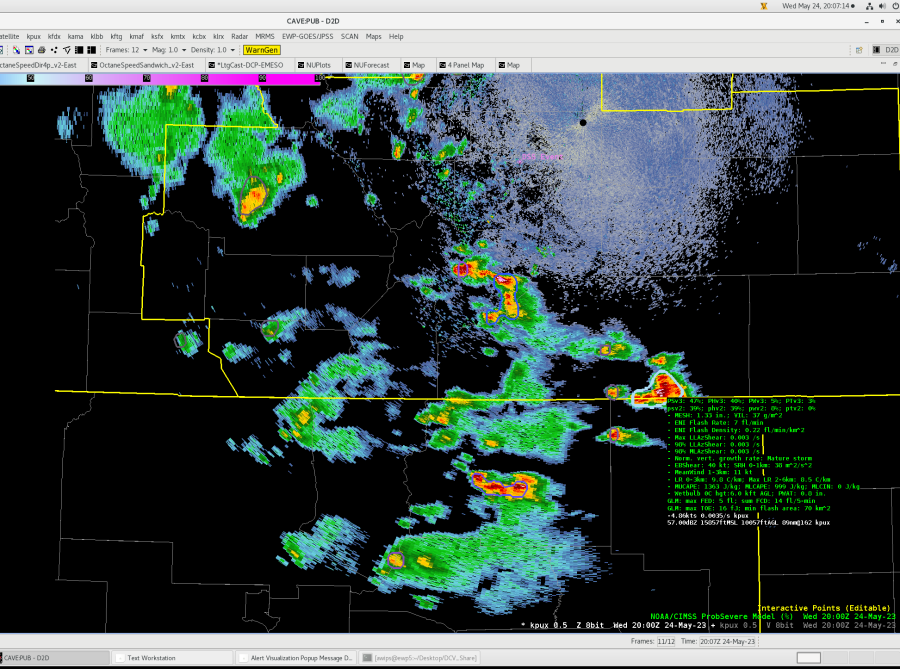
Probabilities ramped up quickly for both ProbSevere and ProbHail on this storm at the edge of the PUB/ABQ CWA boundary.
 

Octane around "peak" of the storm.
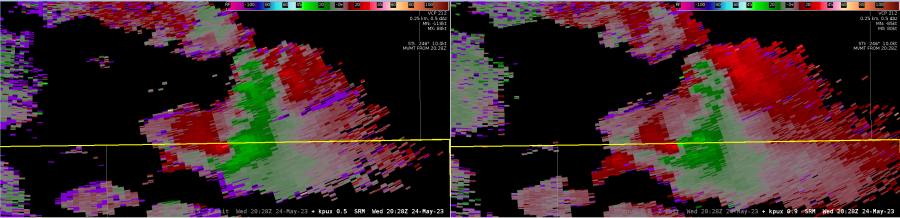
Low Level SRM and ProbSvr (0.5 deg slice is about 10.8k ft AGL)
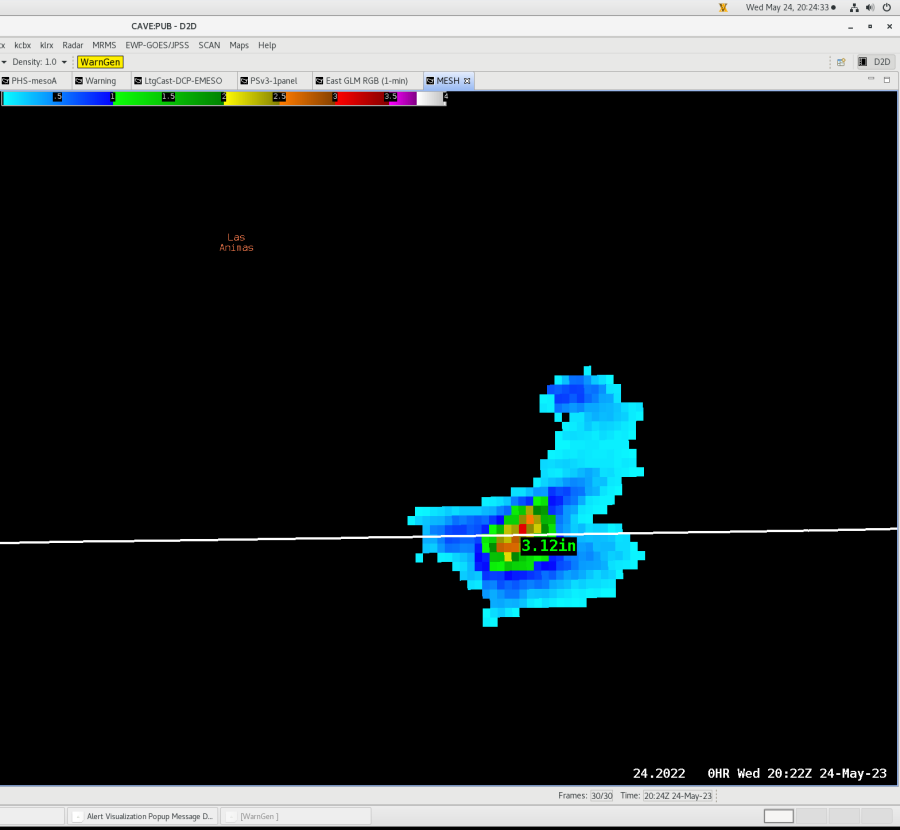
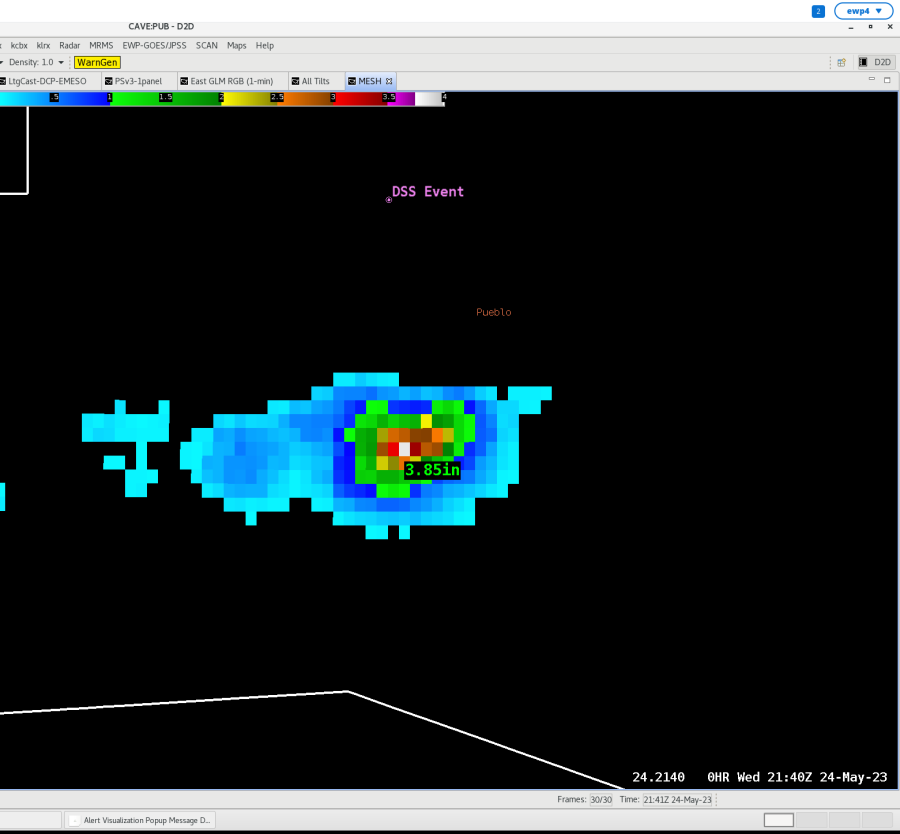
Mesh showing 3 inch hail on the border of the Pueblo CWA.
 

ProbSevere and ProbHail maxed out at roughly 90% while the storm remained severe. This storm eventually moved into ABQ's CWA.
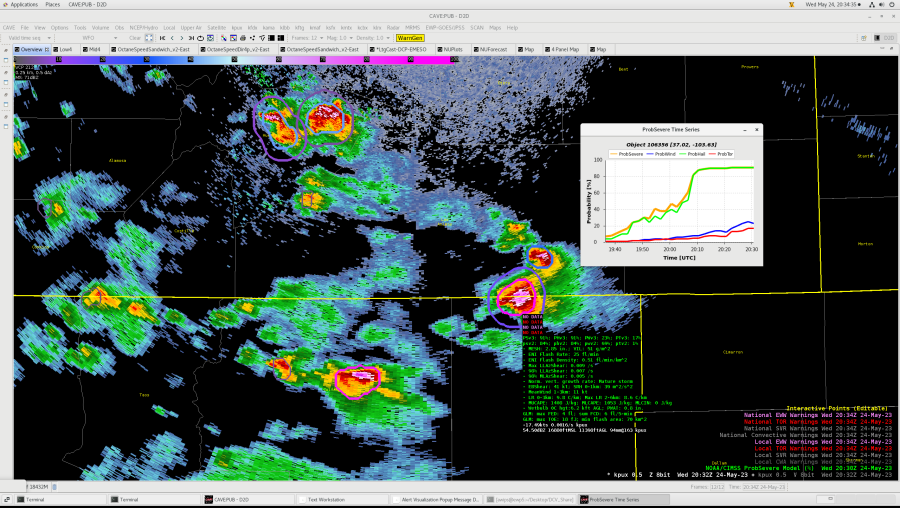

2nd Severe Thunderstorm Warning - Huerfano County

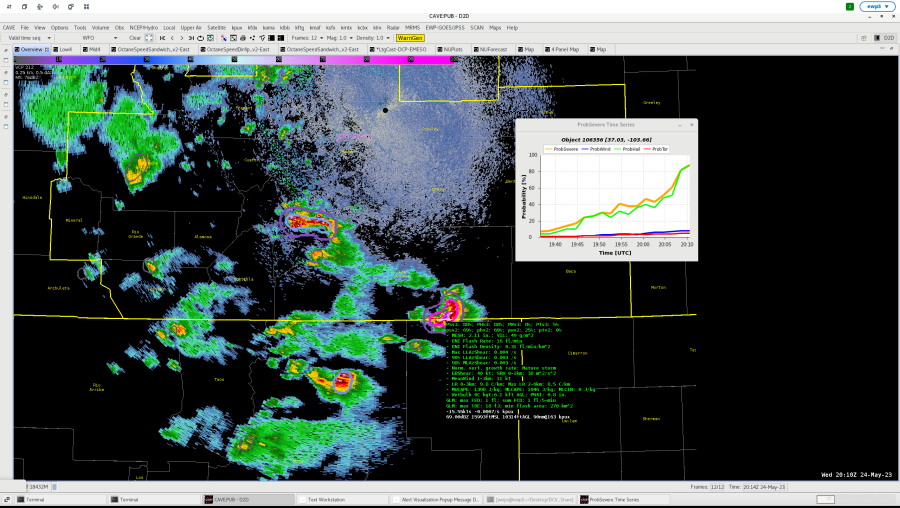
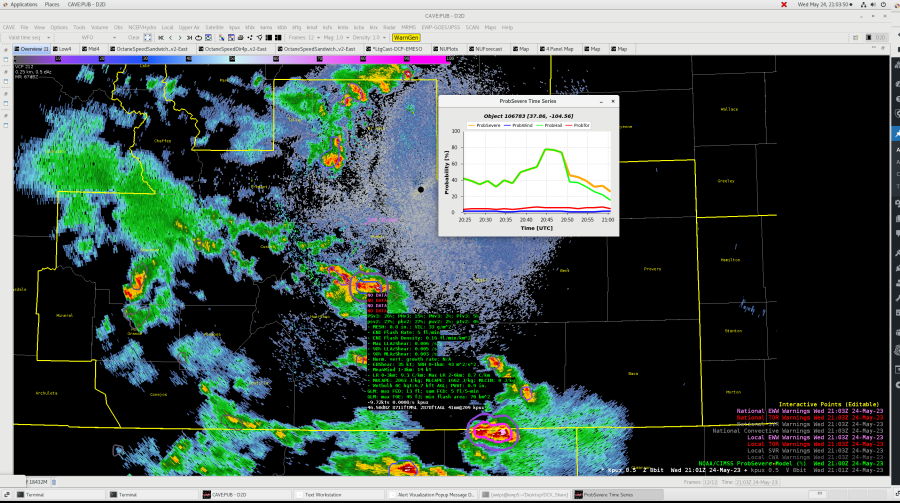
ProbSevere values and time series for 2nd Severe Thunderstorm Warning of the day, readout is at its "peak"...around 2045Z.
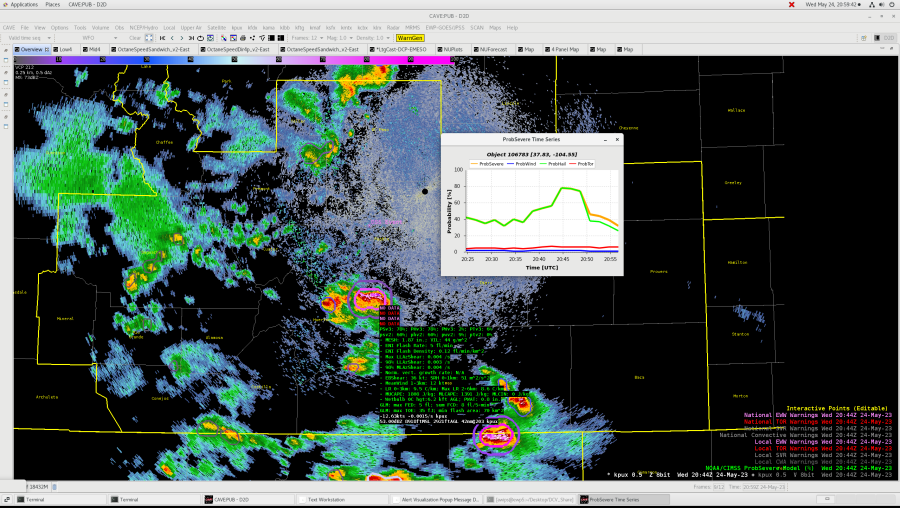

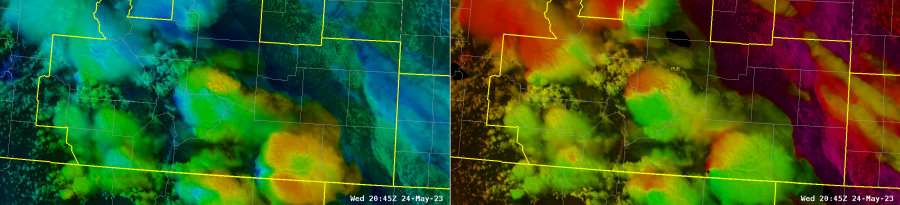
Octane Speed/Direction at "Peak" of the storm,  around 2045Z. Directional shear varied from ~205 degrees (reds) to ~285 degrees (greens).


ProbSevere showing the weakening trend of the storm gave us confidence that the storm was in fact weakening. 
 

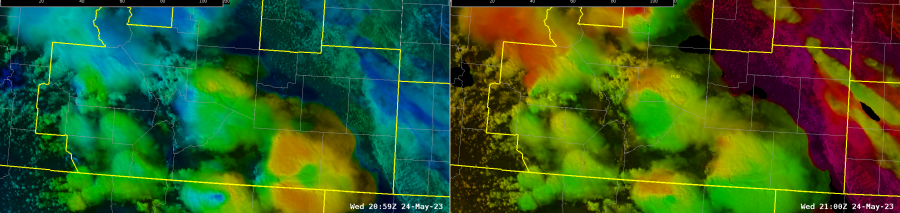
Octane speed/direction further confirming the weakening trend as colors become more diffuse in nature.
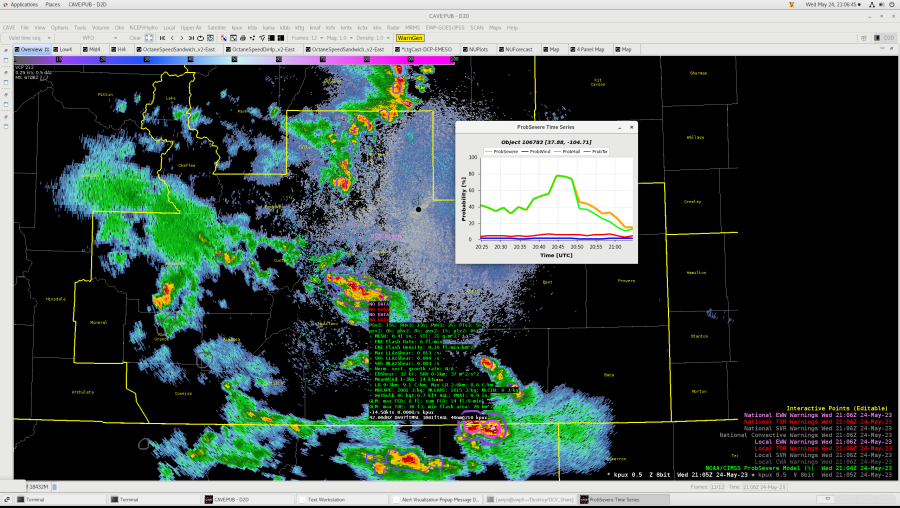
ProbSevere showing continued weakening trend. We decided not to issue another severe thunderstorm warning on this storm based on the trend.
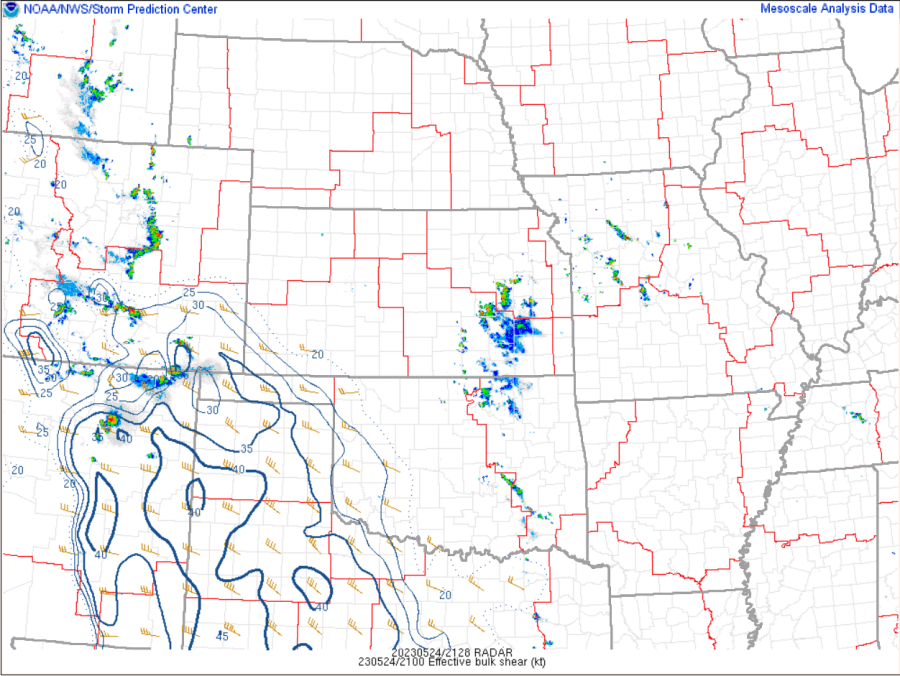
Though this storm showed a weakening trend, it was a short-lived trend, as it still had ~2000 j/kg of MUCAPE and effective shear around 30kts to work with as it tracked farther north.
 

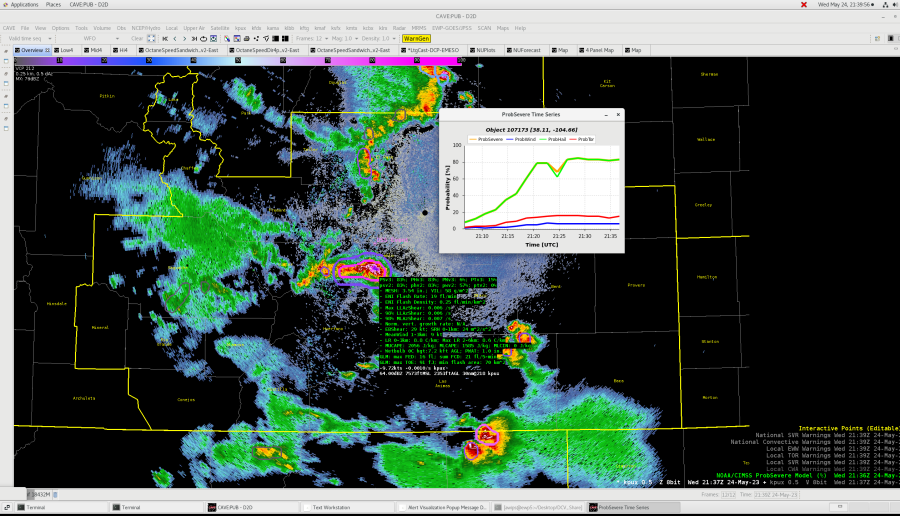
The storm ended up re-intensifying, as shown by the ProbSevere output/time series below. We went ahead and issued another Severe Thunderstorm Warning for very large hail. 
 

An increase in both storm top speed/directional shear was also shown by the Octane product.
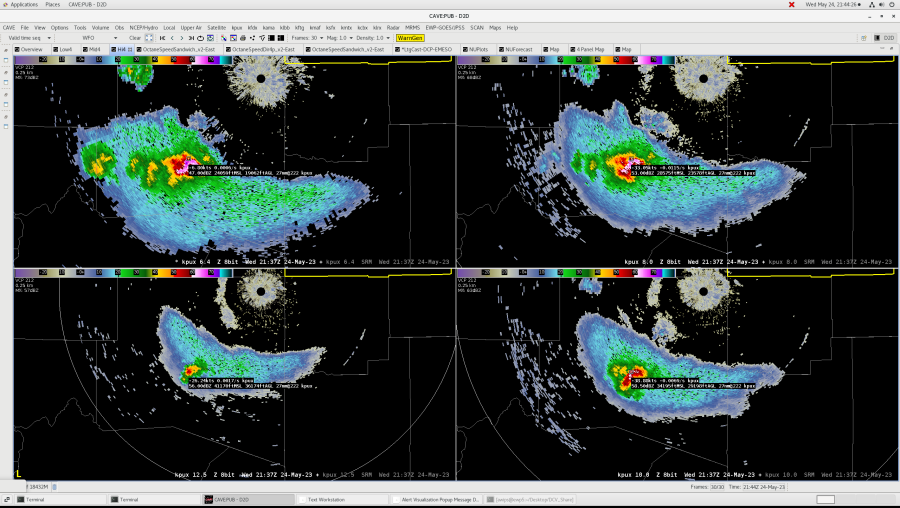
The level reflectivity images show an impressive core peaking in the 36-40k ft range, shown in the 12.5 deg. slice.
 

MESH showing nearly 4 inch hail south of our DSS event in Pueblo. The event was notified about the potential for large damaging hail.
 

-Dwight Schrute/Bubbles
Satellite HWT Day 3 Carl


Wednesday Satellite HWT Thoughts

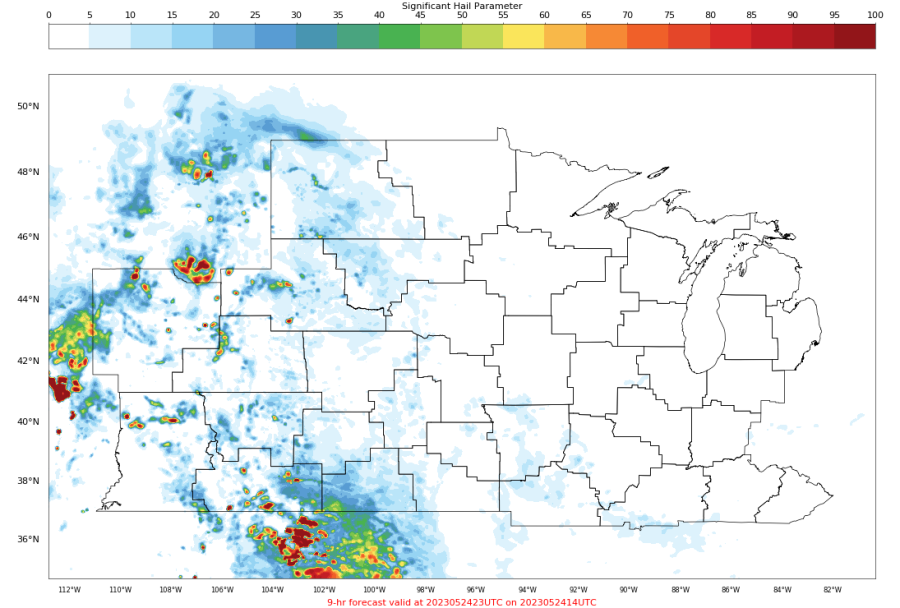
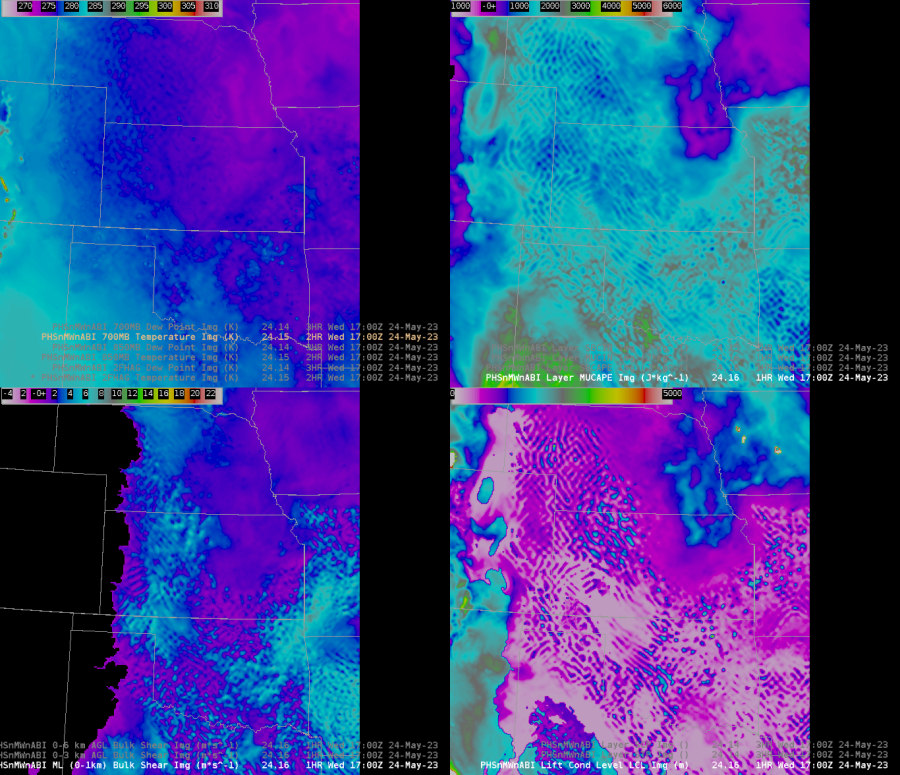
PHS Model Comparisons and Thoughts

Above: Top is HRRR SHIP parameter, bottom is PHS SHIP parameter.

Looking at some of the convective parameters and indices around the CWA I was working with today (PUB), one thing that really stood out to me was how "splotchy" many of the parameters were when compared with the HRRR model. It's very hard to believe that the model, especially at a 3 km resolution, is able to obtain that level of accuracy with regards to these parameters, or at the very least having gradients this sharp in many of these parameters doesn't make much sense. Wondering if some of it is being driven by the extreme CAPE gradients that do show up later on, which are certainly going to be drivers in many of the severe indices.

Another thing I noticed is what looks to be a wave-like numerical instability within the first hour of the model - this could be having some big impacts on the model forecast, as you can see these reflected in the base fields (T, u, v, etc) and then having impacts on many of the other derived parameters that last through the forecast period, as shown in the image below:

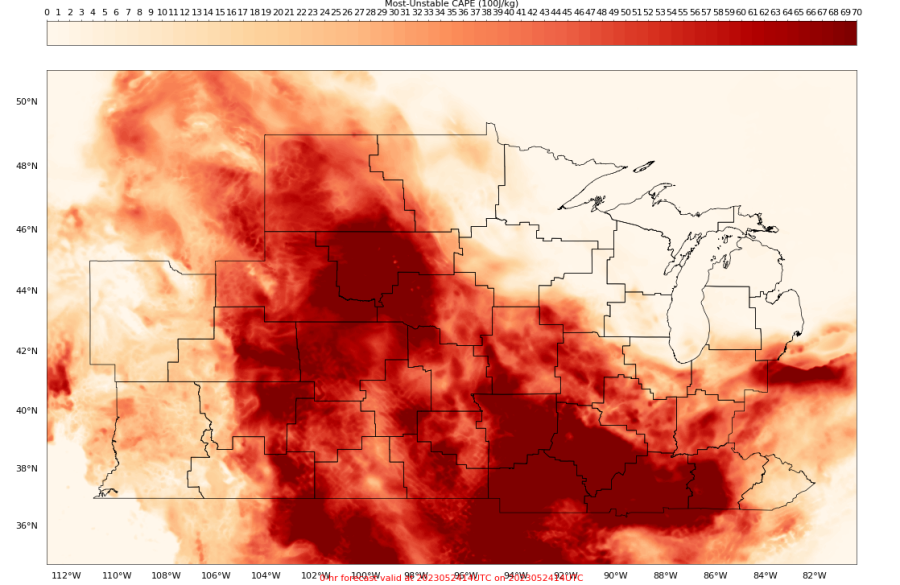
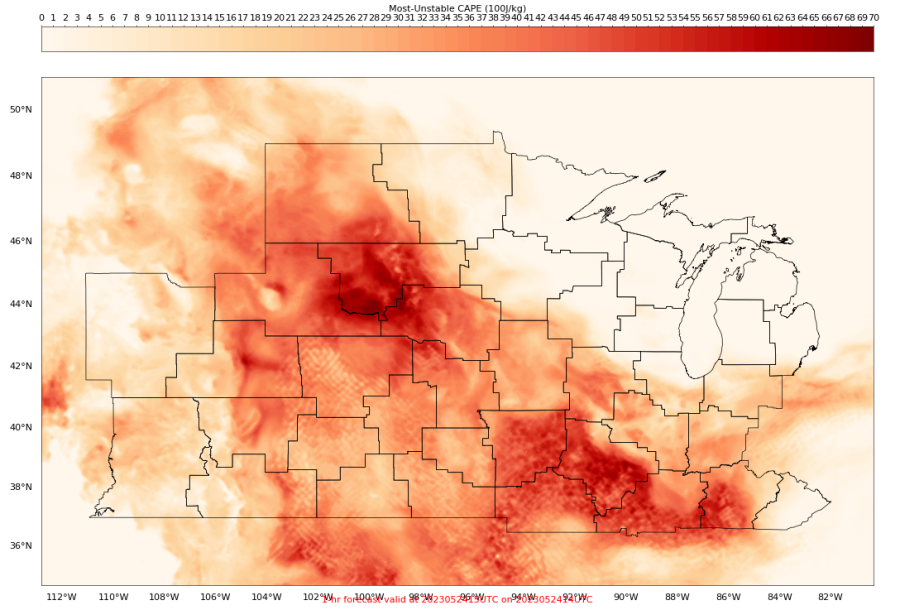
CAPE also seems to initialize really high, then "jump" down to a lower value at the first hour. This is quite a large "adjustment" from the initial conditions that the model seems to start with. Shown below are hour 0 of the 14Z run and hour 1 of the 14Z run from Wednesday 5/24.

You can also see the numerical instability within this field that is in place across a large portion of the domain.

OCTANE

Octane was able to capture an interesting view of the Above Anvil Cirrus Plume on a very powerful storm along the New Mexico/Colorado border during the afternoon hours. The cirrus is a bit slower than the surrounding clouds within the sheared environment, providing that "V" type shape that we've come to associate with some of the strongest updrafts:

Another good example of using Octane for surveillance of storms - the direction product really highlighted another storm that quickly grew on the flank of another severe warned storm. Big value especially in areas where radar coverage might be limited by mountains, such as in the CWA I was working in today (PUB):

LightningCast

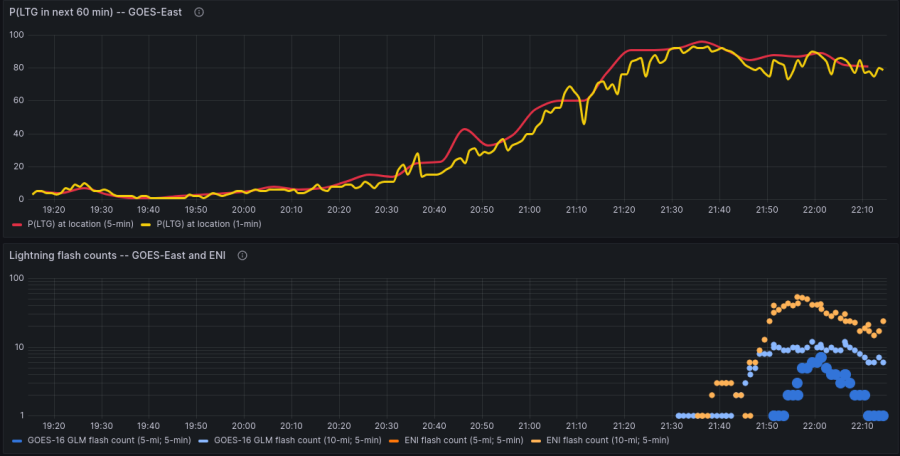
Used the LightningCast product extensively for DSS purposes today. We had a pretend outdoor event located in Pueblo, Colorado. A very strong thunderstorm (MESH estimated nearly 3" or larger hail at one point) which passed within a few miles to the south and east of the city. I used the LightningCast probabilities in AWIPS overlaid with satellite data to provide multiple updates to Emergency Management, using it to confidently state that probabilities of lightning were increasing as storms approached from the south. Lead time for action would have been within the 45 min to 1 hour range. Was able to confidently say they would see lightning within the 10 mile range a good 15-30 minutes before the first strike occurred within the range per the ENTLN network data. Below is the LightningCast time series as output on the webpage for the KPUB airport, which is very close to where the DSS event was taking place:

There is definitely some very actionable lead time here. As a forecaster, having this type of data available to me outside of AWIPS is a game changer. I know it may be challenging, but being able to click on a point like this and get this type of information would be huge for briefings and emails with decision makers. Right now we are limited to airports. Even a relatively coarse mesh that would allow me to pick a close point would be extremely useful if these images can't be generated on the fly. Other possible ideas include only generating points within a certain LightningCast threshold (say 10%), or generating them on the fly based on a click query. That all said, even in its current form I will be using it going forward, and making a point to share it with my office and WCM for DSS.

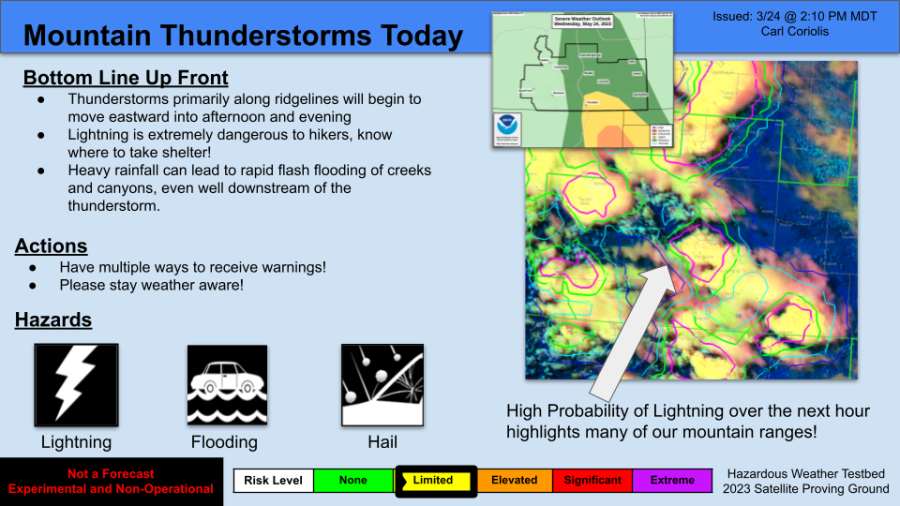
I also made a social media type graphic using the LightningCast product for hikers, given the large number of mountains within the CWA. Perhaps would have been a bit more meaningful to have sent this as storms were beginning to form, but they were already cooking once we got spun up and started. Highest probabilities were hugging the mountains where storms were forming. If I were formally posting to social media, I may have added some lightning safety graphics or something to that effect as part of the post (twitter thread, multiple images in Facebook post).

GLM RGB

This product does a great job in my opinion combining information from the FED and MFA. I found it useful for detecting lightning jumps within storms while still maintaining information about the overall coverage of lighting. Would happily use this as my primary GLM viewing option in AWIPS.

-Carl Coriolis


Just a couple of central Texas hailers

Forecasters in moisture-poor Midland, TX yesterday were peeking into central Texas with envy, as surface dewpoint temperatures and resultant CAPE were much higher. One testbed forecaster noted that ProbSevere LightningCast was his first indication of strengthening convection to their east (Figure 1).

Figure 1: ProbSevere LightningCast contours, GOES-16 day-cloud phase distinction RGB, and GOES-16 GLM flash extent density for two storms in central Texas.

ProbSevere v3 later had a handle on these storms, which developed in an environment of strong CAPE (> 3000 J/kg) and modest effective shear (35-40 kt). Strengthening radar signatures, moderate satellite growth rates, and increasing total lightning flash rates helped to boost the PSv3 probabilities. PSv3 again ramped up probabilities before PSv2, whereas PSv2 probabilities were higher at peak maturity. Each storm produced severe hail (1.5" and 2" diameters, respectively). 

Figure 2: ProbSevere v3 contours, MRMS MergedReflectivity, and NWS severe weather warnings for two storms in central Texas. 


Tuesday, May 23, 2023

Two-inch hail on New Mexico/Texas border

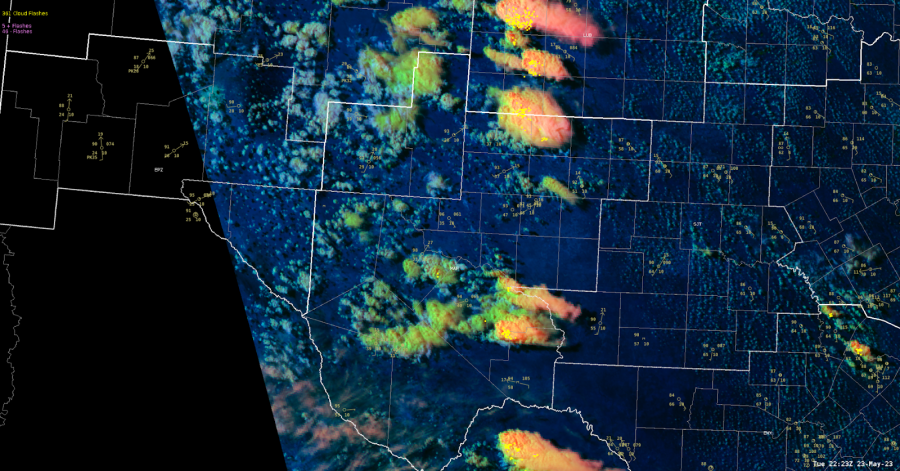
Two-inch hail was reported on a storm on the New Mexico/Texas border, just on the edge of the Lubbock, TX CWA (Figure 1). At 21:04 UTC, 56 minutes prior to the report, ProbSevere v3 (PSv3) was 58% while PSv2 was 8% (Figure 2). At that point, the low ENI and GLM flash rates (≤ 4 fl/min) and modest environmental shear (≤ 30 kt) was dramatically reducing the PSv2 probabilities, whereas the shear was higher in PSv3 (36 kt) and the PSv3 models are less affected by low lightning (note: this storm eventually became well-electrified). The team in Lubbock today has noted how high PSv3 was prior to PSv2 early in the storms' development. While this is not always the case, it was true in Texas today because of the dearth of lightning early on.

Figure 1: ProbSevere v3 contours, MRMS MergedReflectivity, and NWS severe weather warnings for a storm on the NM/TX border.
 
Figure 2: Time series comparison of PSv2 and PSv3 for the storm in Figure 1. The annotation is valid for 21:04 UTC, when PSv2 


Lightning Initiation in Texas and Florida

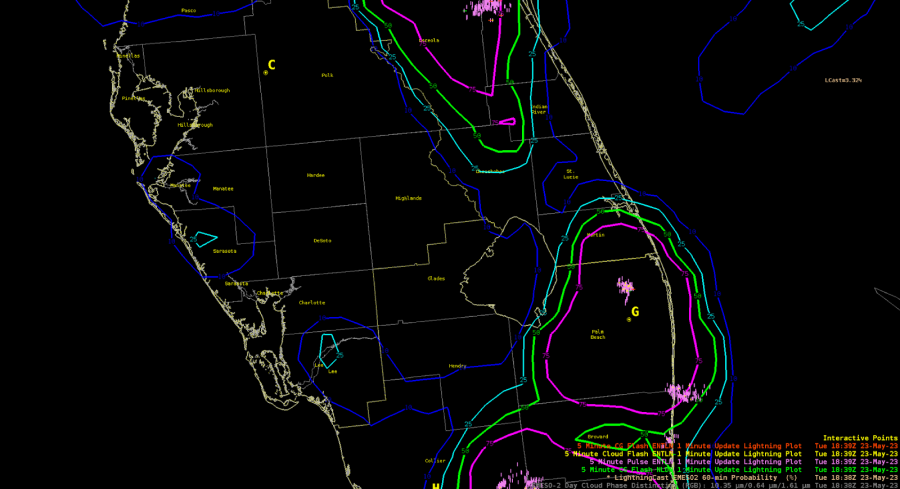
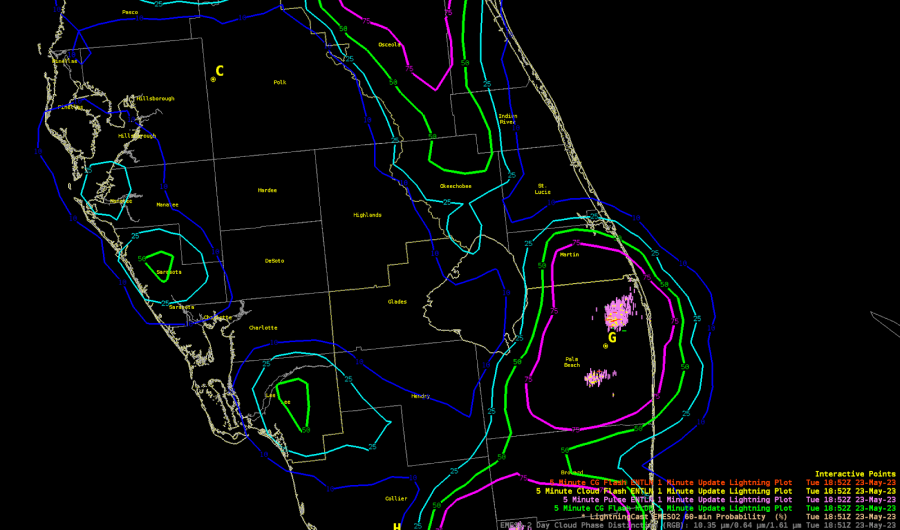
Forecasters are working in west Texas (Lubbock and Midland) and Tampa, Florida. Forecasters in both regions have noted 30 minutes of actionable lead time to lightning initiation in a number of these storms. Figures 1 and 2 show the evolution of LightningCast probabilities with GOES-16 ABI and Earth Networks total lightning points. Several forecasters have noted that it would be nice to have more flexibility in choosing LightningCast probability contour levels. Currently, the contours are customizable, but it requires a CAVE restart.

Flash rates are high in Florida, but quite low in Texas (especially early on in the storms' development). Forecasters have noted how ProbSevere v3 seems to be more resistant to these differences in flash rates, not overemphasizing the higher flash rates or underemphasizing the lower flash rates in the respective regions.


Analyzing Mid Level Lapse Rates Between NUCAPS and Model Guidance

Mid-level lapse rates are important in judging instability when combined with boundary layer moisture content in the lower levels. With boundary layer moisture being poor for much of the MAF CWA today, the low to mid level temperature profile may be even more important, as it will define both convective inhibition and CAPE potential with a greater potential for inhibition with such a dry moisture profile. The convective forecast in MAF for the day featured generally weak forcing mechanisms, focused on orographic lift and a moisture gradient on the eastern side of the CWA. With any sort of convective inhibition, it would be difficult to forecast convective initiation away from the strongest forcing points until later in the day when convection is forecast to move in from outside the CWA.

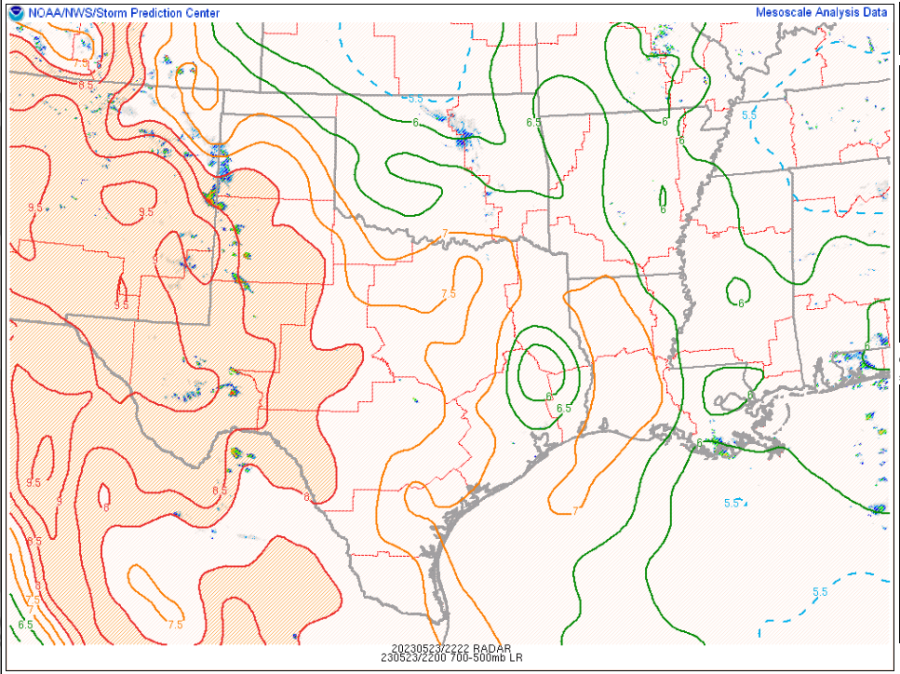
Shown below is the SPC mesoanalysis page depicting this afternoon’s 700-500mb lapse rates. The RAP guidance driving this page is showing very steep mid-level lapse rates of 8 to near 9.5 degrees/km over the MAF CWA. While steep mid-level lapse rates (indicative of cooler temperatures atop a warmer lower level air mass) are important for instability, very steep mid-level lapse rates could be due to a very warm low level air mass potentially creating a convective “cap” which may inhibit convection. With the very low surface dew points (into the 30s in some spots), a mid-level lapse rate exceeding 8.5 should mean convection struggles to initiate outside of areas of strong forcing.

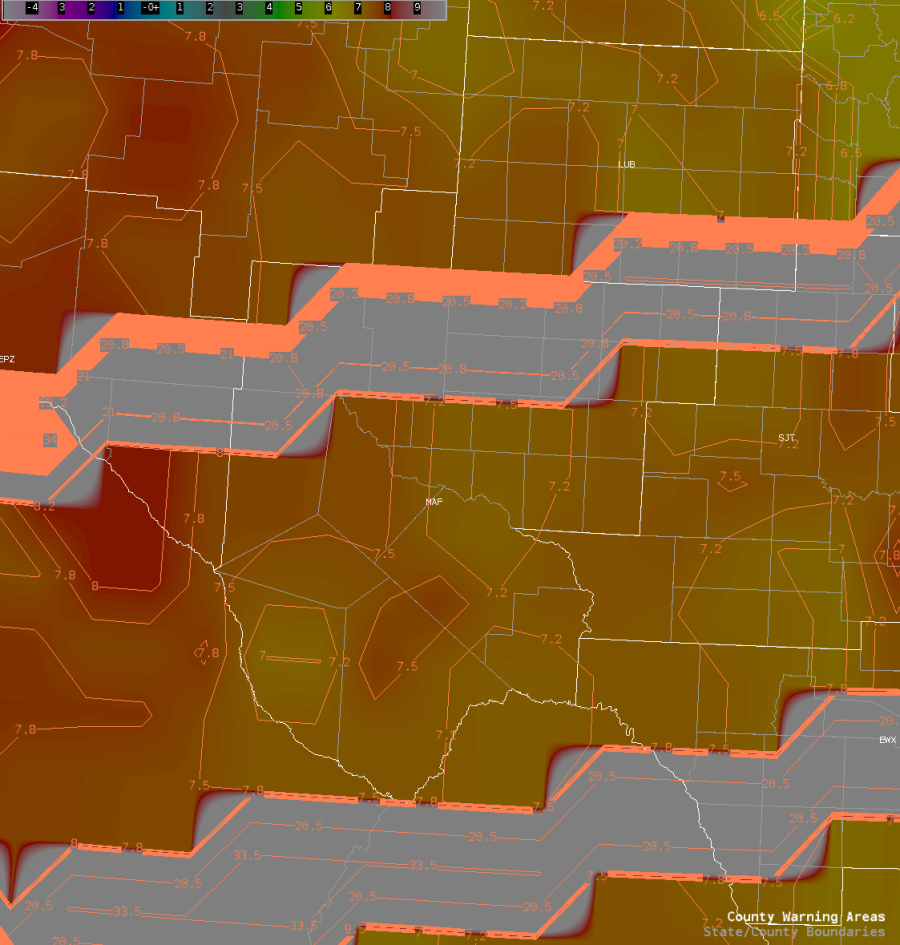
Looking at the afternoon NUCAPS satellite pass, it shows a fairly different picture for mid-level lapse rates over the MAF CWA. The observed lapse rates of 7 to near 8 degrees here are more normal for a convectively active environment compared to the 8.5 to near 9.5 degrees given by the RAP guidance.  It’s worth looking into how NUCAPS and guidance is handling temperatures at different levels to understand the differences between the lapse rates.

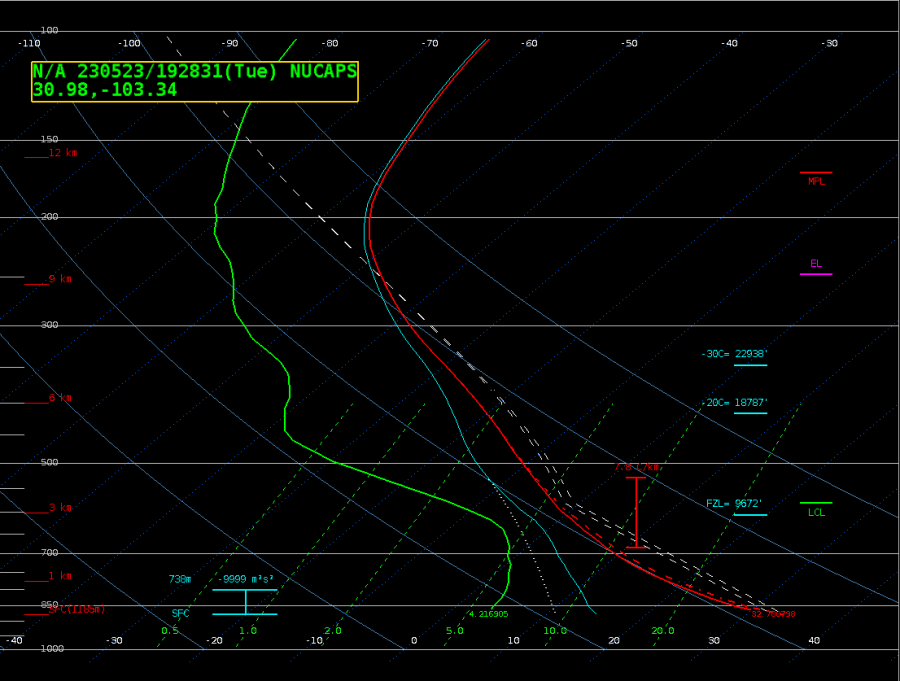
Shown below are both the NUCAPS sounding (first) and then the RAP sounding for a similar spot near the center of the MAF CWA. It’s interesting to note that it isn’t actually the 700mb temperature that is the main difference between the two soundings, but the 500mb temperature, with a 2-3 degree difference at 500mb. This could explain why there is still convection away from the previously discussed initiation points (such as out in the Fort Stockton area), however the warmer than forecast 500mb temperatures could be indicative of an environment that isn’t quite as unstable as forecast, and why the central MAF convection is notably weaker than convection well to the north in the Lubbock CWA. There are other contributing factors of course (weak surface convergence, very dry low to mid levels), but this is a major factor in judging updraft strength potential, and today lines up with where updrafts have develop but struggled to truly develop into strong or severe thunderstorms. The late afternoon Day Cloud Phase Satellite product shown below includes the non-severe convection in the south-central portions of the MAF CWA with the severe convection to the north (and their noticeably better defined anvil clouds).

One quick screenshot to show is the NUCAPS LCL product, highlighting the better moisture on the eastern and northeastern edge of the CWA, lining up with the higher SPC risk.

-Joaq

Taking a look at LightningCast in West-Central Florida.

 Thunderstorms have been gradually increasing this afternoon along the west coast of Florida, and wanted to take a look at the evolution of the LightningCast product vs when flashes were first reported. Want to note upfront, there was an issue with GLM data, so used the 5-min (1-min update) CG/Cloud/Pulse ENTLN1 lightning plots to see when activity developed.

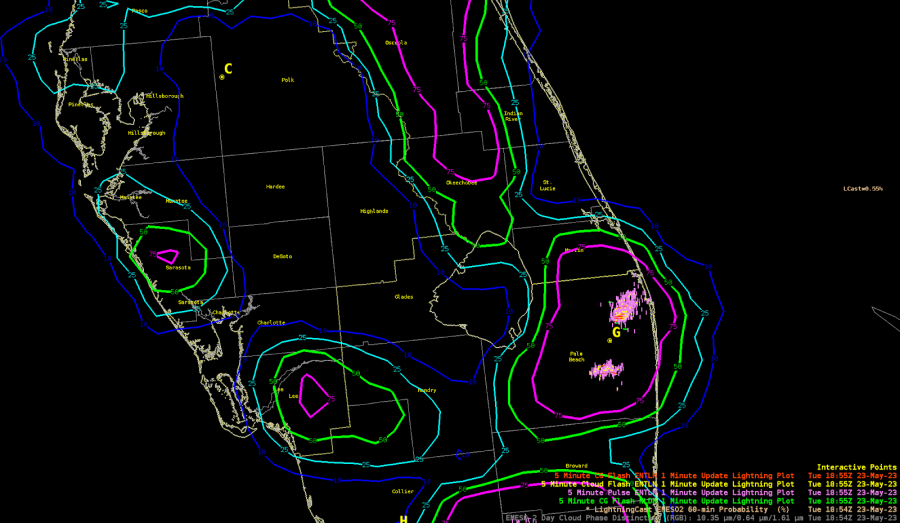
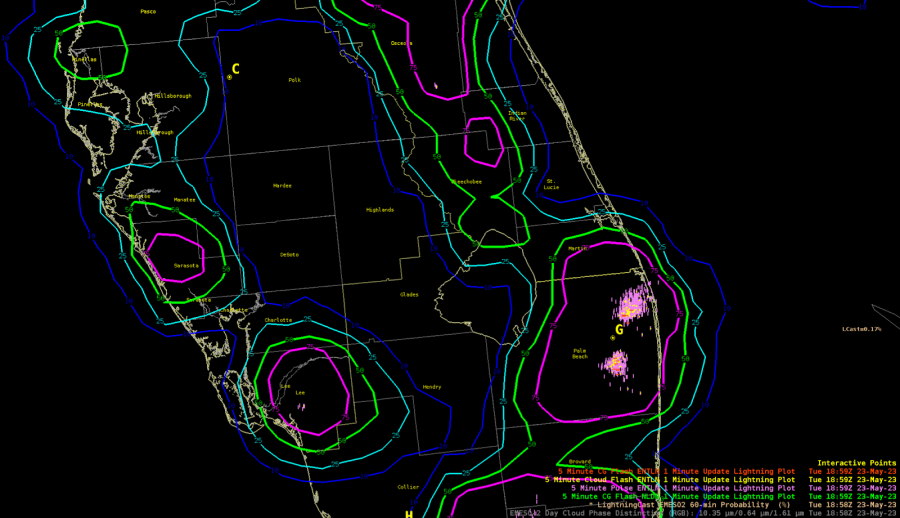
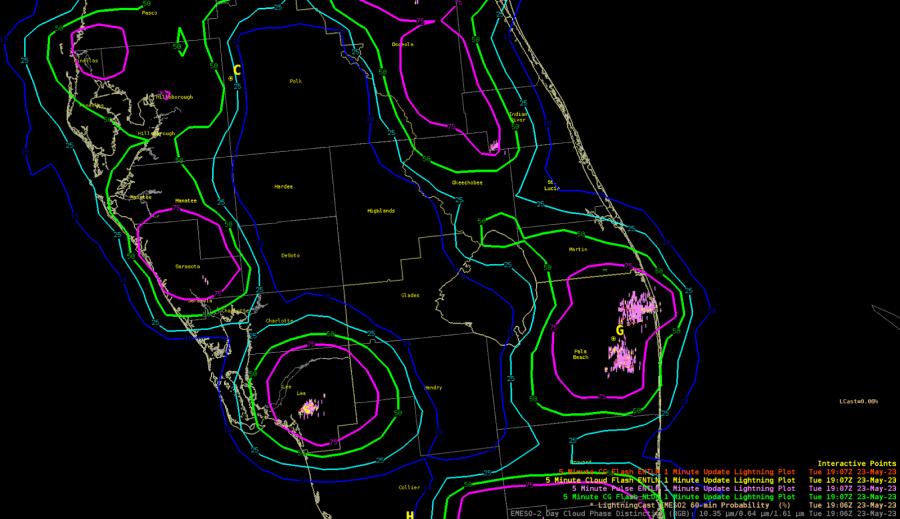
Below are images showing when the 25, 50, and 75% probability contours of lightning occurring in the next 60 minutes appeared, focused on Sarasota and Lee counties. For both counties, the 25% probability contour first appeared at 1838Z, 50% contour at 1851Z and the 75% contour at 1854Z. The first lightning strikes appeared in Lee County at 1858Z (a 20-min lead time from the 25% contour). The first strikes appeared in Sarasota County at 1906Z (a 28-min lead time from the 25% contour).

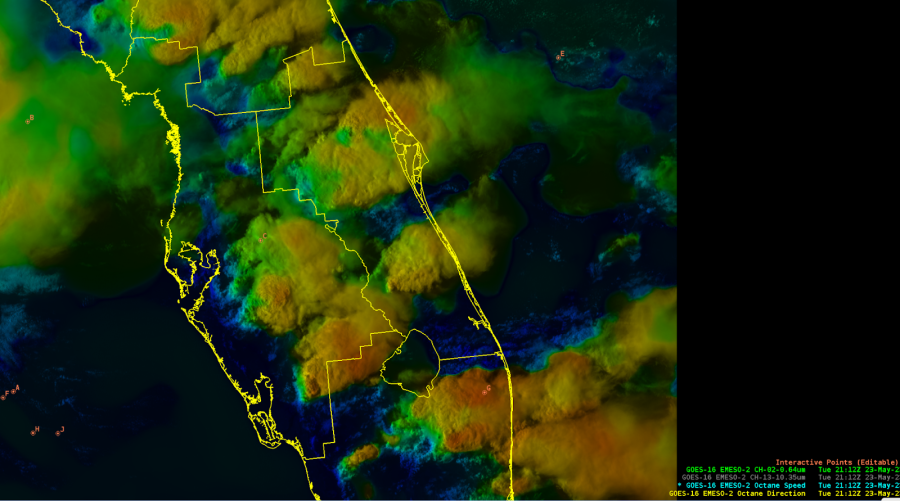
The image below shows the 25% probability contours showing up in the Sarasota and Lee Counties at 1838Z.

The image below shows the 50% probability contours showing up in the Sarasota and Lee Counties at 1851Z.

The image below shows the 75% probability contours showing up in the Sarasota and Lee Counties at 1854Z.

The image below shows the first lightning strikes showing up in Lee County at 1858Z.

The image below shows the first lightning strikes then showing up in Sarasota County at 1906Z.

- Bubbles

Brief Thought About Octane Speed-Direction

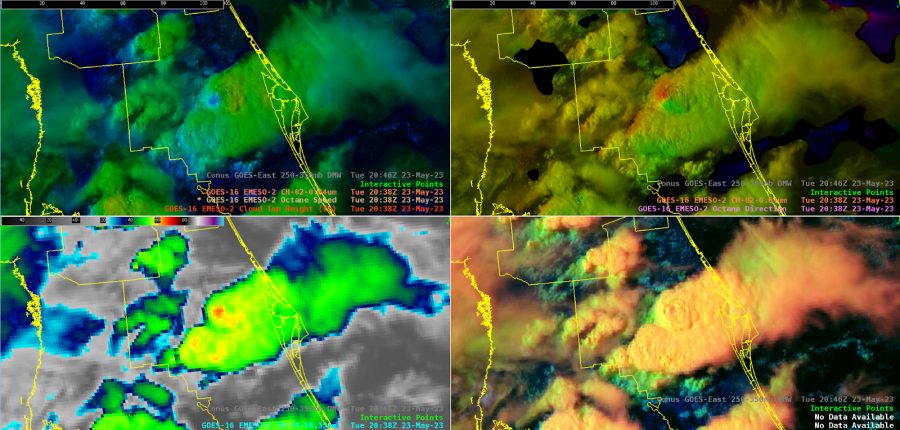
 Below is an image showing the default 4-panel procedure provided. The upper level is the Octane Speed product on top of the Red Visible Band (Channel 2), the upper right is the Octane Direction product on top of the Red Visible Band (Channel 2), the lower left is the Clean IR Band (Ch. 13), the lower right is the Day Cloud Phase Distinction RGB.

Personally, have at times struggled with what exactly the speed and direction products are showing…but especially the direction. Decided to plot the GOES East Derived Winds onto the imagery, as I am used to looking at wind direction with vectors/arrows/etc. Below is the same Octane image with the 250-350mb wind barbs. When comparing the sampling/data readout of the Octane direction and the derived winds, they were within a few degrees.

Perhaps an option going forward would be to have a single panel Octane procedure with the speed shown as the color, continue to have the direction in the background that shows up when sampling the data (image below), but then at least have the option to load the the direction data as an arrow/barb/etc. Having the barbs show up as the default in a dense enough of a manner that it’s useful may use up too much AWIPS power and drag it down.

- Bubbles