Wednesday, June 15, 2022

Comparing profiles and instability

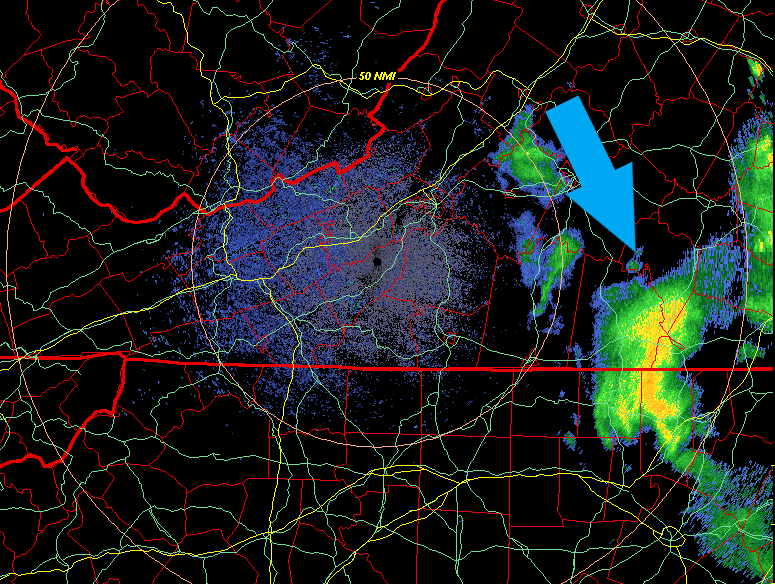
 For the RNK CWA today, new afternoon convection didn’t materialize, although residual precip and cloud cover exited the eastern CWA to the southeast (blue arrow in KCFX 0.5 Z below from ~19Z) and seem to have left stable air behind.
The corresponding visible satellite for the same time is shown below.


Only the western half of the CWA looked to remain sun-lit, with potential for additional development. Although there wasn’t much forcing, initially the airmass looked unstable, but how unstable was it really?

Looking at the RAP forecast valid at 19Z below (point B corresponds to the KFCX radar location), around 4000 J/kg are forecast.  It’s worth noting, the RAP model did correctly capture the relatively low CAPE to the east, in the stable area where previous precipitation was still exiting.

However, leveraging polar hyper-spectral sounding and ABI combined modifications to a RAP-like model, the following PHSnABI derived CAPE can be compared to the RAP forecast above.
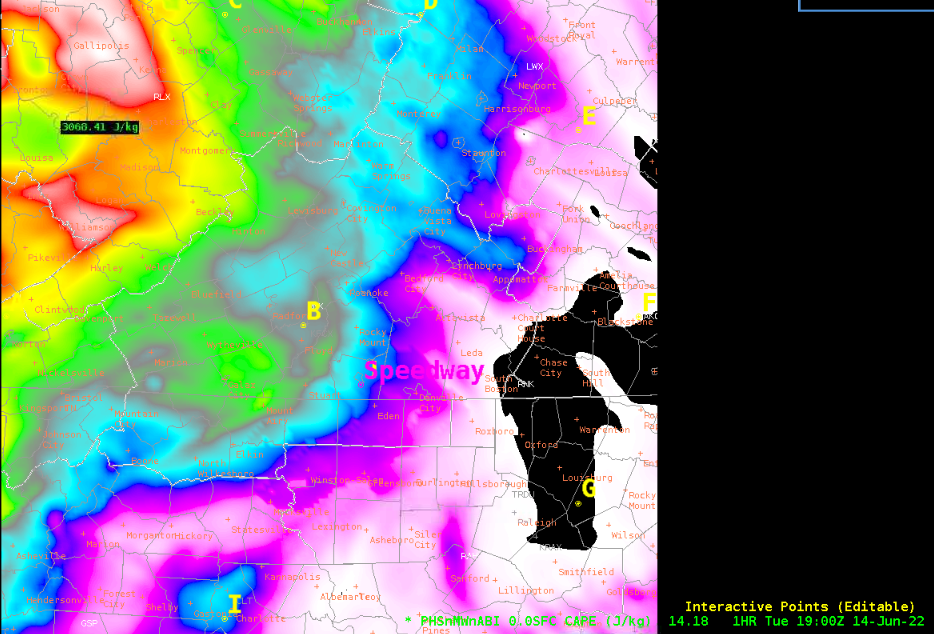
This seems to show a more toned down instability situation relative to the RAP, particularly around our point B.  If correct, this could partly explain the less-than-anticipated convective development.  But the higher resolution data also gives clues to where CAPE remains relatively higher than the surroundings.  In fact, the 19Z visible satellite does appear to show an attempt at cumulus development along the CAPE gradient east of point B… to be fair, the RAP had the same gradient, too.  I didn’t get a chance to overlay visible imagery with the PHSnABI data above today, but it would’ve been interesting to see directly how the cloud fields overlapped.

I didn’t dig deep into why PHSnABI CAPE was lower than the RAP, but the comparison graphics available on Polar/Geo-Satellite Atmospheric Profiles - SSEC (wisc.edu) could hold answers.  
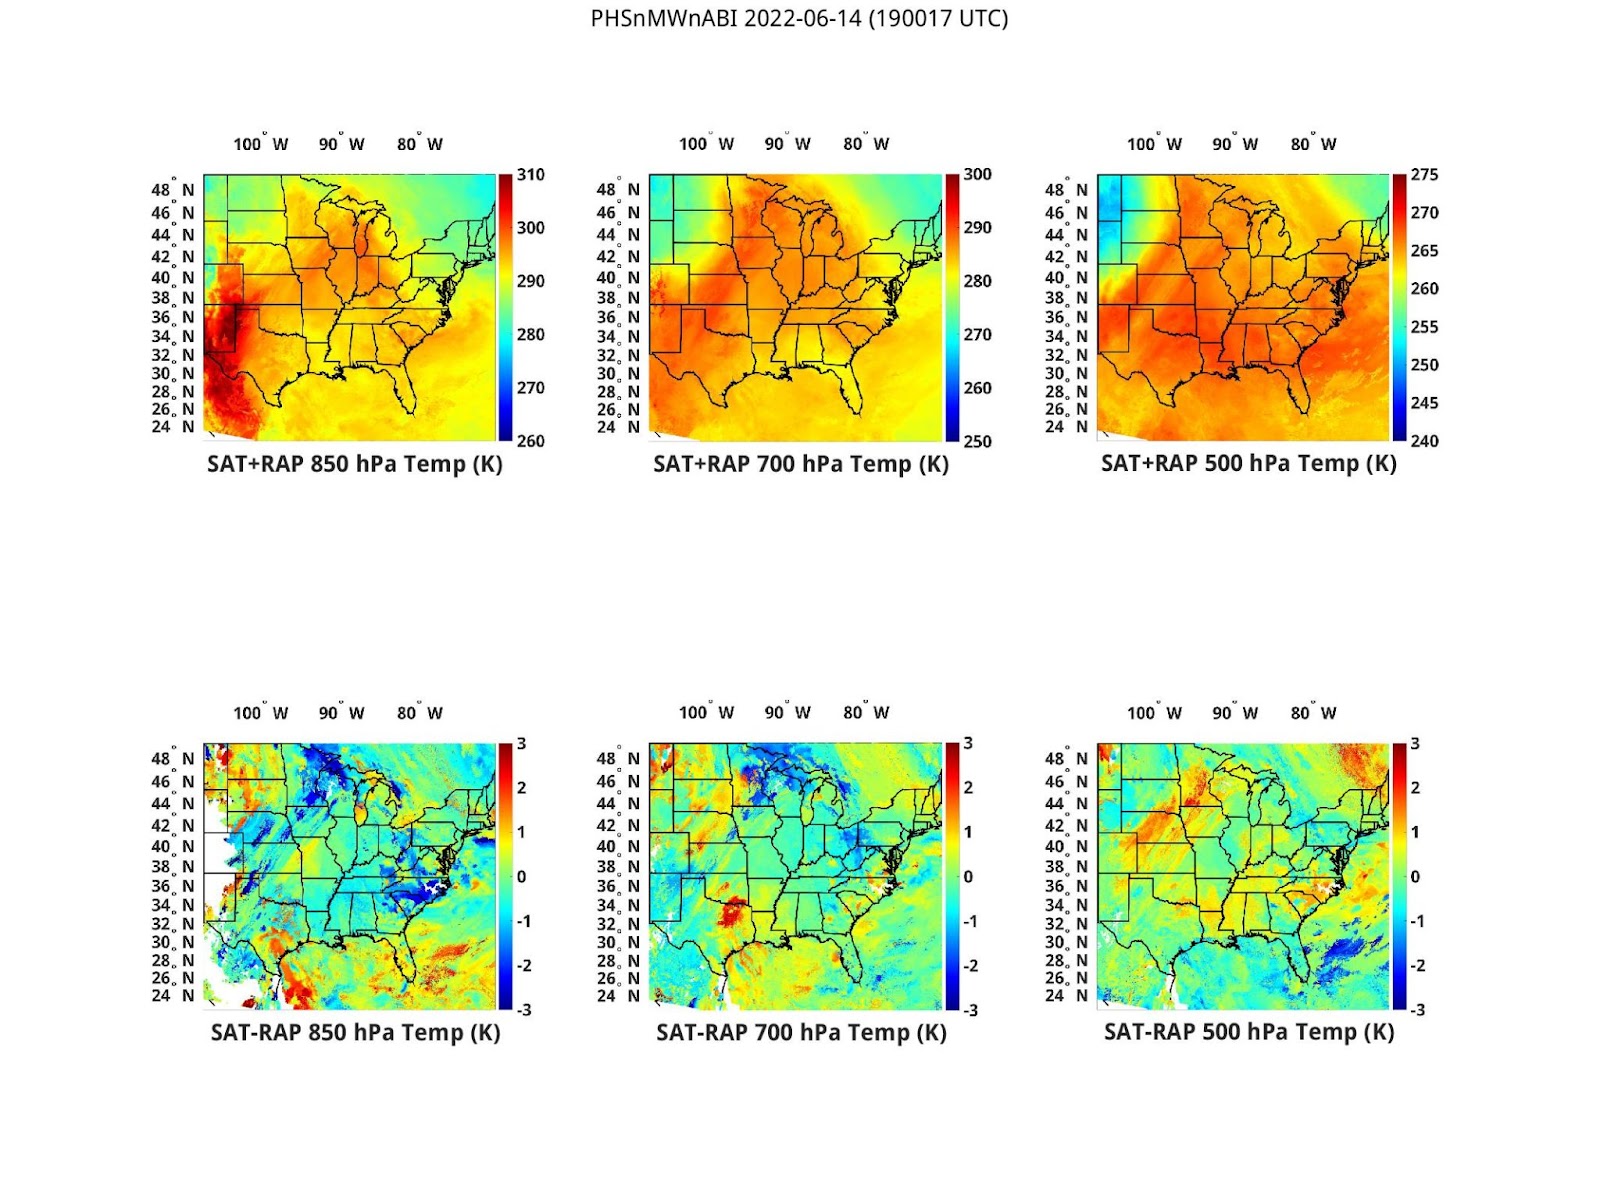


Between the plotted differences in both temperature and mixing ratio, the values in central/western Virginia are a bit noisy and hard to generalize… but there do seem to be some reductions particularly in mixing ratio at all three levels (850, 700, and 500 hPa), suggesting RAP might have been too moist. (Zoomed in example below for 850 hPa SAT minus RAP mixing ratio over Virginia, with dark blue indicating -5 g/kg correction )

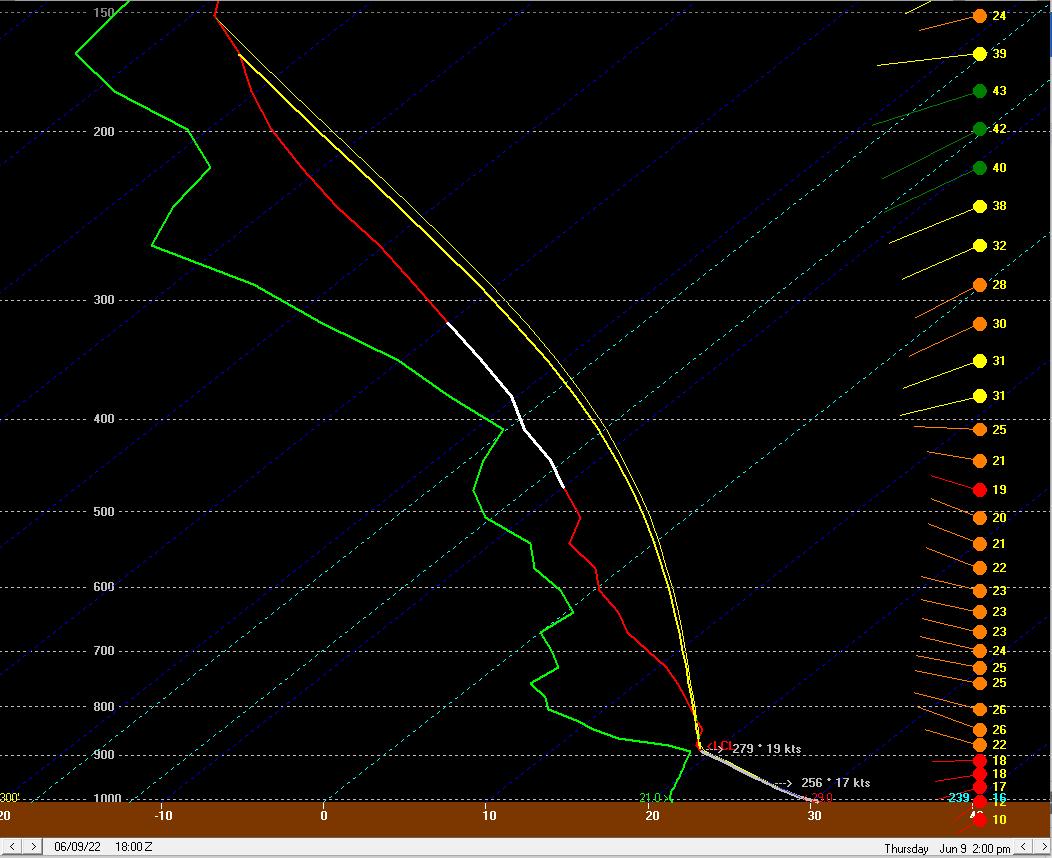
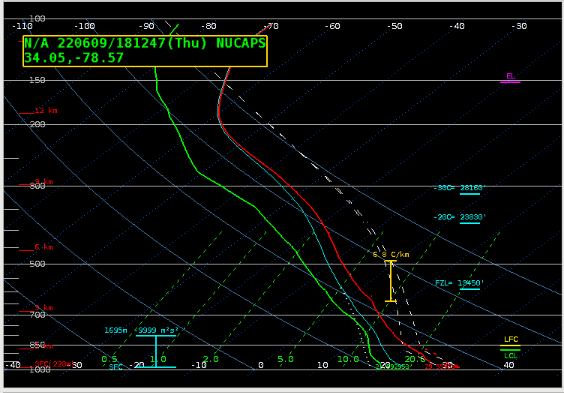
Now how about soundings? Looking at a special ~19Z (or 18Z?) sounding from KRNK, a colocated RAP model sounding (at point B) also at 19Z, and a NUCAPS sounding around the same point and time, we can compare the temperature and moisture profiles.

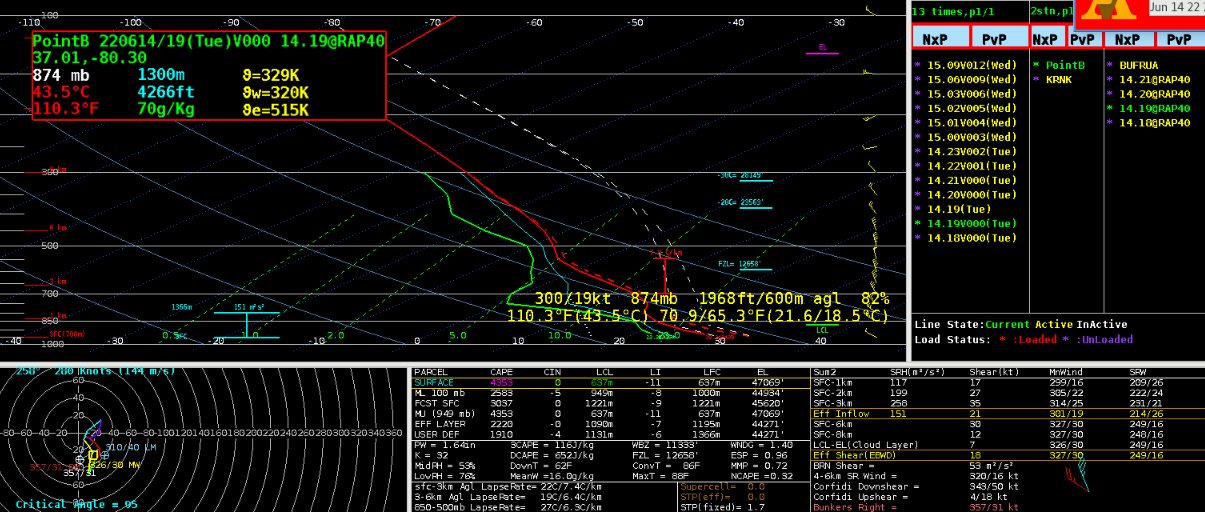
Overall, temperature profiles appear decent for all three. It’s primarily moisture which seems to differ, with the RAP being the most moisture-rich in both boundary layer and in a layer centered around 600 mb (note a ~1.64 PWAT from the RAP sounding). The NUCAPS has less low level and mid-level moisture overall, and a PWAT of 1.45. Despite the NUCAPS’ smoothed profile, if NUCAPS is supposed to have skill at retrieving mid-level moisture profiles, perhaps this is useful information. Finally, in the actual RAOB, a very high moisture observation at the surface may have caused the computed SB CAPE to be quite high… however, the low-level moisture as a whole arguably matches the NUCAPS sounding a bit better. The mixed layer CAPE in fact matches better between the RAOB and NUCAPS soundings, and so does the overall PWAT.

Buzz Lightyear
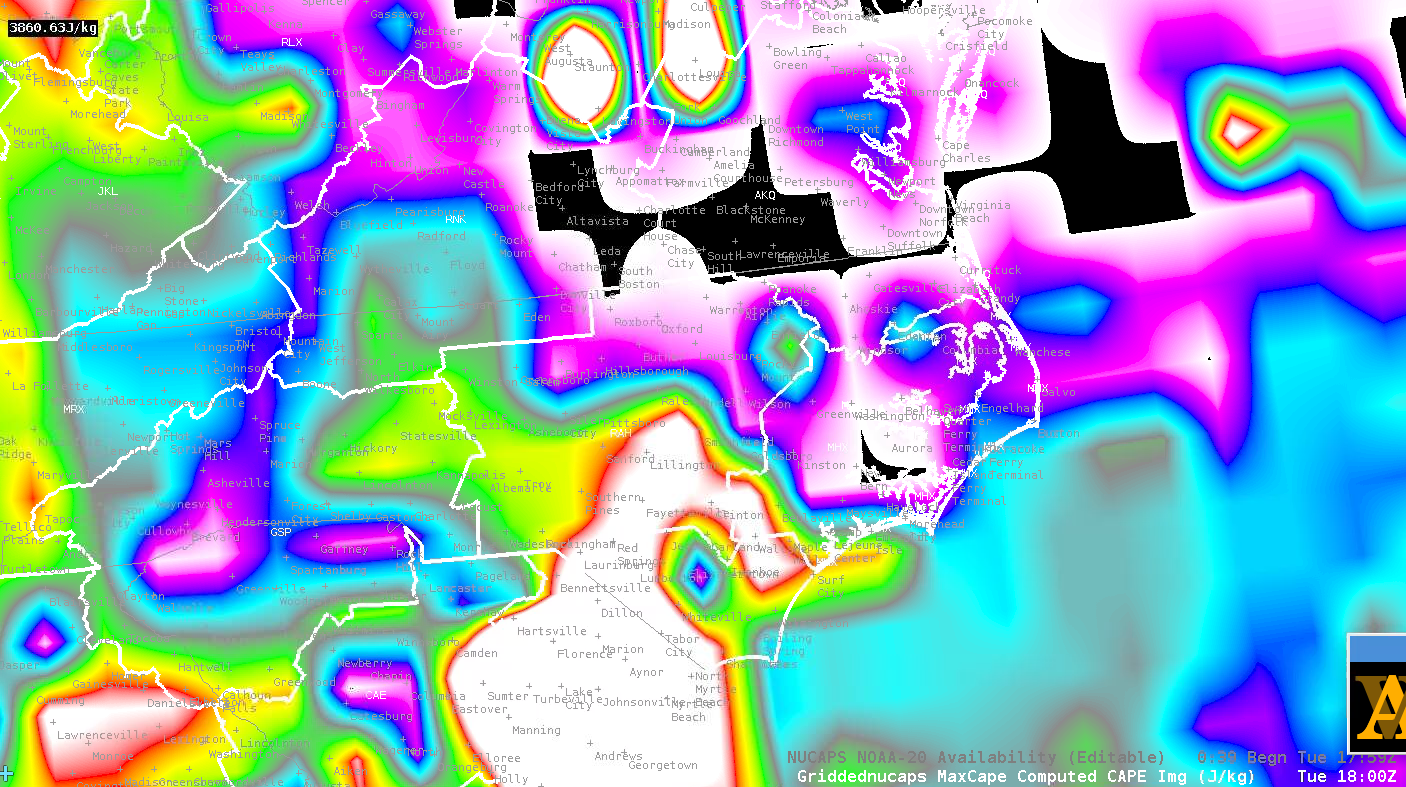


Difference in Instability in NUCAPS and PHS

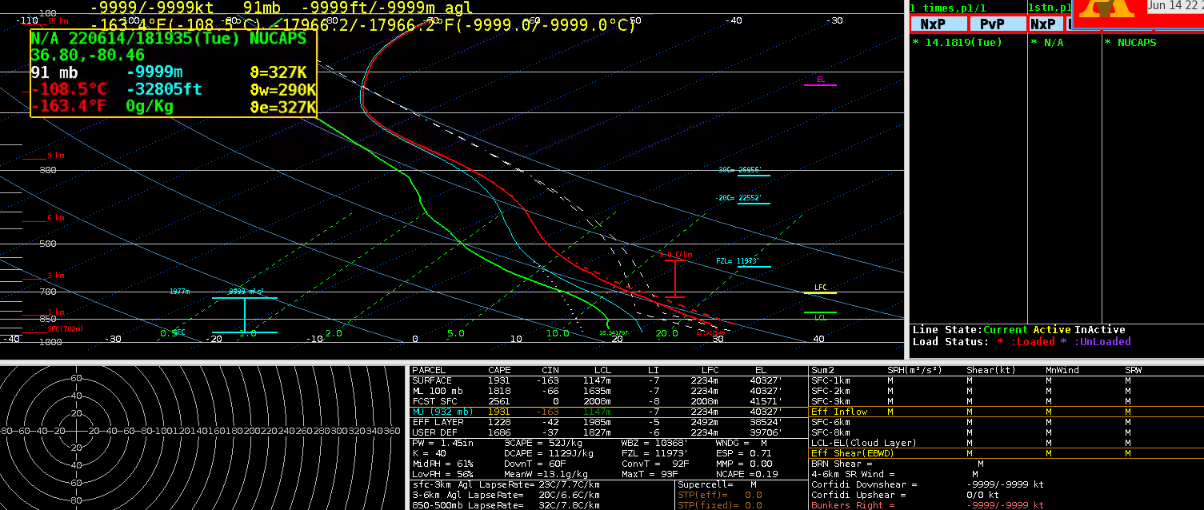
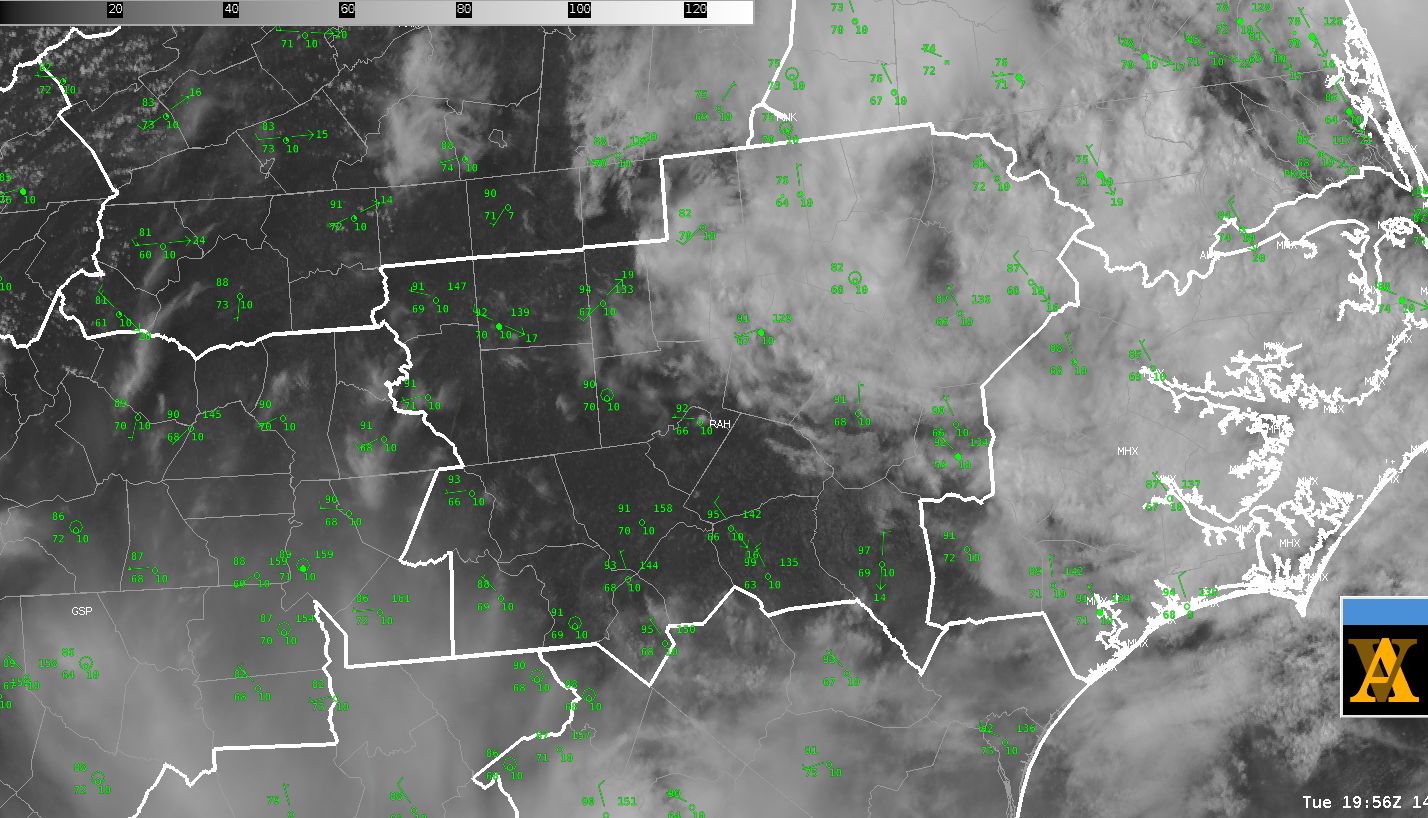
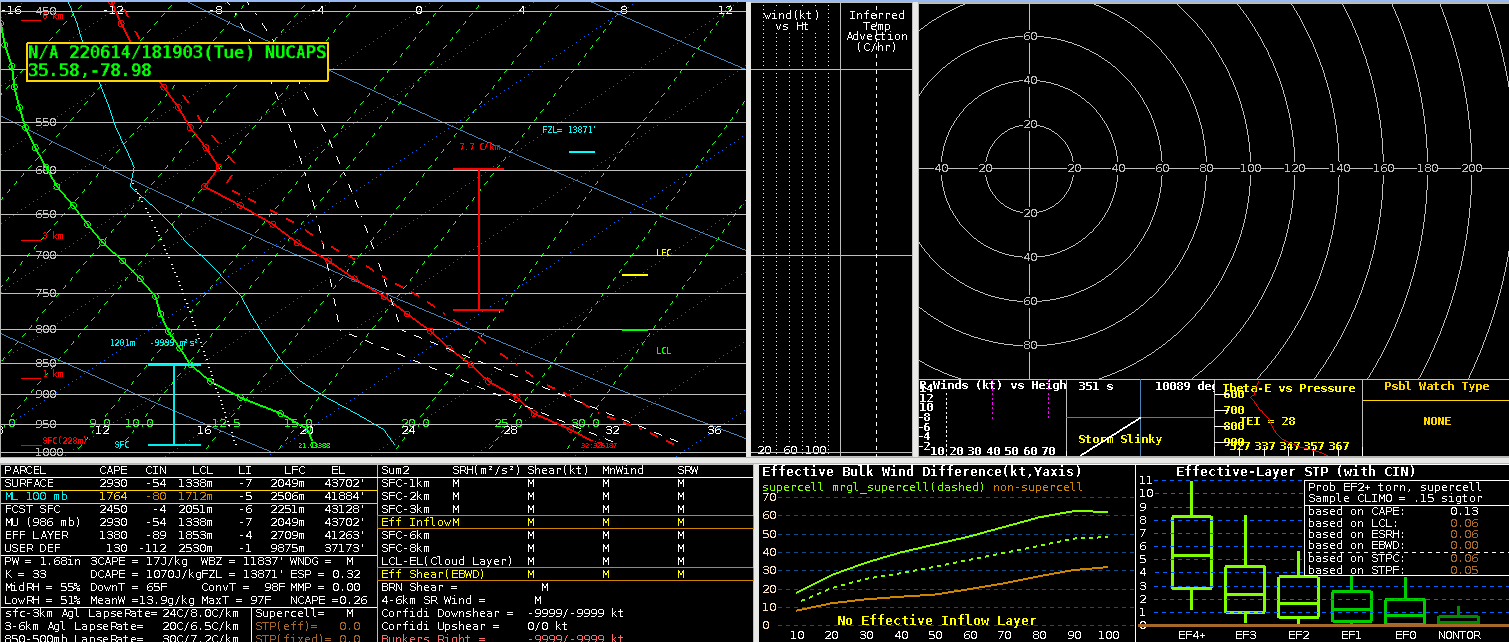
 We noticed some large differences in SBCAPE values between the NUCAPS data and the PSH over the Raleigh CWA. NUCAPS had values of over 4000 J/Kg over a large area just to the south of Raleigh with PHS indicating values of less than 1000 J/Kg over the entire domain. Looking at surface observations, the surface dewpoints from NUCAPS may be slightly higher and did modify the boundary layer in the soundings below. This modification yielded values closer to 1500-2000 J/Kg. The modified soundings also introduced some capping to the sounding as well. Included the visible satellite imagery to show the lack of cumulus development in the area to the south of Raleigh.

Gridded NUCAPS CAPE 18z

PHS CAPE at 20z.

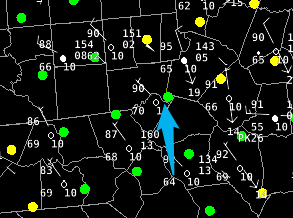
The point selected with the nearest ob used for images below:

Original NUCAPS Sounding

Original Modified NUCAPS

Modified NUCAPS Modified Sounding for nearest observation point (90°F/70°F)

-MartyMcFly

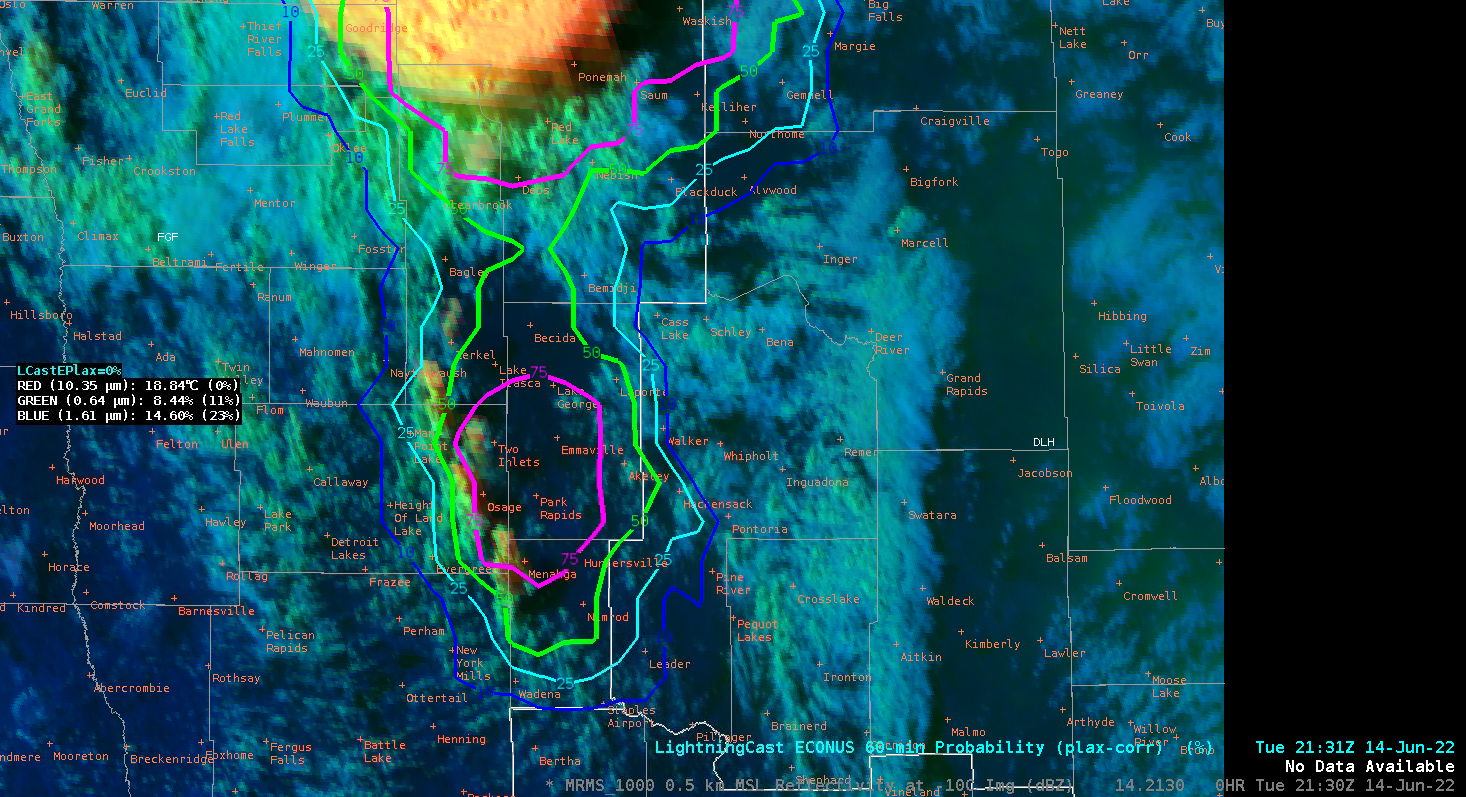
LightningCast/NUCAPS and Isolated to Scattered Convection in FGF

Convection developed rapidly to the south of the main area of convection in an area of high instability. This was first picked up by higher probabilities in the LightningCast data. There was some rapid cumulus development that was picked up well by the algorithm. Probabilities went well above 75% around 5 minutes or so from the first GLM detection. NUCAPs data indicated MLCAPEs of around 2000 J/Kg in this area supporting the quick upscale growth. 

Convection developed rapidly to the south of the main area of convection in an area of high instability. This was first picked up by higher probabilities in the LightningCast data. There was some rapid cumulus development that was picked up well by the algorithm. Probabilities went well above 75% around 5 minutes or so from the first GLM detection. NUCAPs data indicated MLCAPEs of around 2000 J/Kg in this area supporting the quick upscale growth.

LightningCast and GLM at 2131 UTC

DCP RGB and LightningCast  2131 UTC

MRMS -10 Reflectivity and LightningCast first GLM detection at 2135 UTC

So let’s take a look at some NUCAPS soundings as we had three overpasses right before the convection initiated in the above examples.  Here is the first overpass with the sounding point selected with the red arrow:

NUCAPS Sounding at 1823 Z

Not too shabby with a MLCAPE value of 2094 J/kg.  (And why mixed-layer? Hank likes ML because very few times do parcels start at the surface for SB, and MUCAPE is just fun to look at).

The next overpass was 2003 UTC (about an hour and a half after the previous overpass) to see if the environment has changed much:

MLCAPE of 1235.  Hmmmm…that’s quite a drop in MLCAPE compared to previous overpass.  Two things to remember; this is on the edge of the field-of-view (matter of fact, the eastern edge).  Luckily we have a Modified NUCAPS for the same profile point which adjusts the boundary layer:

Yeah, that looks much more reasonable based on observational trends (few clouds to change the mid-atmospheric profile, increasing surface T/Td conditions) with 2185 J/kg MLCAPE.  But wait, there’s more!  We also have a:

NUCAPS AQUA Overpass

This was almost directly under NADIR so we should have much better profile retrieval.  Sure enough, MLCAPE value is almost 3000 J/kg in between the 1823 and 2003 UTC NOAA-20 sounding retrievals.

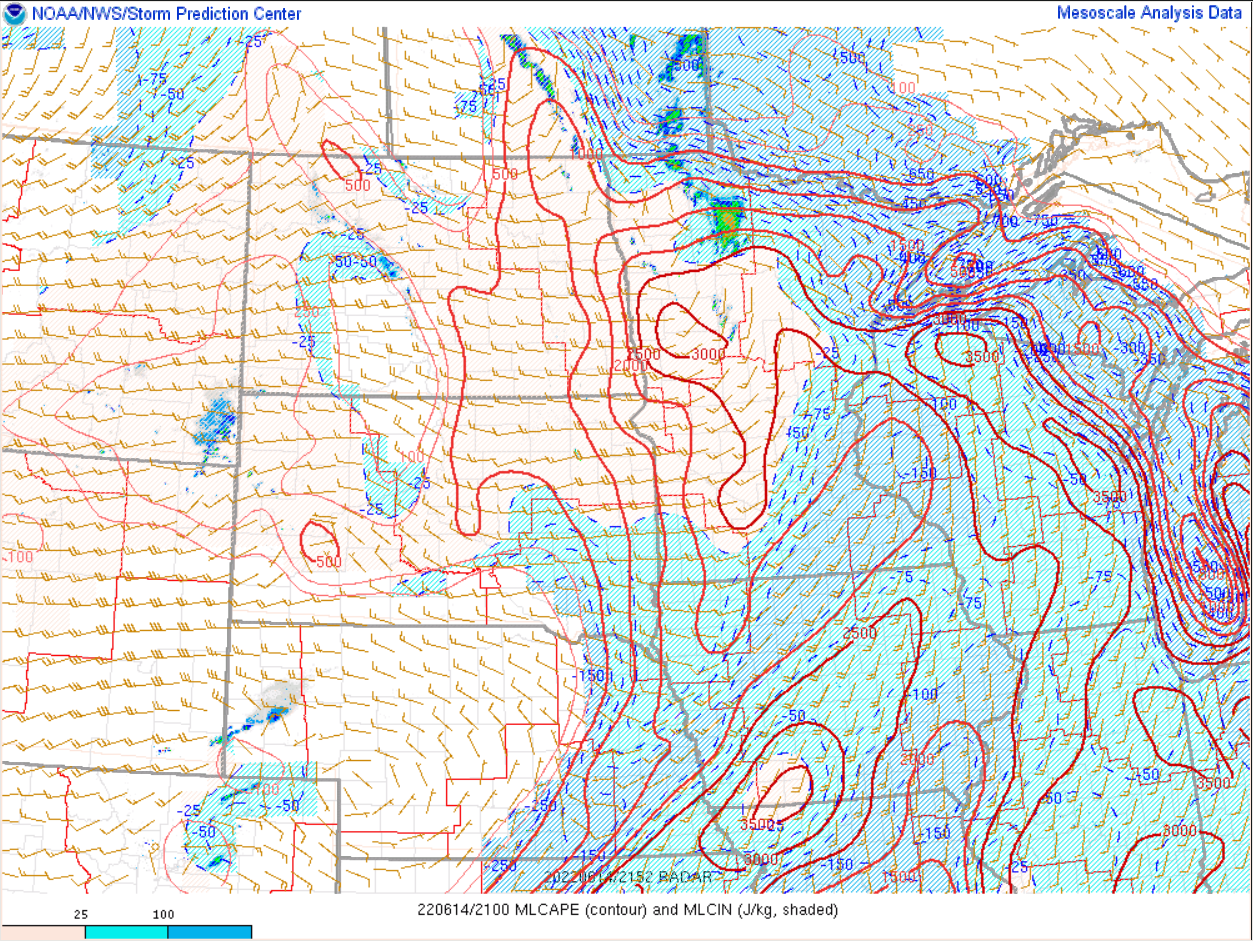
How does this all tie into the weather for FGF today?  This is what the SPC Mesoanalysis graphics had for 2100 UTC MLCAPE values:

They all combine to increase confidence on what conditions COULD be in areas where the models are saying one thing and an observational system is indicating potential reality (remember, it’s still a remote sensing platform with their own set of issues). In our case, the bulls-eye of 3000 J/kg in east central Minnesota is likely real and needs to be an area to watch…and that is where the Lightning Cast product at the start of our post indicated the potential for new activity to develop.  Pretty cool stuff…

- Marty McFly/Hank Pym

A Comparison of the Optical Flow Winds “Divergence” Product and KMVX Radar Storm-Top Divergence

By 2200z, a strong cluster of storms was ongoing in northwestern Minnesota ENE of the KMVX RDA while moving northeast. Below are a set of 4 figures showing the divergence at the cloud top of the ongoing cell, with a cyan circle outlining the updraft area.  

Here is a comparison of the Optical Flow Winds divergence versus storm top divergence provided by traditional means:

OFW – STD

>100 – ~115 kt

~80 – ~105 kt

>100 – ~150 kt

> 100 – ~130kt

While the divergence output wasn’t as high, it seemed to behave consistently below the traditional storm top divergence which means it could be adjusted up in the forecaster’s head. I’d love to see a little more discerning from the color curve for divergence, as it shows little difference, and when it goes over 100, it is all red. Also, it would be nice to see the exact unit that it uses, as it seems assumed that it’s kts.


-aerobeaver

Tuesday, June 14, 2022

Setting up for DSS

HWT forecasters are setting up for DSS events: a race in Martinsville Speedway, VA (Figure 1), a concert in Cary, NC, and a baseball tournament in Panama City Beach, FL (Figure 2). Lightning is already close by in Panama City, FL.

Figure 1: Point "I" is at the Martinsville Speedway, with range rings of 10 and 20 miles.

Figure 2: Point "A" (on the coast) is at Panama City Beach sports complex, with range rings of 10 and 20 miles. LightningCast contours and GOES-16 GLM flash-extent density


Where is the new convection going up?

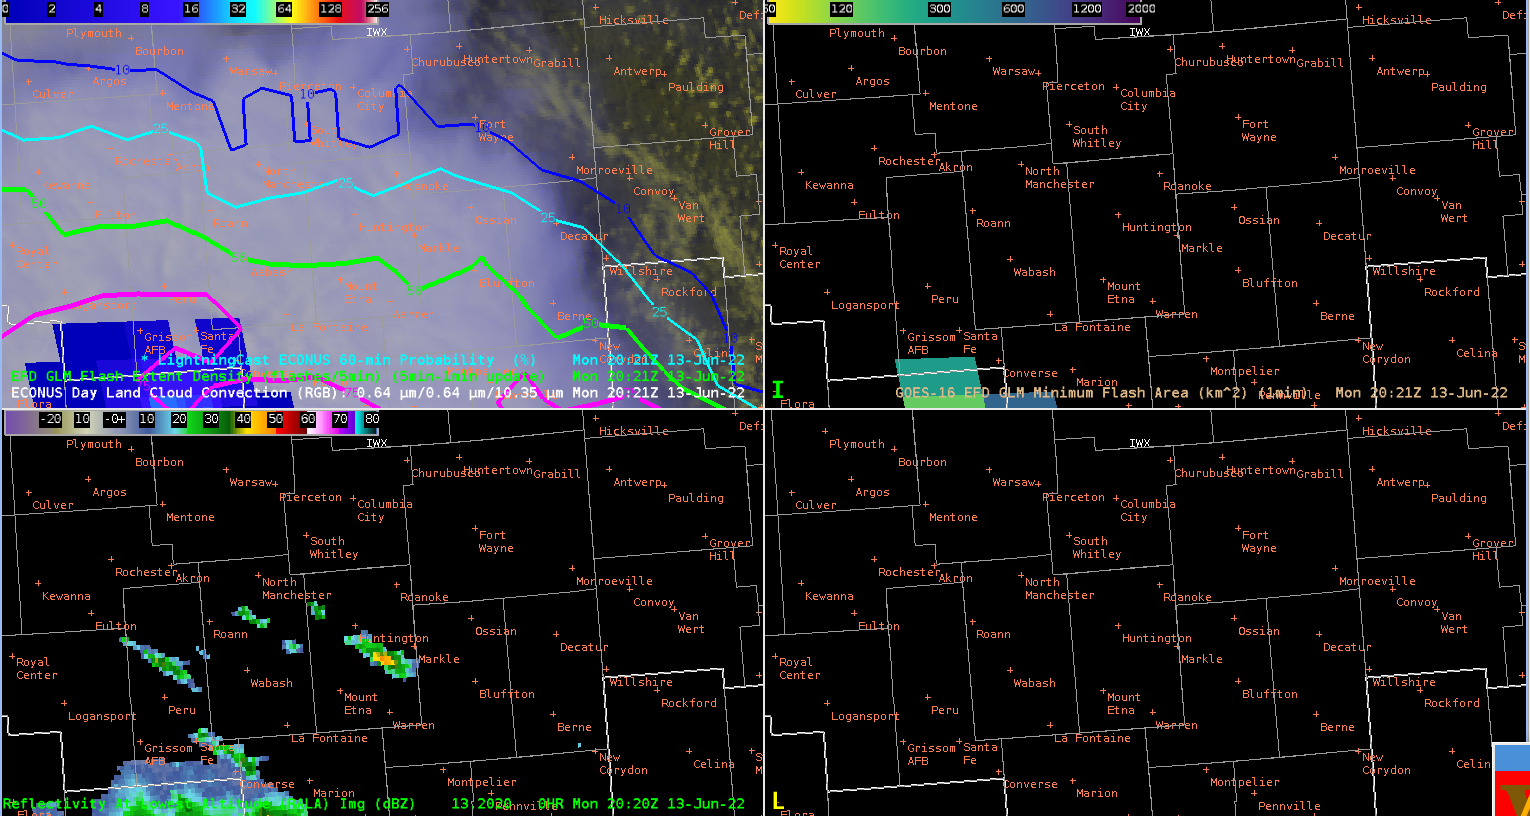
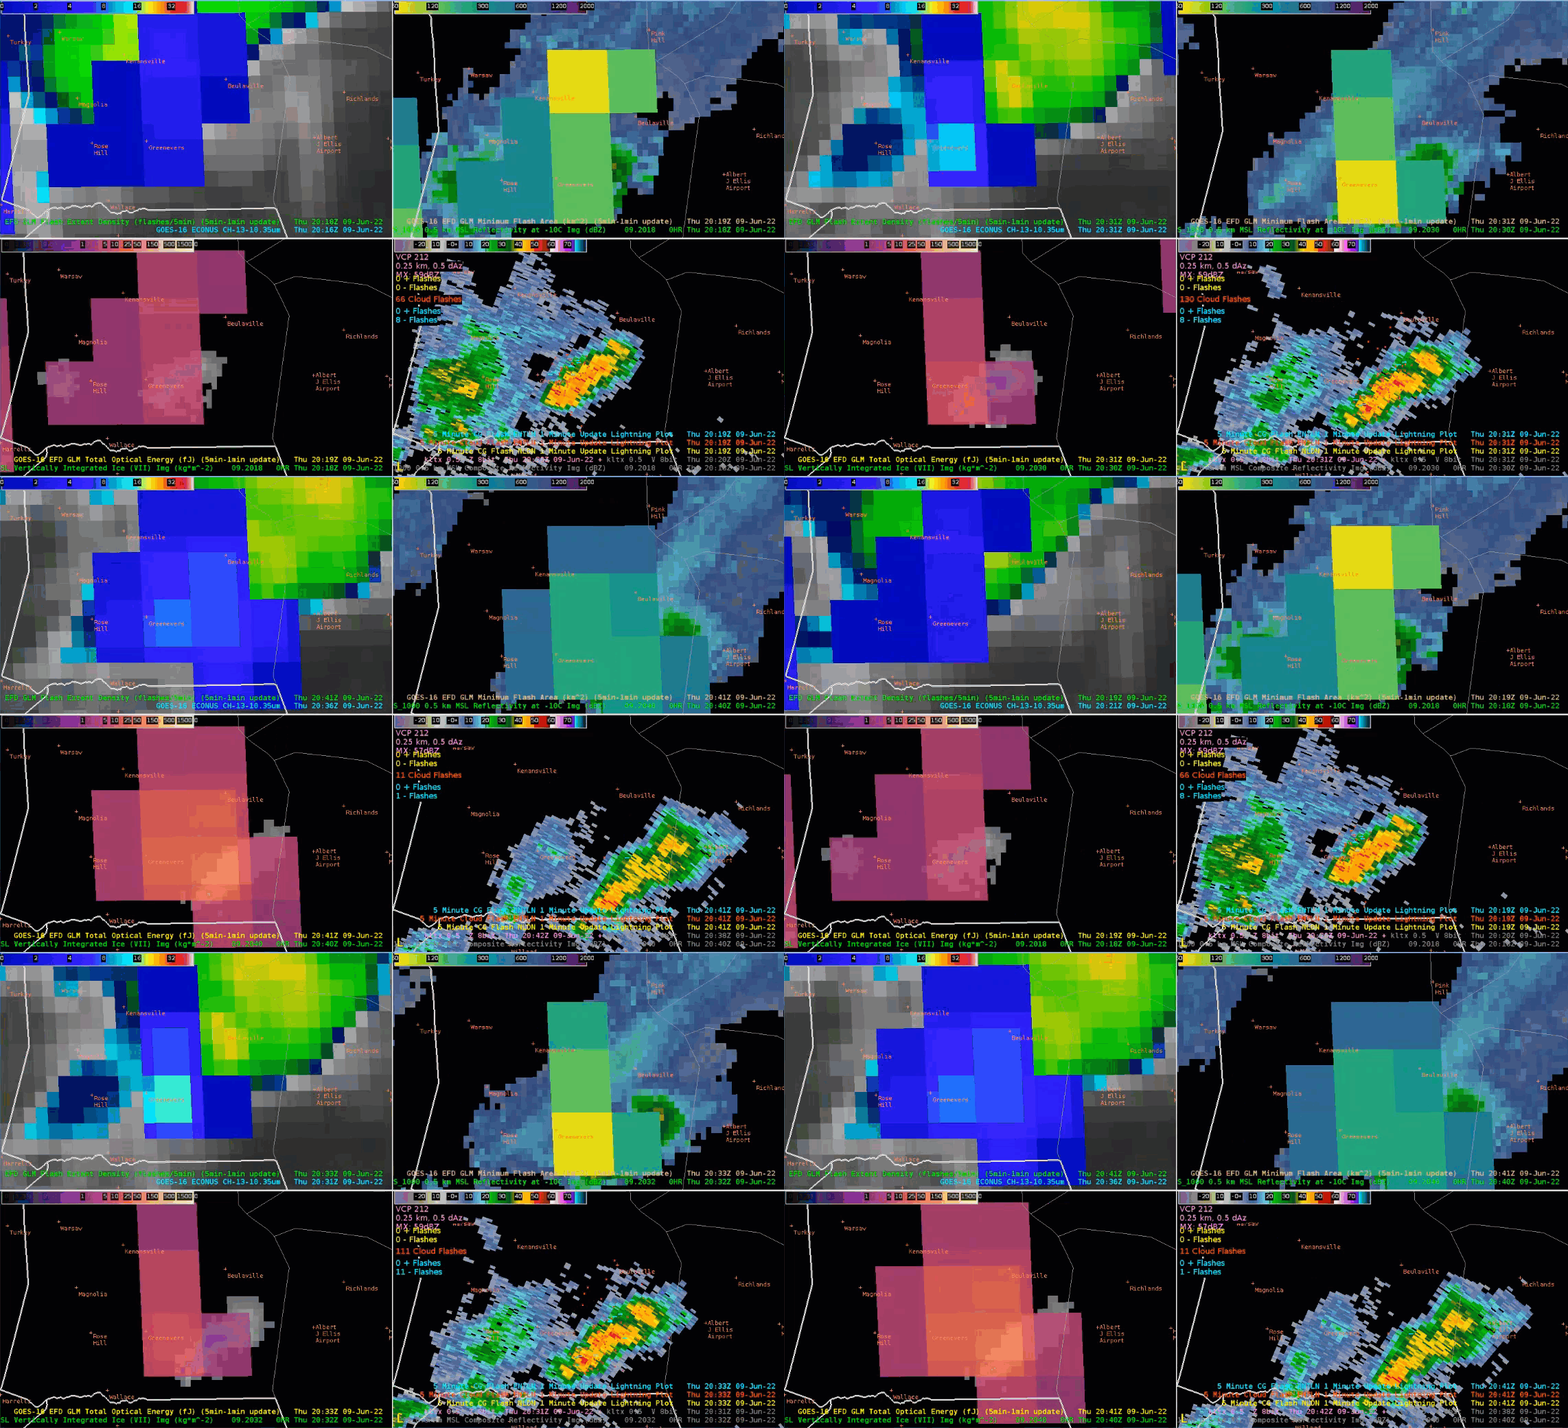
 The GLM can be used to help find where new convection is developing under a cirrus canopy.  Here’s an example of this!

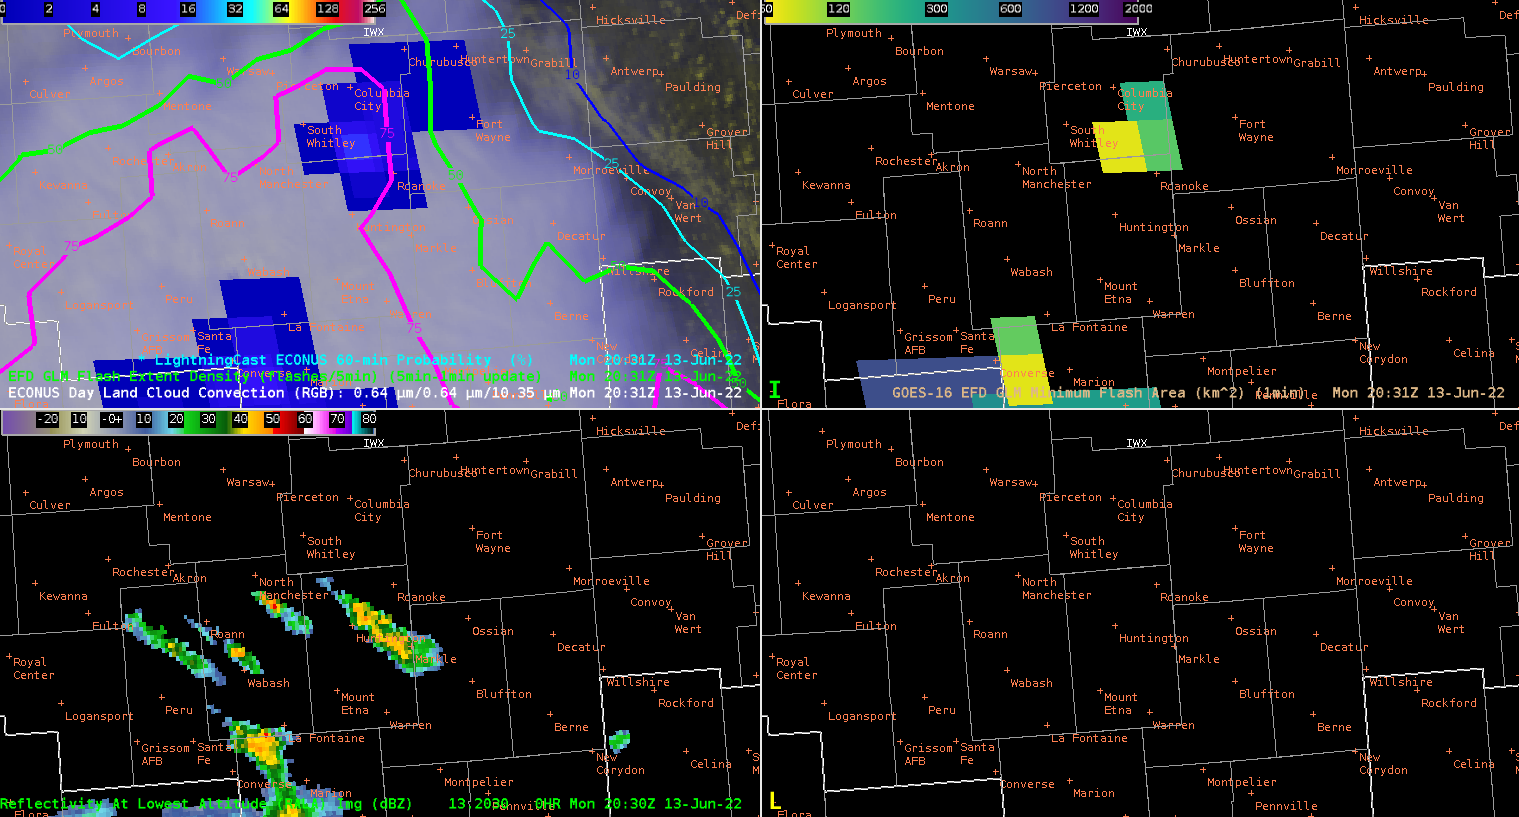
Top left - LightningCast with Day Land Cloud Convection and Flash Extent Density (FED).  Top Right is Minimum Flash Area (MFA). Bottom left is MRMS 1km Reflectivity.

We can see that there are some returns developing in the center of the field of view on the MRMS reflectivity but it is hard to tell whether this is real or not.  Five minutes later, we have this image:

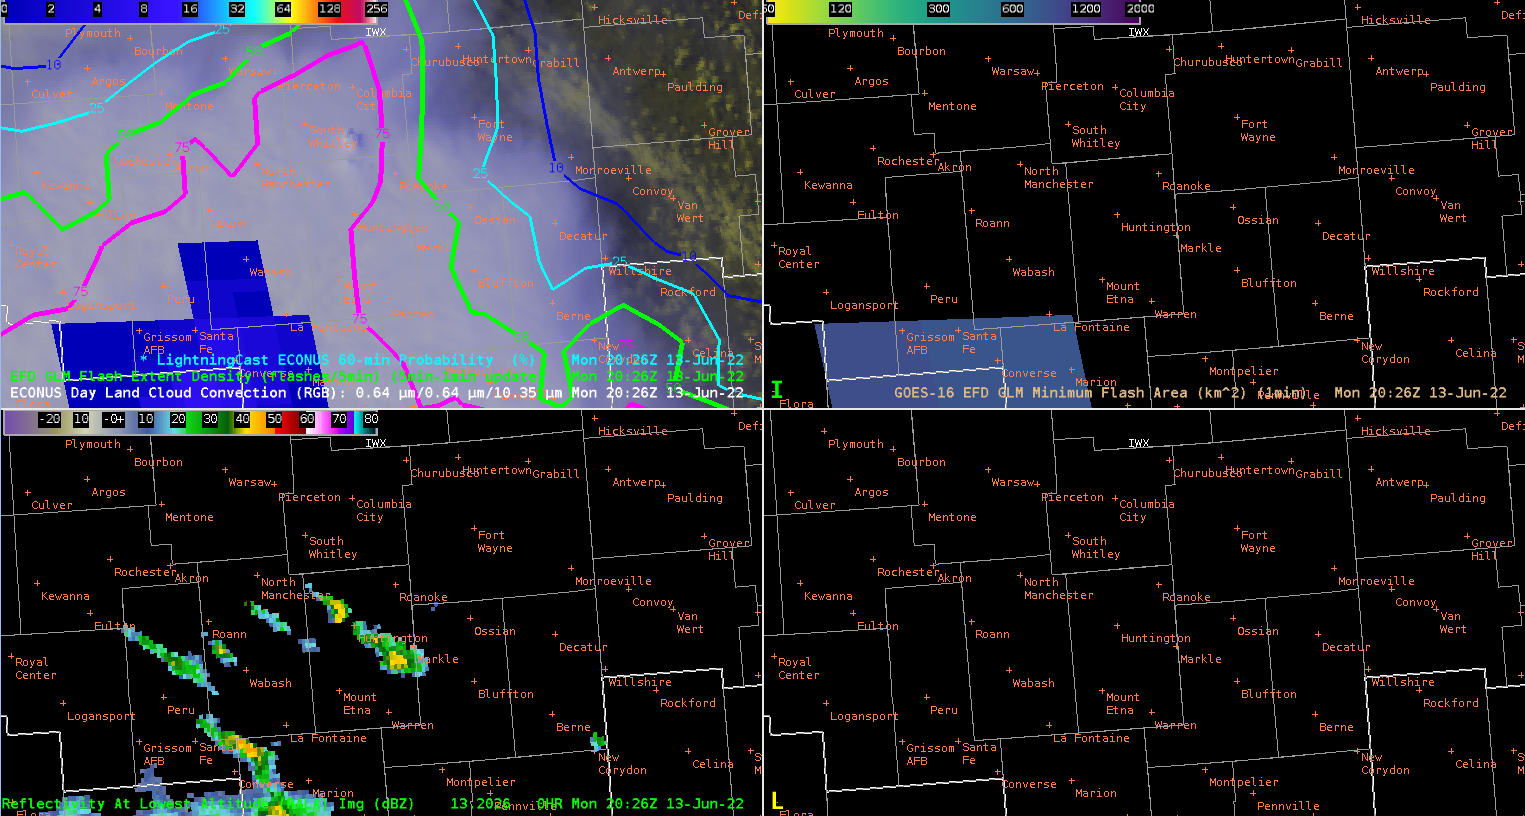
Hmm, that could be new convection developing on the Top Left panel because it looks like there is a tower coming through the cirrus shield.

And then the next frame we have:

And there we go!  Flashes starting to show up so it looks like this area of convection will need to be watched.  (Should also note that it would also be helpful to time match to the GLM 1-minute FED instead of the 5-minute RGB!)

-Hank Pym


Monday, June 13, 2022

Midwest mayhem

Warm muggy weather under northwest flow churned out a number of supercell thunderstorms last Saturday, June 11th, producing huge hail (up to 3.75" in diameter), damaging winds, and tornadoes. 

ProbSevere LightningCast gave a heads up on the quickly developing convection in Nebraska and Iowa (see Figure 1), with lead-times ranging from 10 to 40 minutes prior to the first flashes in several storms (measured from the 25% probability threshold). LightningCast is adept at predicting lightning in the next hour using GOES-R ABI images as predictors.

Figure 1: LightningCast contours, GOES-16 ABI day land cloud convection RGB, and GOES-16 GLM flash-extent density over the Missouri River valley.


ProbSevere v3, being evaluated at the HWT this month, quickly picked up on the developing convection, using the juicy environmental parameters, increases in total lightning flash rates, and strong satellite growth rates to predict increasing probabilities of severe weather. Numerous forecasters at the HWT have noted that increases in ProbSevere helps them identify potential threats more quickly.

Figure 2: ProbSevere v3 contours, MRMS MergedReflectivity, and NWS severe weather warnings.

Several supercells that spawned in Nebraska were soon tornado-warned and at least one produced multiple tornadoes, destroying trees, power lines, outbuildings, as well as industrial buildings in Maryville, KS. ProbTor v3, which is generally more conservative than version 2, had elevated probabilities of tornado before version 2 did. At 21:26 UTC, 6 minutes before the first tornado warning was issued, ProbTor v3 was 25%, whereas ProbTor v2 was only 1% (for the storm in Figure 3). In this case, the strong STP (2.6) and effective storm-relative helicity (SRH, 200 m2/s2), as well as the high MRMS MESH, were contributing to the enhanced probability of tornado for version 3, whereas the 0-1 km SRH in version 2 was relatively low (60 m2/s2). Forecasters should take note when ProbTor v3 is markedly higher than ProbTor v2.


Figure 3: ProbSevere contours (outer contours is colored by ProbTor v3 probability), MRMS MergedReflectivity, and NWS severe weather warnings for supercells in southeast Nebraska.


Friday, June 10, 2022

Metwatch for Wilmington DSS event

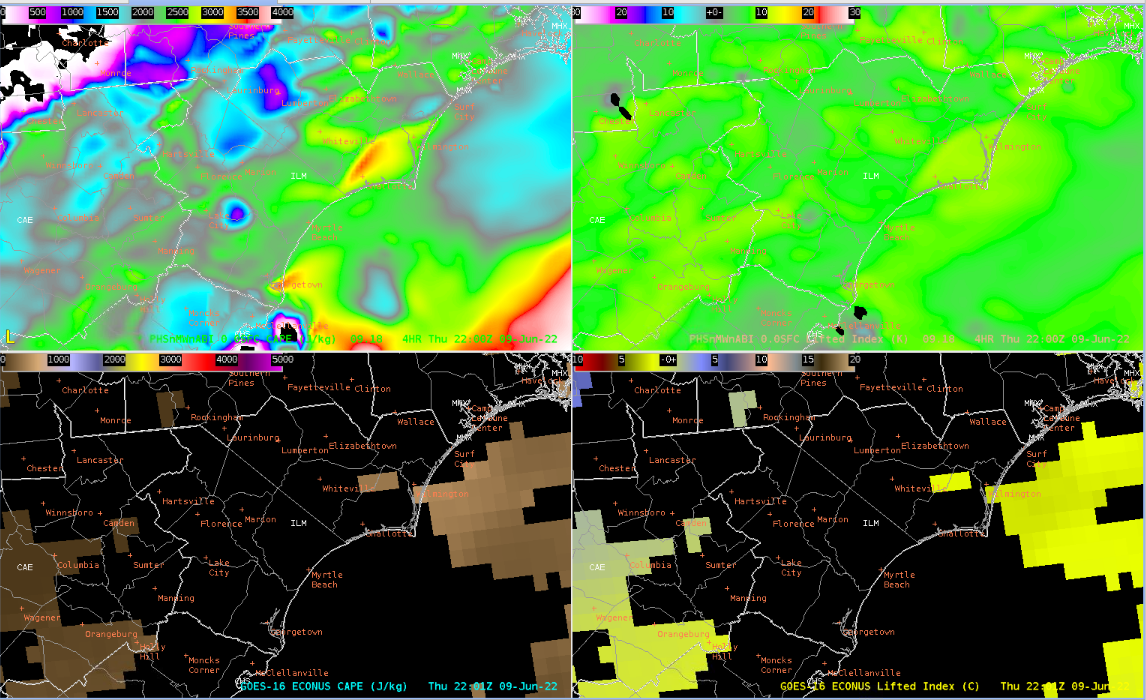
 Metwatch for Wilmington NC started with modified NUCAPS soundings and a comparison with NAM BUFKIT profiles:

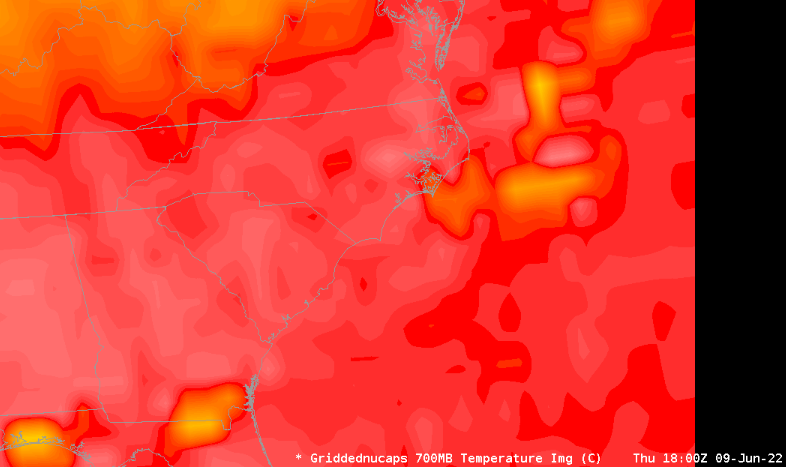
Looking at 700mb temperatures, BUFKIT has about 8C for that layer, and here is the gridded NUCAPS 700mb temperature layer. Note: not a lot of advection noted at 700mb, with low level dry advection (not shown)

Watching this cell just outside the CWA pulse and then fall apart…PWV3 never exceeds 4% with this pulse. LightingCast also showed a rapid drop in probabilities.

Not much happened today, but just along the coast was this little area of enhanced CAPE (3000j/kg)...so you’re saying there’s a chance…

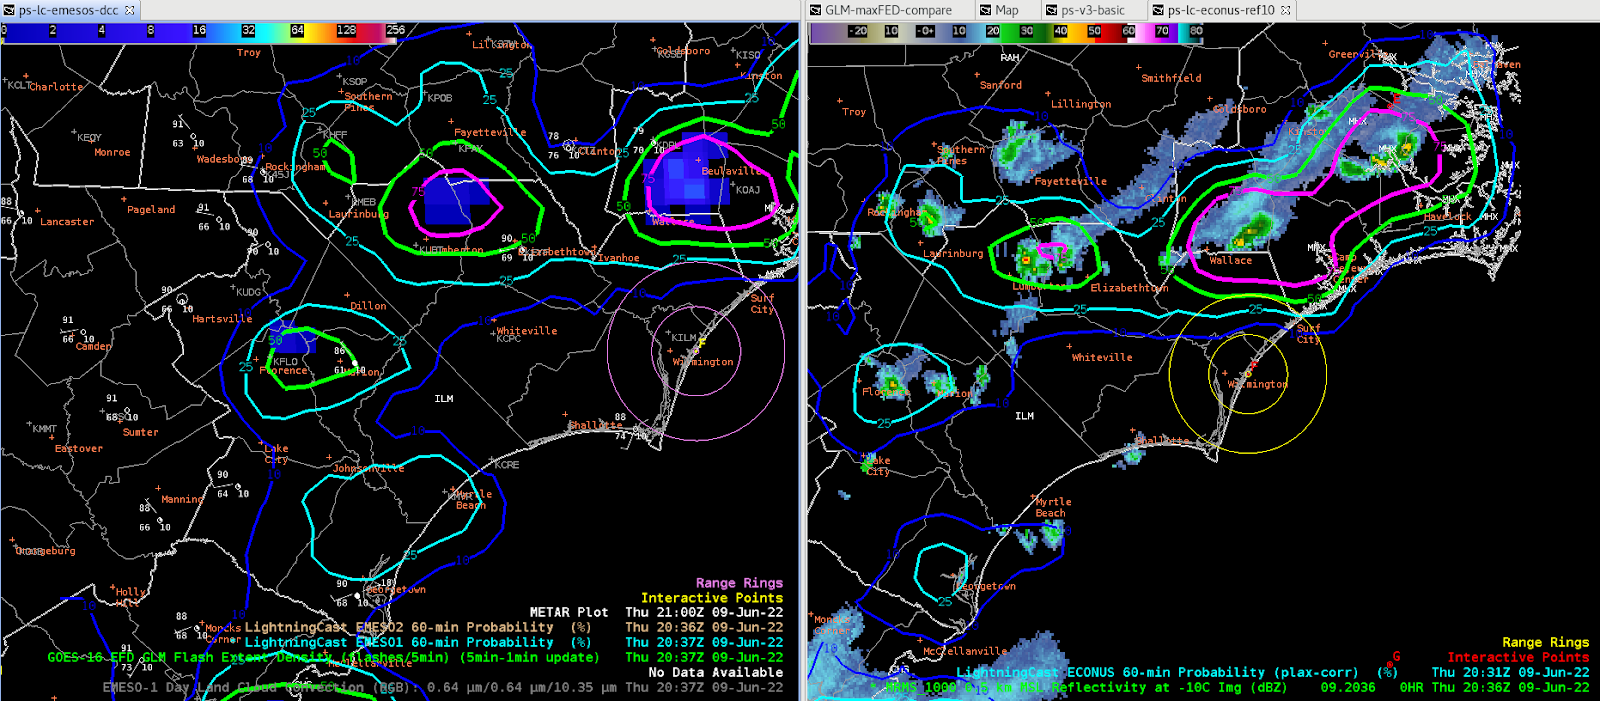
Comparison between parallax corrected and uncorrected lightning cast. You can see the image above and to the right (corrected) has some higher percentages getting into the 20 mi range ring compared to the non corrected data which just has the 25% grazing the 20 mi range ring. Having the corrected data could be more beneficial to providing DSS support.

- Mr. Bean

- Noctilucent

LBF HWT Blog Day 4

 We didn’t have too many storms occur during operations today, but that allowed us to be able to focus more on CI. 

LightningCast for CI

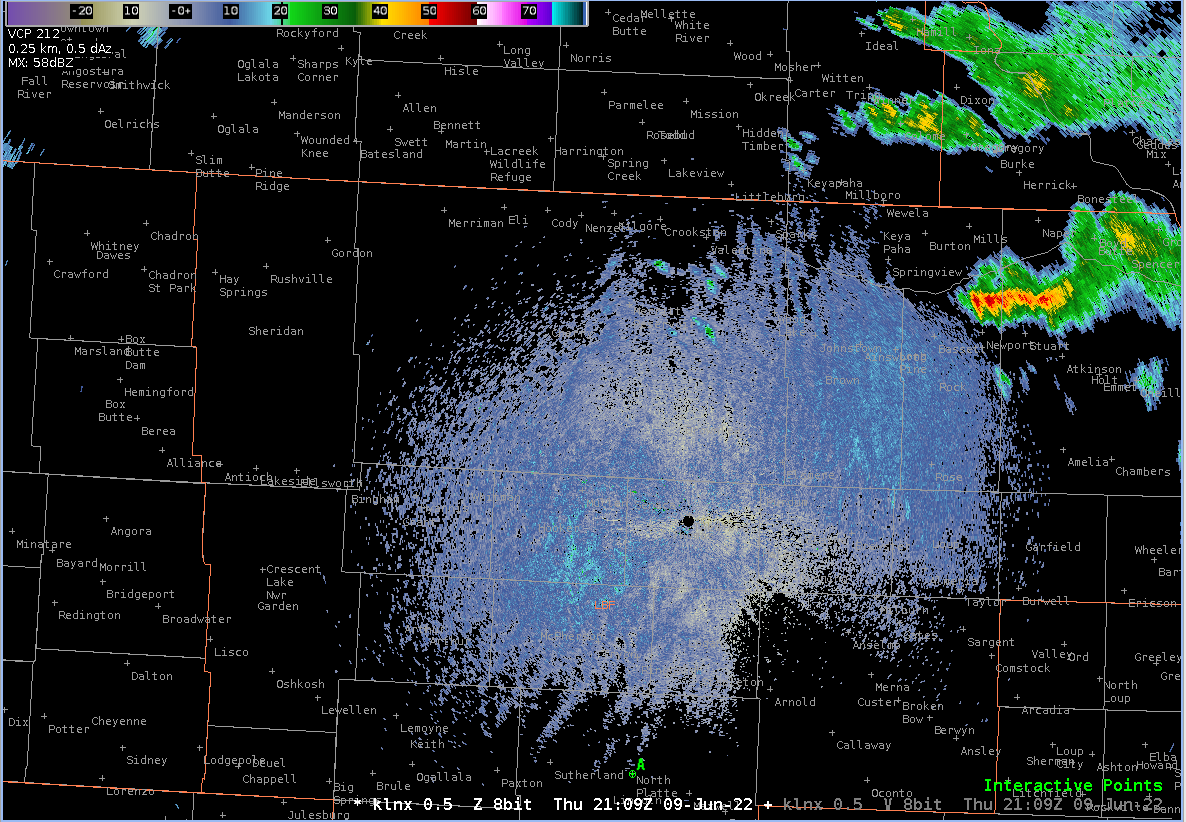
Was able to use LightningCast for convective initiation today as LBF was waiting for storms to fire back up for the afternoon and evening. Initially we were thinking storms would form first over the southern portion of the CWA based off of modeled convective parameters but at 2101Z, a 25% chance of lightning popped up via LC for the north-central portion of the forecast area. This 25% contour appeared a few minutes before radar reflectivity started showing up for the same area. Seeing even the 10% contour show up earlier on, clued me into the fact that we needed to shift our focus further north than we originally thought. These storms seemed to be forming along a shear gradient and weak boundary.
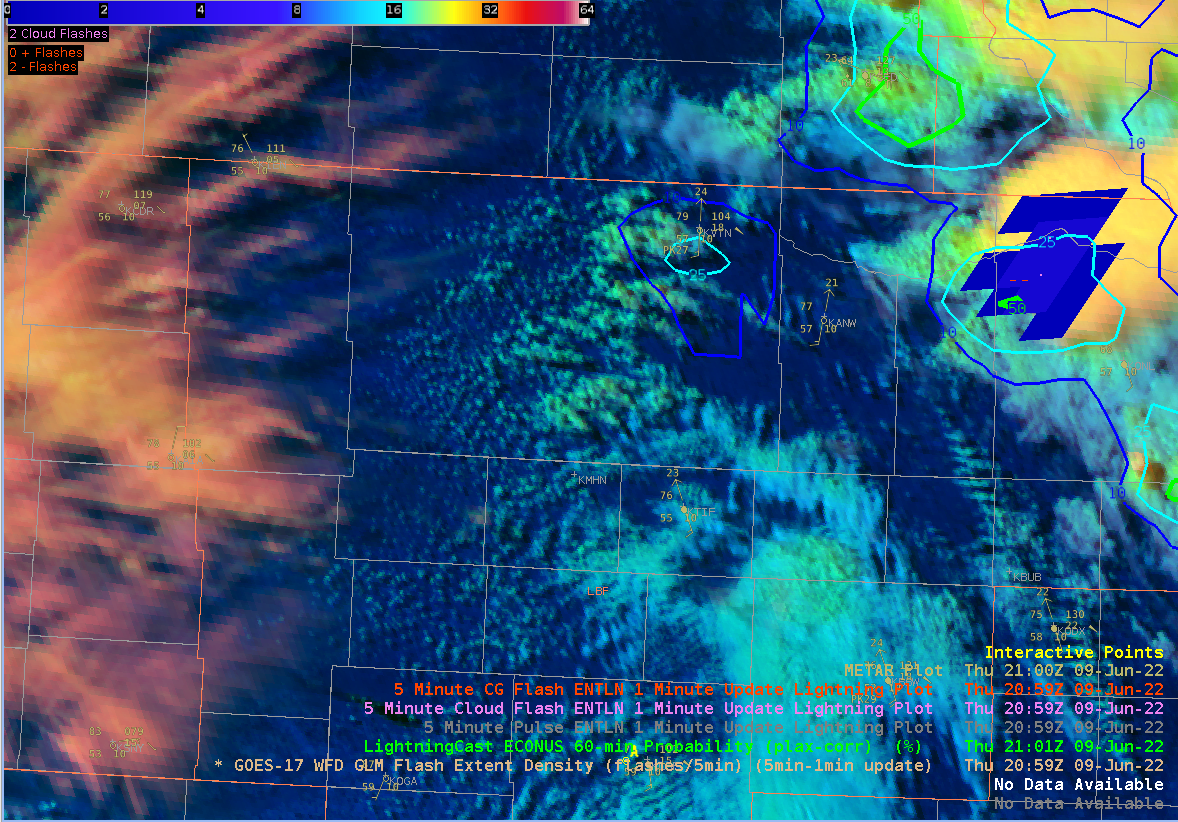

Of note, I am using the parallax corrected LC.


LC, GLM FED, and DCPD at 2100Z

LBF radar at 2109Z
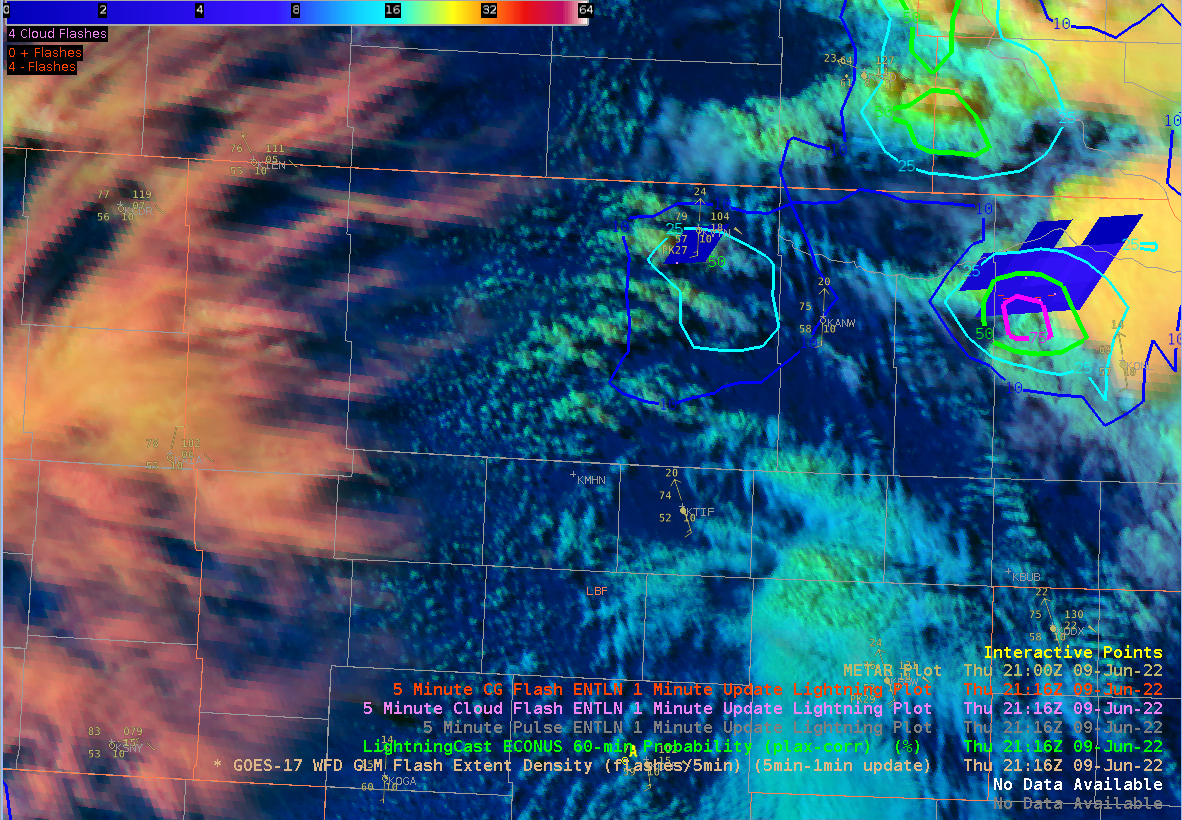
By 2116Z, both GLM and ENTLN showed the first flash of lightning, allowing for around 15 minutes of lead time off of the 25% contour.
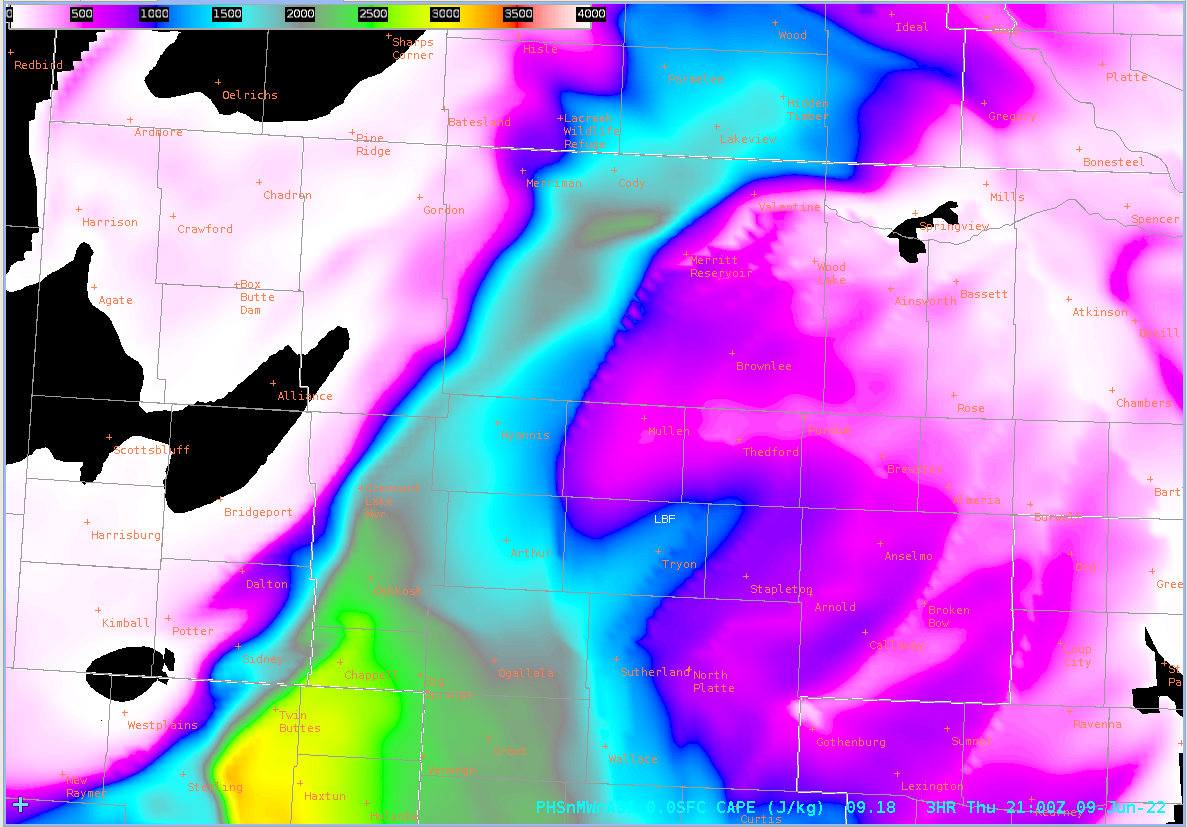
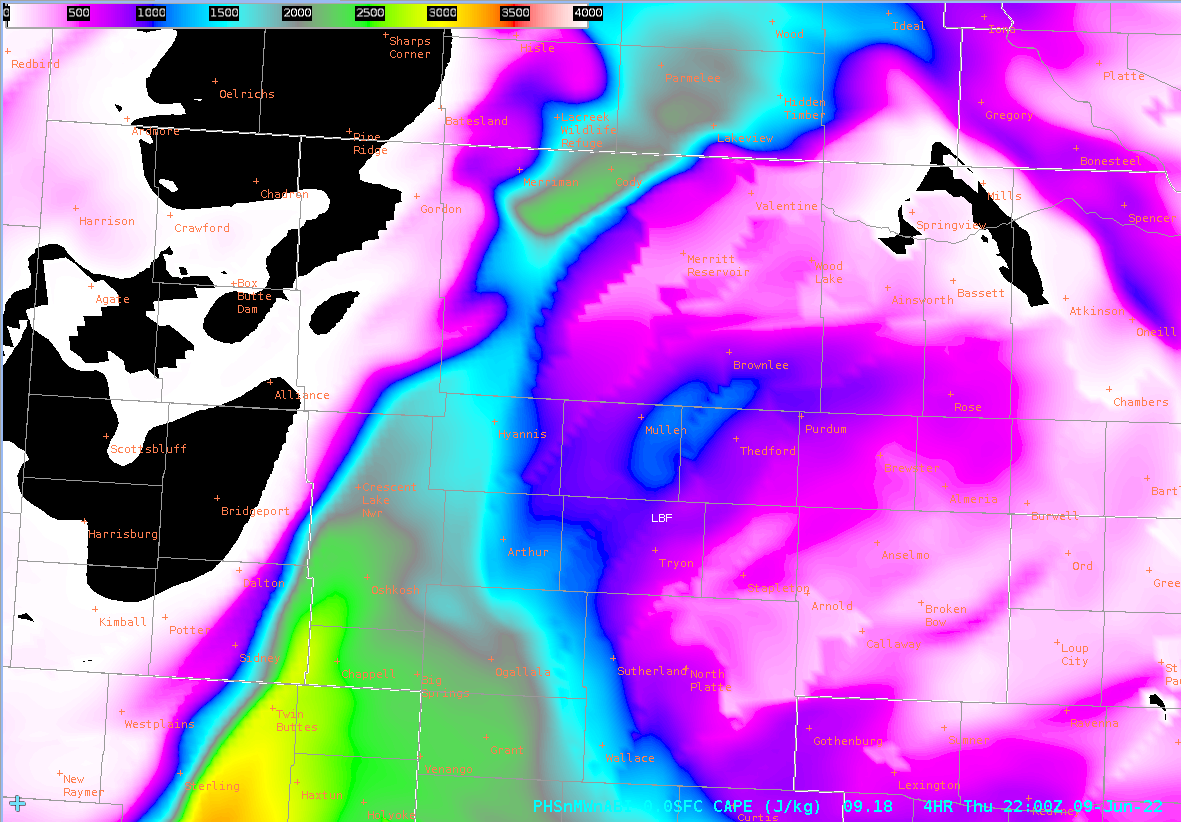
For comparison, these storms were forming ahead of the highest PHS CAPE and ahead of any of its stronger gradients.

21Z:

22Z:

As our day was winding down, LC continued to indicate areas to watch before it showed up on radar, but I did not grab additional images.

NUCAPS:

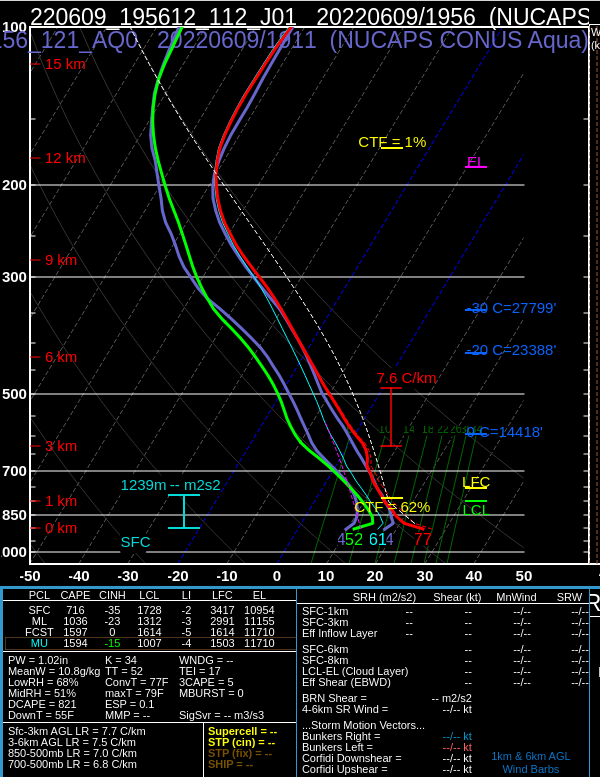
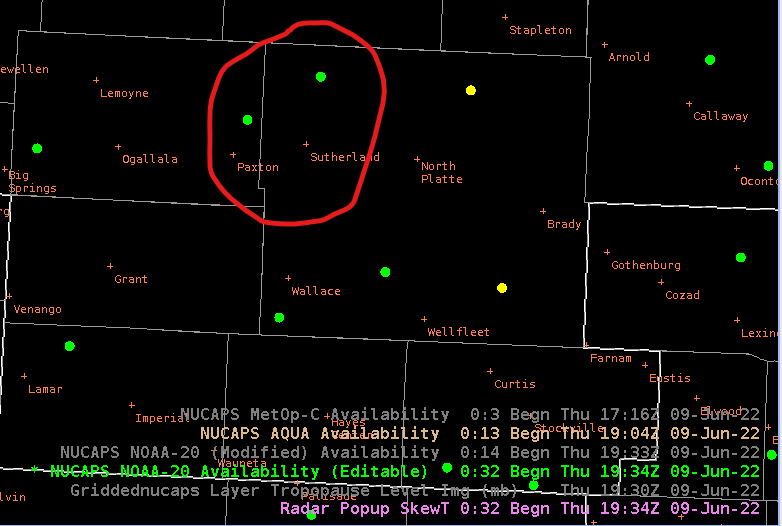
Tried to compare NUCAPS soundings today as we did have an overlap, but unfortunately ran into technical issues within my CAVE so was not able to do much with it. Another limiting factor was that the only “green” soundings from Aqua within our CWA fell within the far western scans which we were told by one of the developers they would next expect good data from, being on the limb. But for comparison, here are Aqua (1911Z) and NOAA-20 (1953Z) sounding from points NW of North Platte.


Points selected were both NW of the town of North Platte, circled below. The NE point of the two is Aqua and SW point is NOAA-20
- Matador