Tuesday, June 7, 2022

Scottsbluff storm

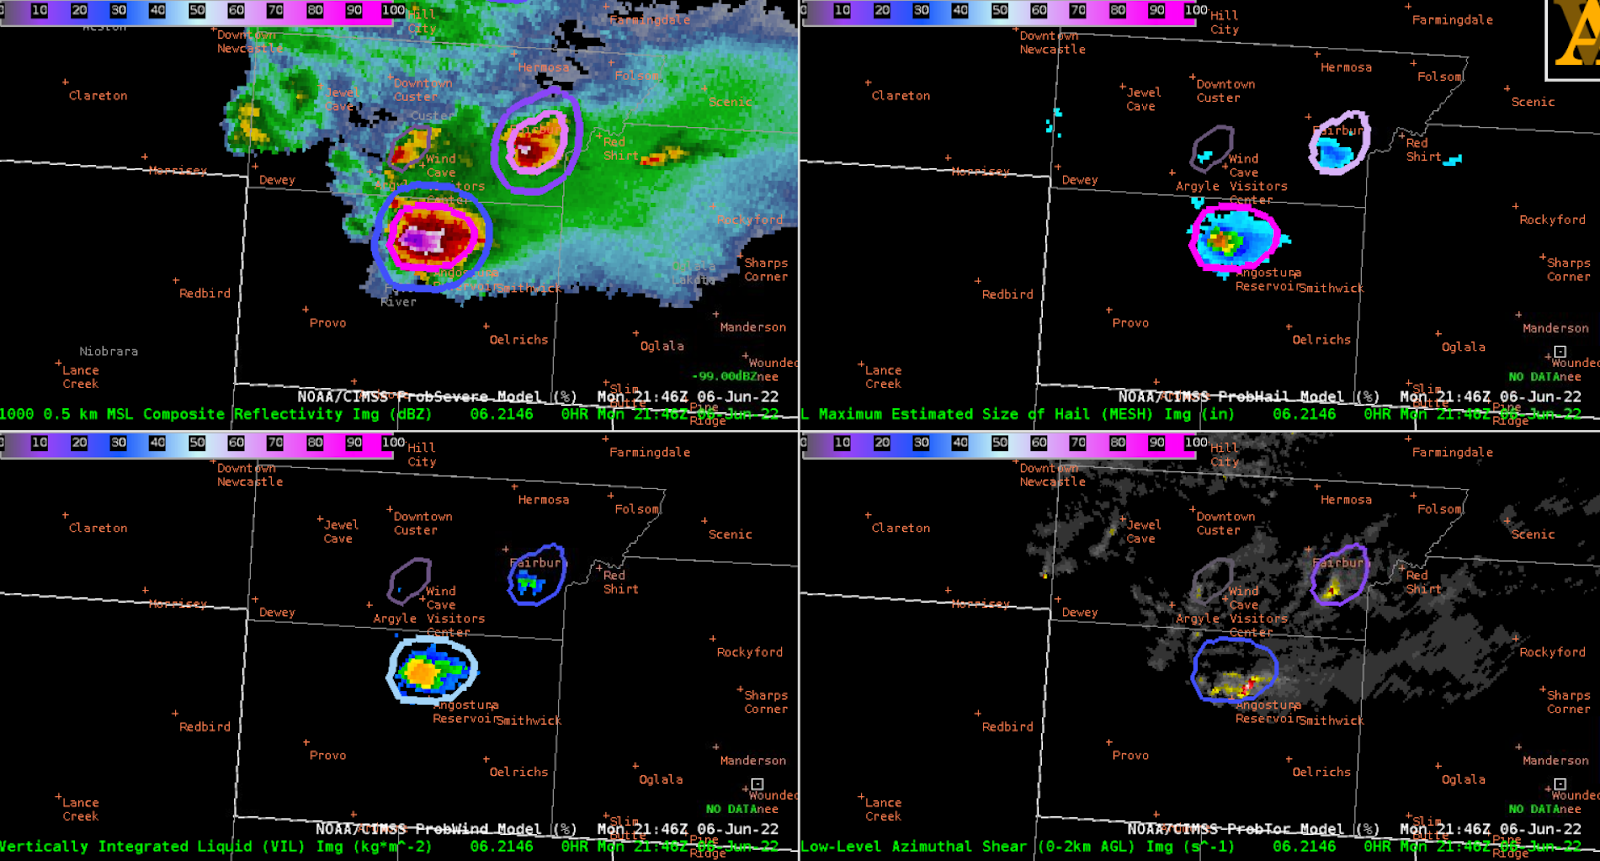
ProbSevere v3 (PSv3) has shown a consistently higher signal than ProbSevere v2 (PSv2) on storm near Scottsbluff, NE. PSv3 was 20-40% higher during the development stage and as it matured. PSv3 also had consistently (and correctly) lower tornado probabilities than PSv2. The elevated tornado probabilities was likely a result of very high MRMS azimuthal shear, which was a result of sidelobe contamination. In this case, ProbTor v3 correctly didn't emphasize the azimuthal shear as much as PTv2. ProbHail v3 has been the highest hazard probability, whereas ProbWind v2 was the highest for version 2. One forecaster noted that v3 is definitely picking up on the hail threat better than v2. Hail up to the size of 1.5"-diameter has been reported thus far. Forecasters have noted that the higher PSv3 values seems to correlate better with their expectations of the storm.

Figure 1: ProbSevere v3, MRMS MergedRef, and NWS severe weather warnings for a storm near Scottsbluff, NE. 


CI in the Mississippi Valley

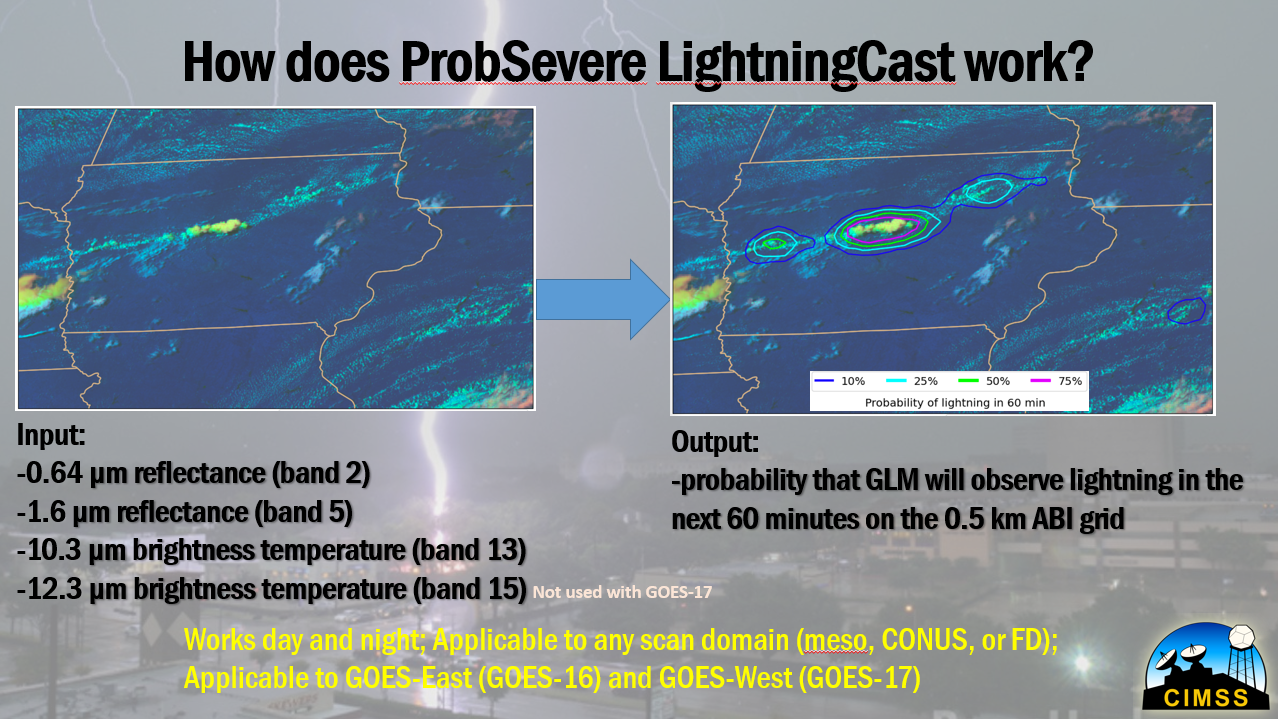
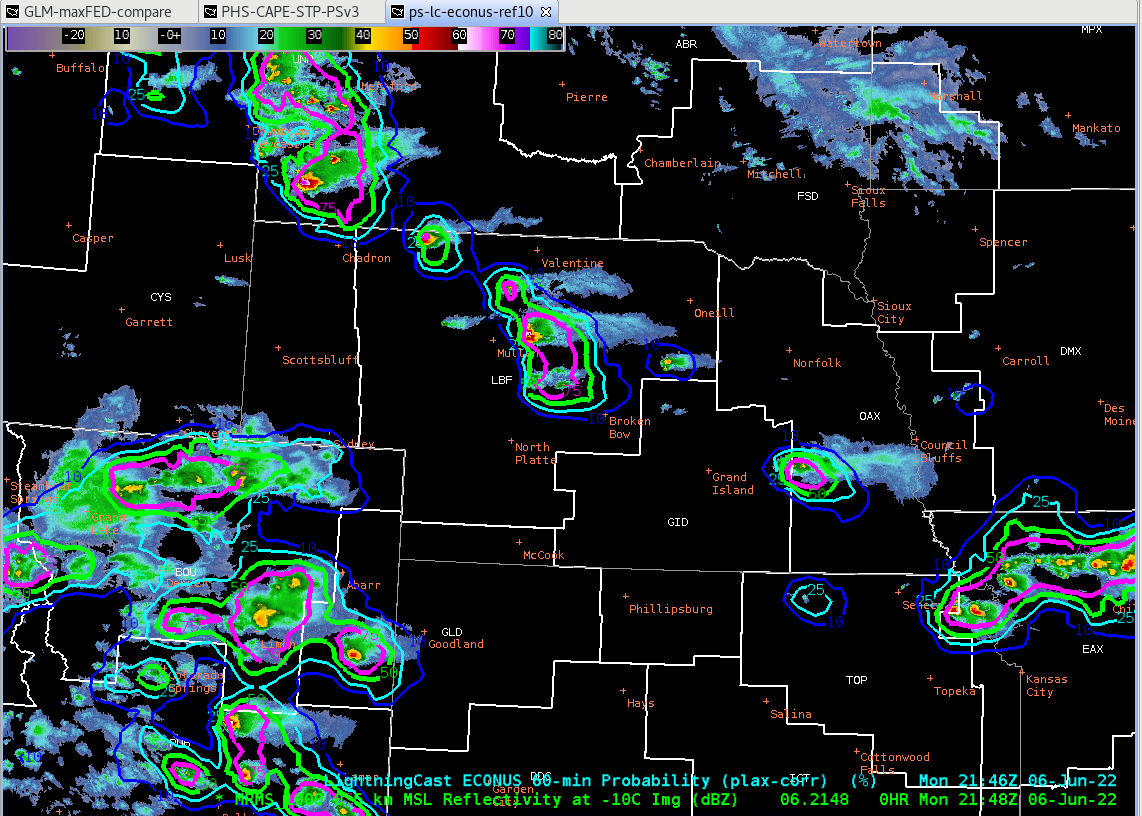
While our HWT forecasters are getting set up in the High Plains today, I wanted to note that LightningCast picked up on convective initiation nicely along a stationary boundary in the mid-Mississippi Valley. While LightningCast can still provide good performance in the presence of overlapping cirrus, it often works best when there is an unobscured view of developing cumulus clouds. In this case, there was lead-time ranging from 15 to 50 minutes prior to the first flash in various cells (measured from the 25% threshold).


PHS CAPE Gradient Use in Mesoanalysis

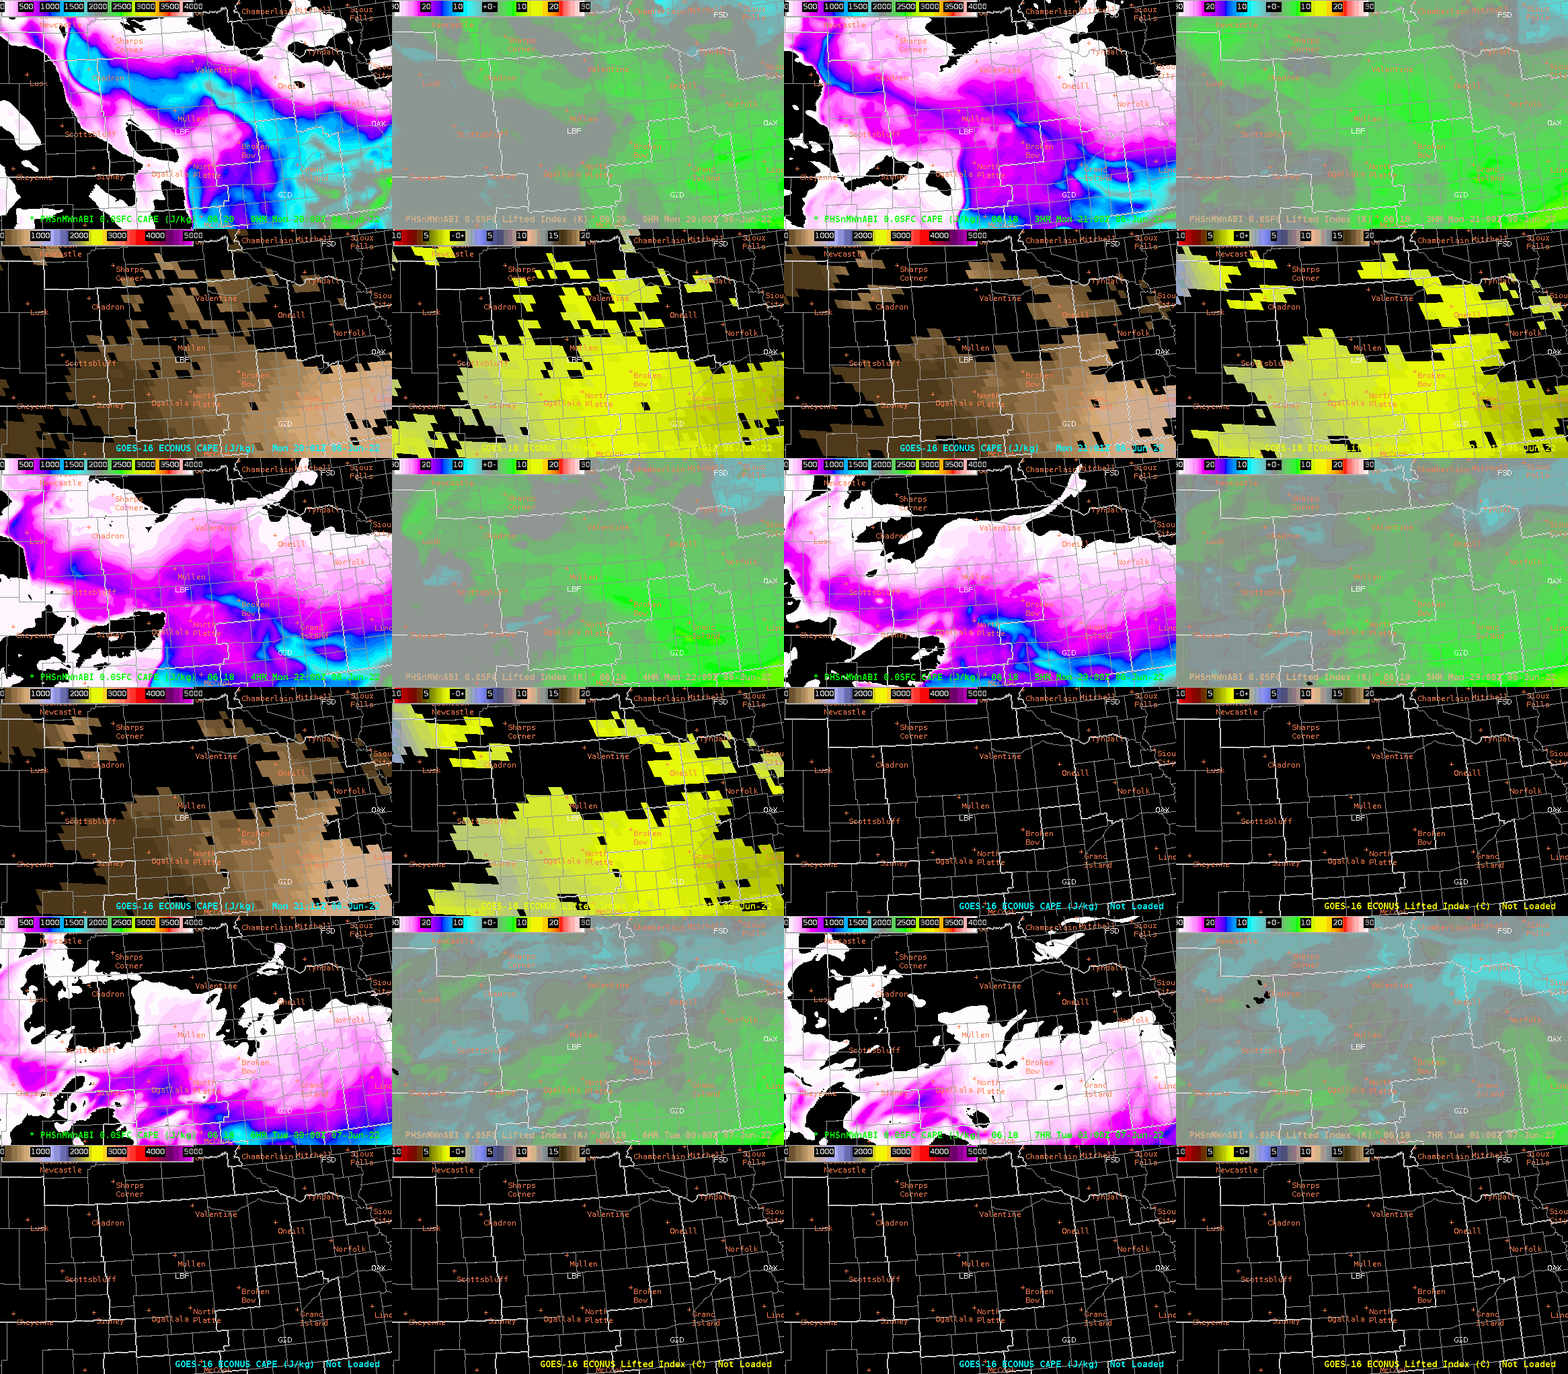
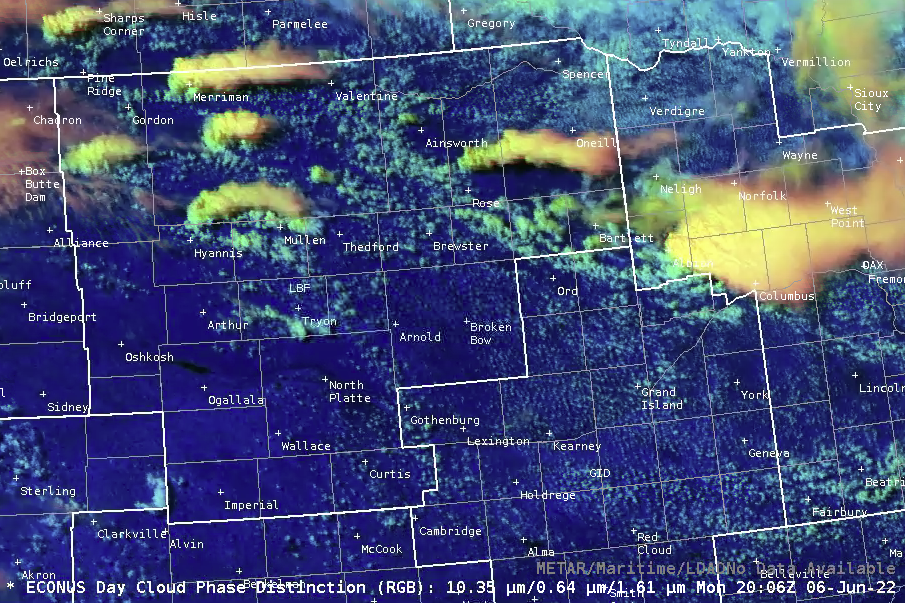
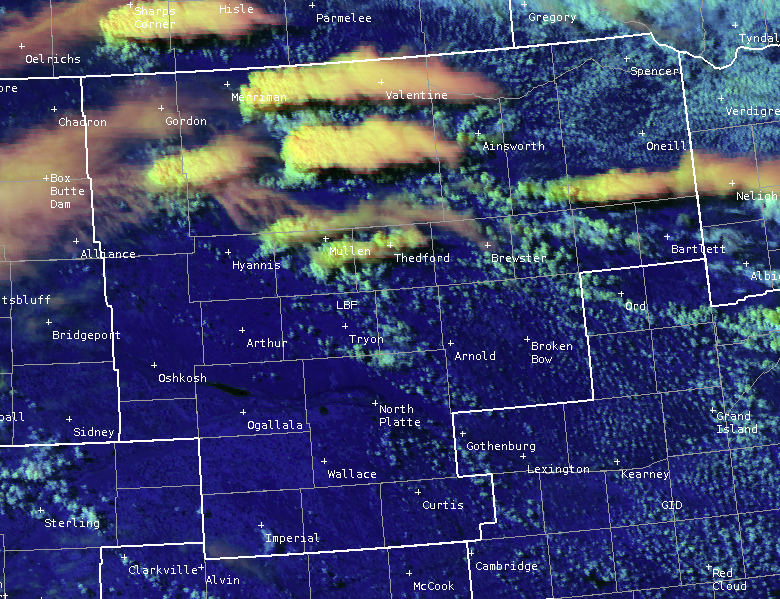
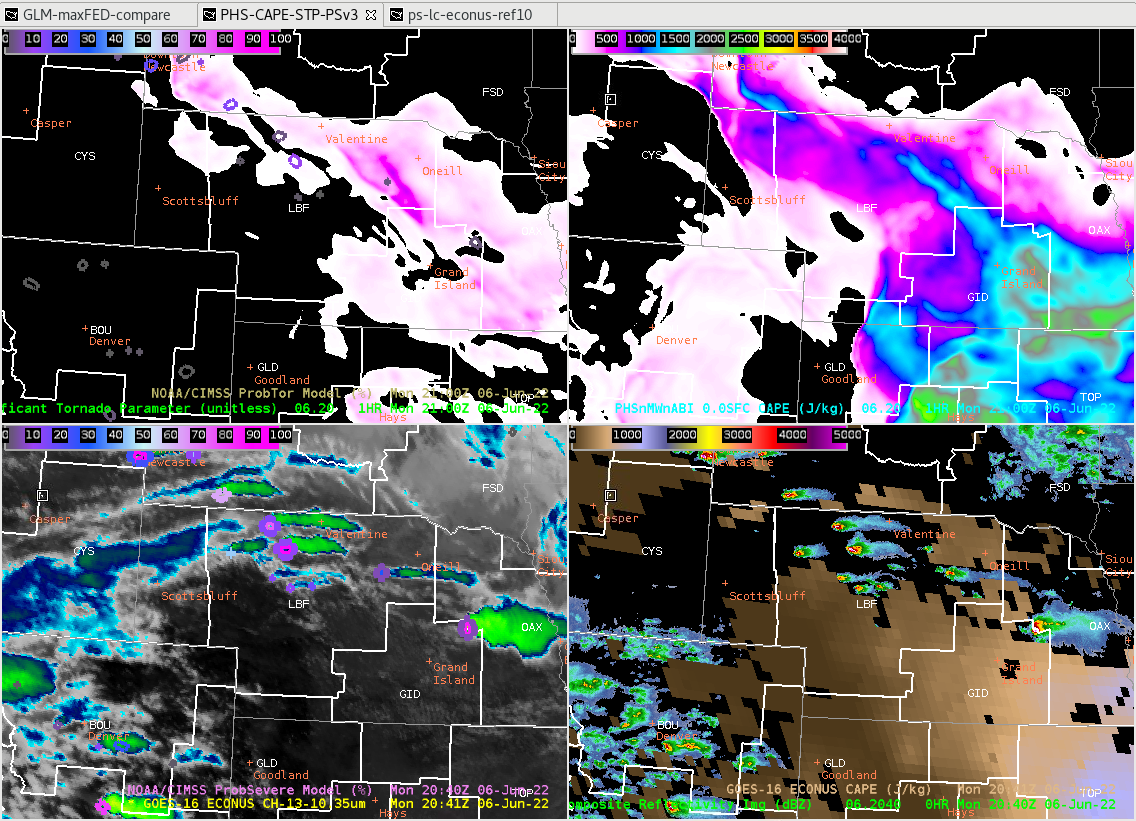
 The PHS Sfc CAPE procedure was helpful in diagnosing the mesoscale environment. In particular, the depiction of CAPE gradients matched well with where the Day-Cloud-Phase Distinction showed where these boundaries lay as could be construed from the cumulus field. 

The PHS Sfc CAPE depicted this surface boundary migrating southward through the central NE through the 21Z-00Z time frame. Observed cells moving left (east) off the boundary into a more stable environment as resolved by the PHS Sfc CAPE field all decreased in intensity and saw their convective updrafts weaken. 

Seeing this after the first hour raised forecast confidence in the forecast thinking of today’s severe weather potential and was shared in a graphicast for this test case scenario. 

PHS-CAPE-STP-PSv3 Procedure from 6/6 @ 20Z to 6/7 @ 01Z

Day-Cloud-Phase Distinction RGB at 20:06Z

- Trip

NUCAPS uses in comparison between separate satellite passes

NUCAPS has been quite useful in comparison between previous passes. (Comparing the NOAA-20 modified and the Aqua), shows how an environment is changing to the south and southeast of the storm cell moving through Custer. We noticed a rapidly changing environment when compared to early afternoon convection. Sfc temperatures and mid level instability increased quite a bit as this storm moved off the higher terrain and into a more favorable mesoscale environment.

NOAA-20 Pass from approximately 19Z. On western SD/NE border.

Aqua Pass from approximately 2030Z. Same location. (On western SD/NE border.)

This increase in surface temperatures as the storm moves into a more favorable environment. Notable spike and jump in Hail core and probabilities.

A notable spike after 2130 for prob hail and prob severe.


-David Spritz


ProbSevere v3 and NUCAPS

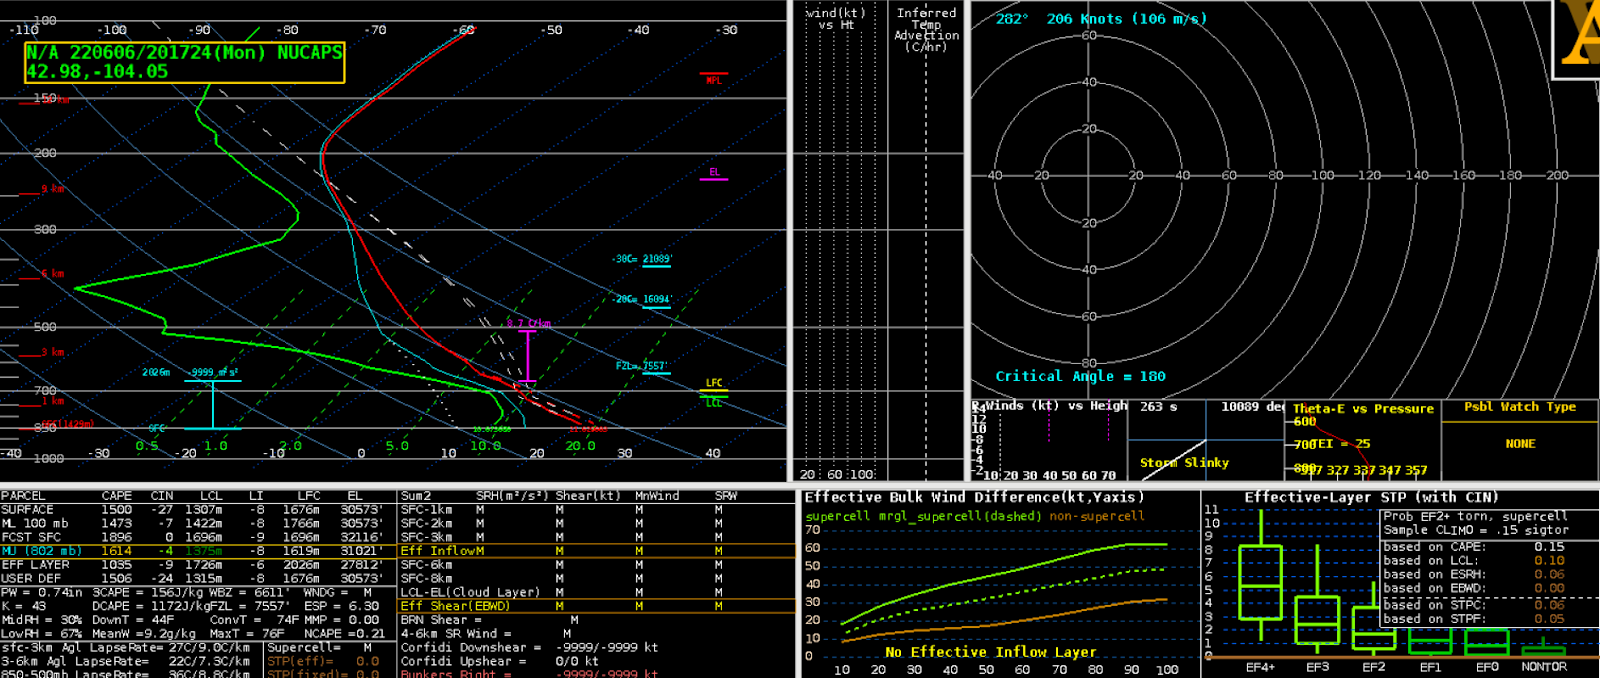
 When analyzing a thunderstorm developing over western South Dakota, a noticeable jump occurs near 20:25 - 20:30 UTC as seen on the ProbSevere Time Series. At this same time, there was a distinct uptick in lightning activity seen in the GLM 4 panel. This would correlate with a strengthening of the thunderstorm at this time. A modified NUCAPS sounding from around this time captured an environment favorable for further strengthening encompassed by steep mid level lapse rates and adequate instability. This thunderstorm was beginning to exhibit severe hail potential.

ProbSevere Time Series

GLM-16 4 panel

Modified NUCAPs sounding ~20 UTC

-2%hatched

PHS CAPE Uses

 Interesting item to note when analyzing PHS forecast CAPE over western South Dakota. This may be terrain induced, but the sharp gradient of CAPE values noted up and and down the western border of South Dakota.  This correlated fairly well with a strong storm or two in the western UNR CWA.

PHS CAPE sharpening gradient in the top left panel.

Wide view of storms in the area using PSv3.

Close in view of several storms on or near that boundary.

David Spritz

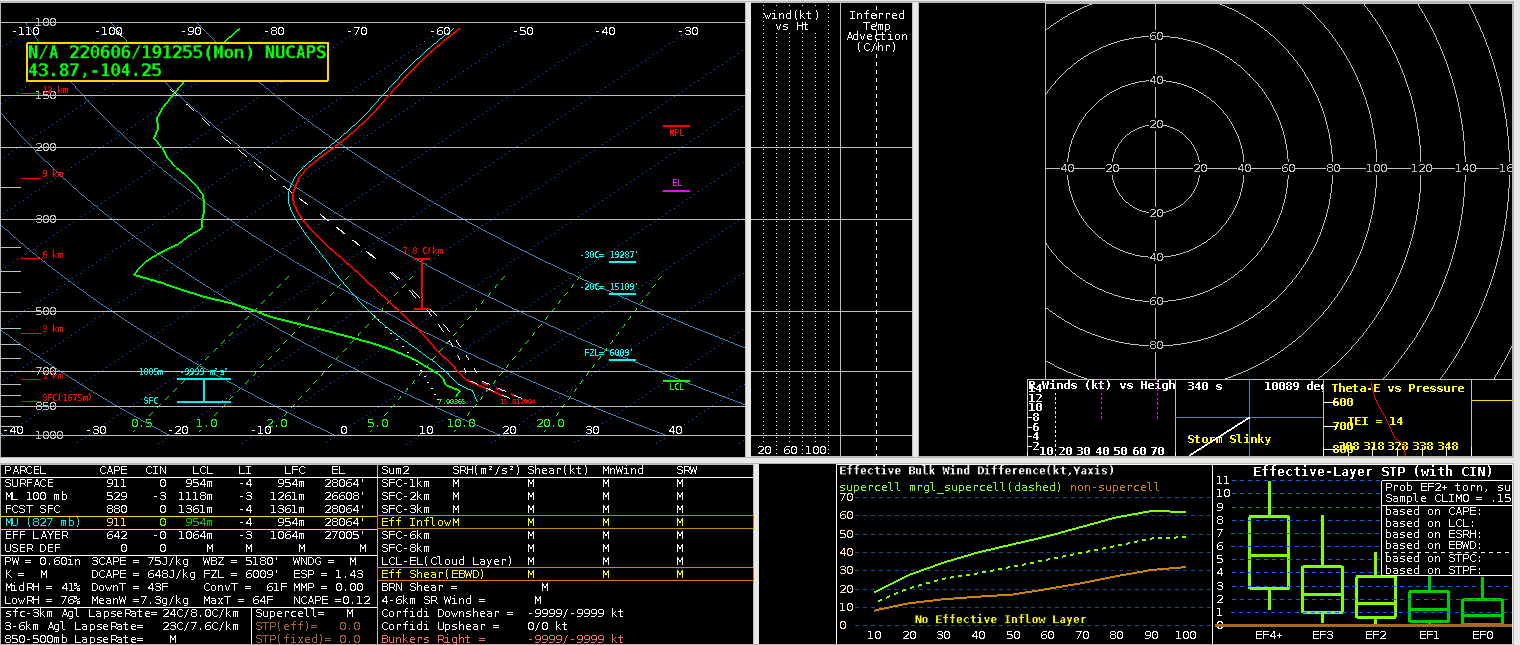
Potential LightningCast limitations under convective debris

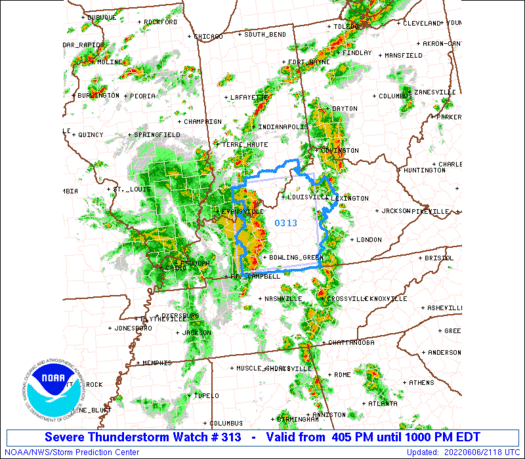
 The first day of familiarization with the tools for the hazardous weather testbed and we were assigned the Louisville CWA to test a number of products on. The synopsis of the area's weather features a line of convection moving in from the west with a Severe Thunderstorm Watch in place and several storms had already been warned on.

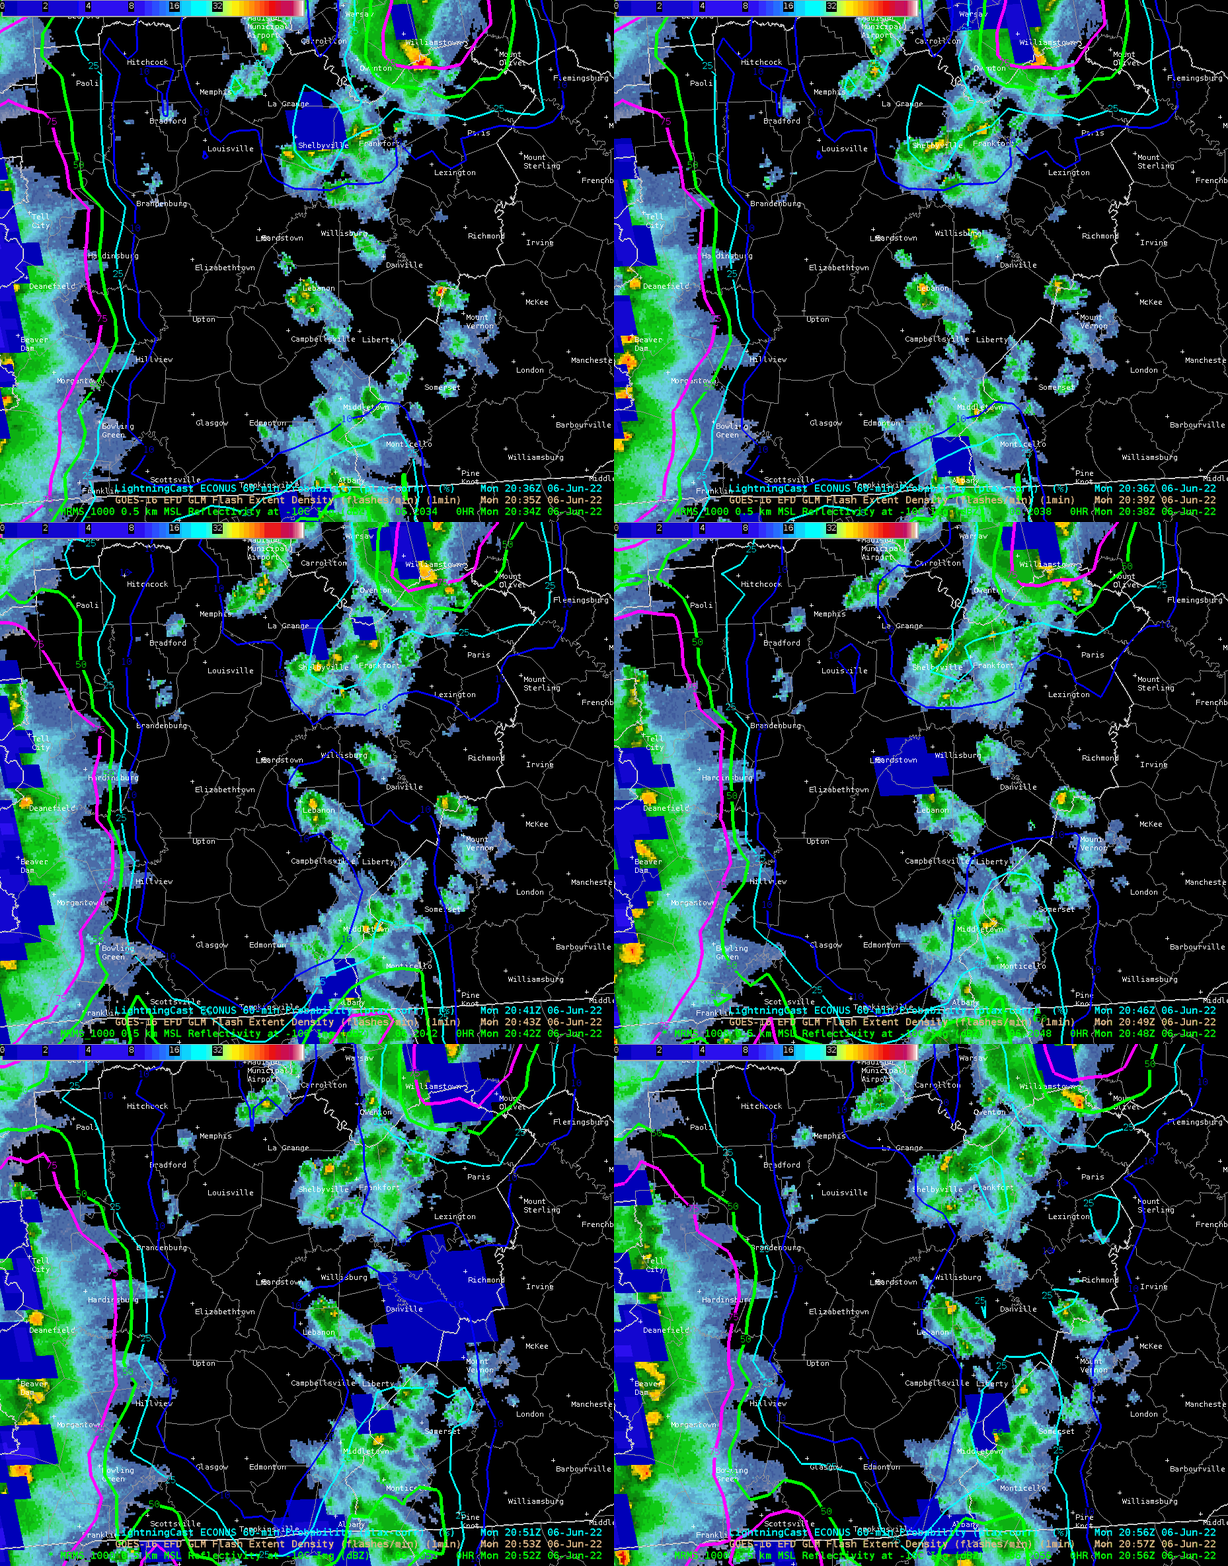
On the other side of the CWA, a few weaker cells had developed under a mix of sun and high clouds. It's this convection across the eastern CWA that became the focus for today's blog. We chose to target the LightningCast product because we noticed that although the -10C MRMS data would suggest lightning, the LightningCast data was actually much lower than anticipated (below 10 percent). Why was this the case?

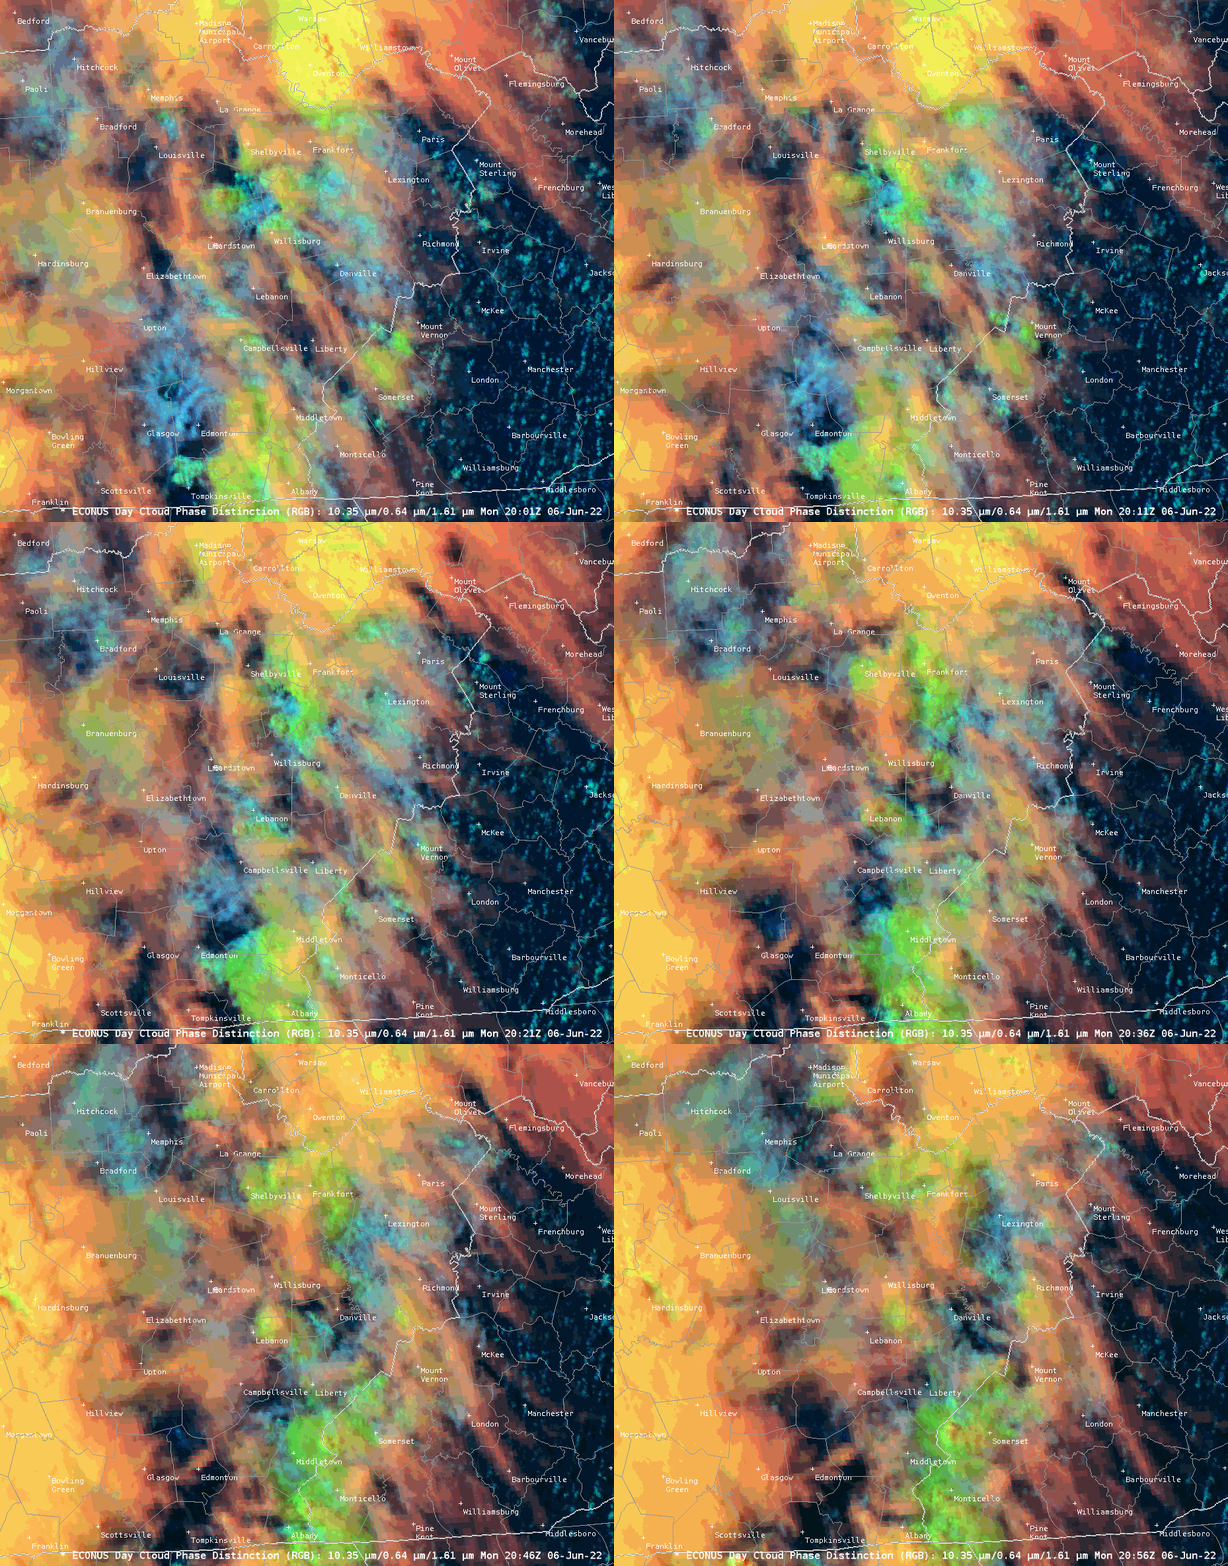
After speaking with John Cintineo about this, and looking at the training that was provided for this testbed, it was surmised that this may be a case where convective debris or high clouds could mask the signal of weaker convection.

 Eventually LightningCast did highlight this area with a lightning risk, but this case is relevant because if we are using this tool to aid in DSS to our partners, we must also identify some potential limitations.

Noctilucent/Mr. Bean


LBF Day 1 HWT Blog

 Day 1

Acting as LBF

This image was used in a graphicast to which we then added areas of concern over the next several hours and storm direction.

PHS, ProbSevere

Enjoyed using PHS, especially getting the heads up at the beginning of today’s session to watch along the value gradients for stronger storms. That tip fit the bill for what we were seeing today and higher prob severe seemed to follow the gradient as well. I have not had much practice with version 2 of probsevere, so I cannot not really compare it to version 3. However, I did find version 3 useful today, especially with all the readout information breaking down the threat level for each type of severe hazard as well as mesh values.


2041 UTC

2141 UTC

LightningCast

From an IDSS standpoint, the Lightningcast is nice to use to give a heads up and see trends in lightning.

For GLM, I really liked decreasing the max value. Seems to work well in these smaller cells to highlight which cells to watch for.


- Matador

Monday, June 6, 2022

Storm on the High Plains

A storm developed quickly in eastern Wyoming, but the lowest tilts from the KUDX radar were partially blocked by the Black Hills in western South Dakota. Fortunately, ProbSevere utilizes MRMS, which merges nearby radars observations. However, in this part of the country, the "nearby" radars are not all that close. ProbSevere v3 also uses GOES-R satellite growth rates and output from the GOES ABI+GLM-based IntenseStormNet, which capitalizes on storm-top patterns in visible and long-wave IR bands, and internal electrification. 

In this storm, the GOES-R satellite growth rate helped contribute to higher PSv3 early on this storm's life. You can see the growing towers in GOES ABI imagery (Figure 1).

Figure 1: Growing Cb in northeast Wyoming

ProbSevere v3 (PSv3) was 15-30% greater than ProbSevere v2 for this storm, 15-20 minutes before the first warning was issued. Part of the reason for this was the 4.4%/min satellite growth rate, which was designated as "strong". An HWT forecaster noted that PSv3 had a good handle on this storm.

Figure 2: ProbSevere v3 at the time of the first warning.


ProbSevere products for a storm in North Carolina

A storm in North Carolina produced 75-mph microburst wind gusts, downing many trees and overturning a pick-up truck. It also produced 1.5"-diameter hail.

Early on, ProbSevere LightningCast produced high probabilities of lightning well ahead of the first flashes (see Figure 1). LightningCast uses GOES-R ABI channels to predict next-hour lightning occurrence. For the  storm that produced severe weather (in eastern NC), LightningCast had 60 minutes of lead-time to the first flashes, measured from the 50% threshold. LightningCast often produces 20-30 minutes of lead-time to the first flash (see Figure 2).

Figure 1: LightningCast contours, GOES-16 ABI visible channel imagery, and GOES-16 GLM flash-extent density over the Carolinas.

Figure 2: Varying lead-times to initial GLM-observed flashes in coastal Carolina storms, measured from certain LightningCast probability thresholds.

ProbSevere version 3 (PSv3), which fuses radar, satellite, lightning, and NWP data to predict next-hour severe-weather probabilities, had an elevated probability of severe on the storm in eastern North Carolina before severe weather was reported. PSv3 was much higher than ProbSevere v2 (PSv2) early on. For instance, at 18:04 UTC, 21 minutes before the 75-mph wind gust, PSv3 was 39% and PSv2 was 2%. The 0-3 km lapse rate and MRMS MESH were the highest-contributing predictors, with the ENI lightning density and GOES-R satellite growth rate also contributing to the 39% probability of severe.


Figure 3: ProbSevere contours, MRMS MergedReflectivity, and NWS severe-weather warnings for storms in eastern North Carolina


Figure 4: The soon-to-be-severe North Carolina storm at 18:04 UTC, comparing PSv3 and PSv2.

Figure 5: Time series of ProbSevere v3 and ProbSevere v2 probabilities for the early portion of the severe storm in eastern North Carolina.