Tuesday, June 7, 2022

LBF Day 1 HWT Blog

 Day 1

Acting as LBF

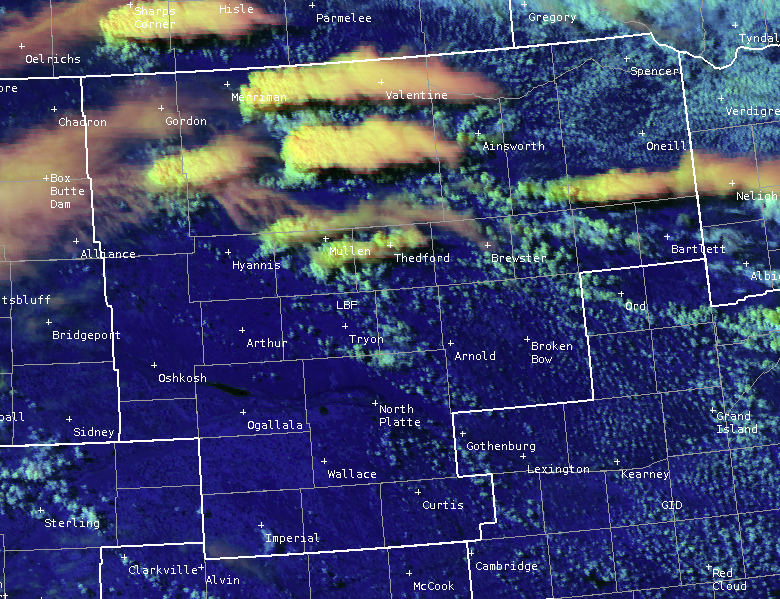
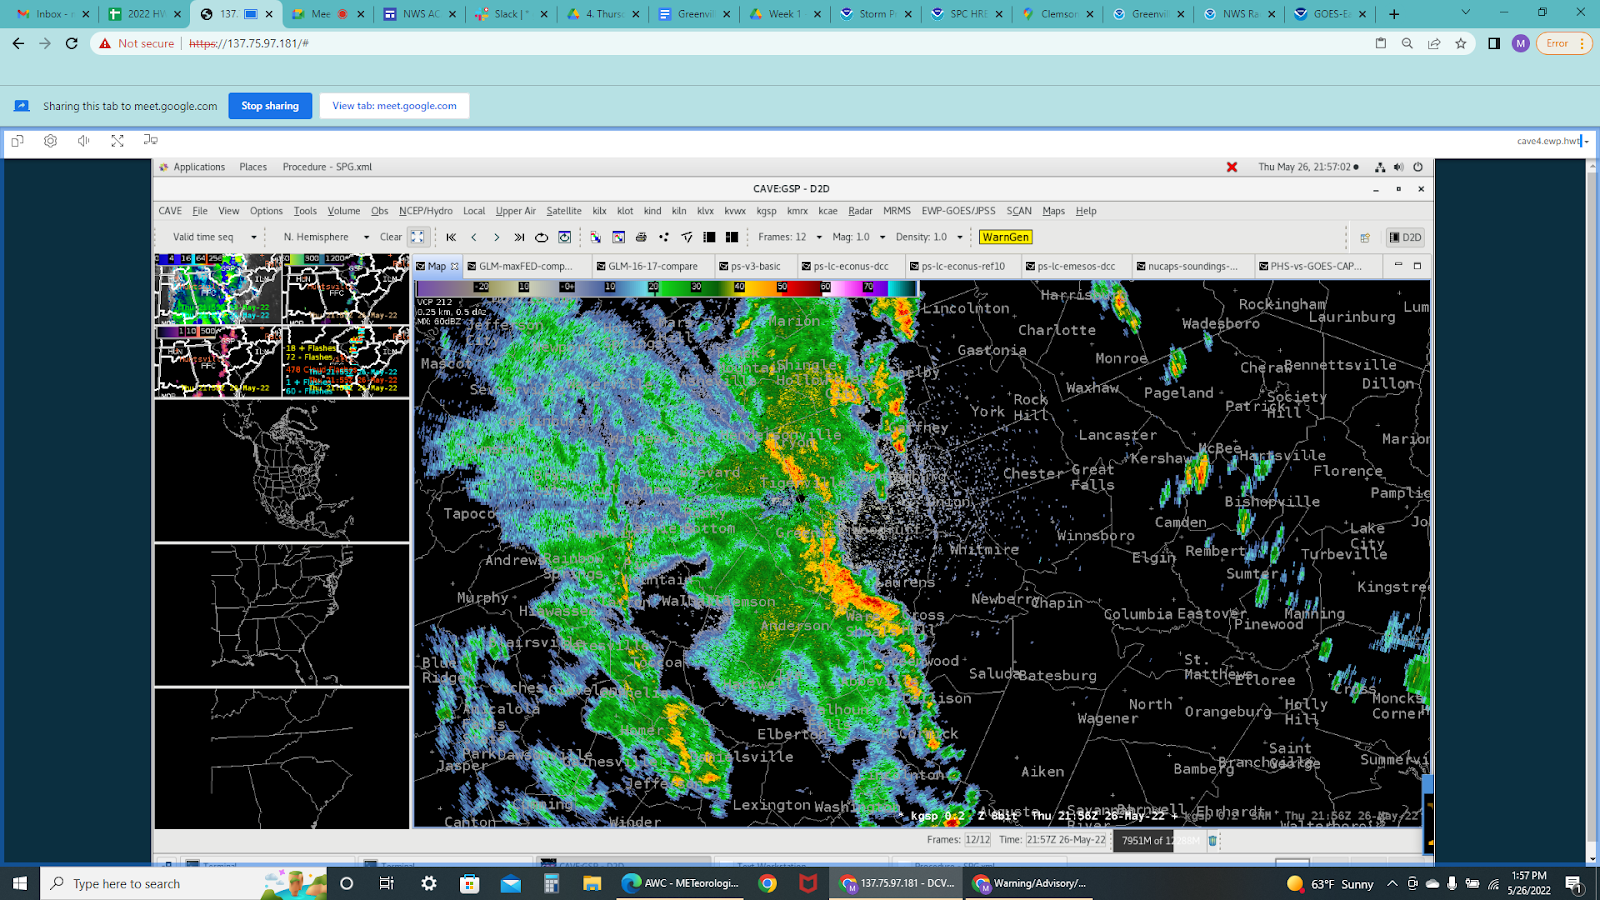
This image was used in a graphicast to which we then added areas of concern over the next several hours and storm direction.

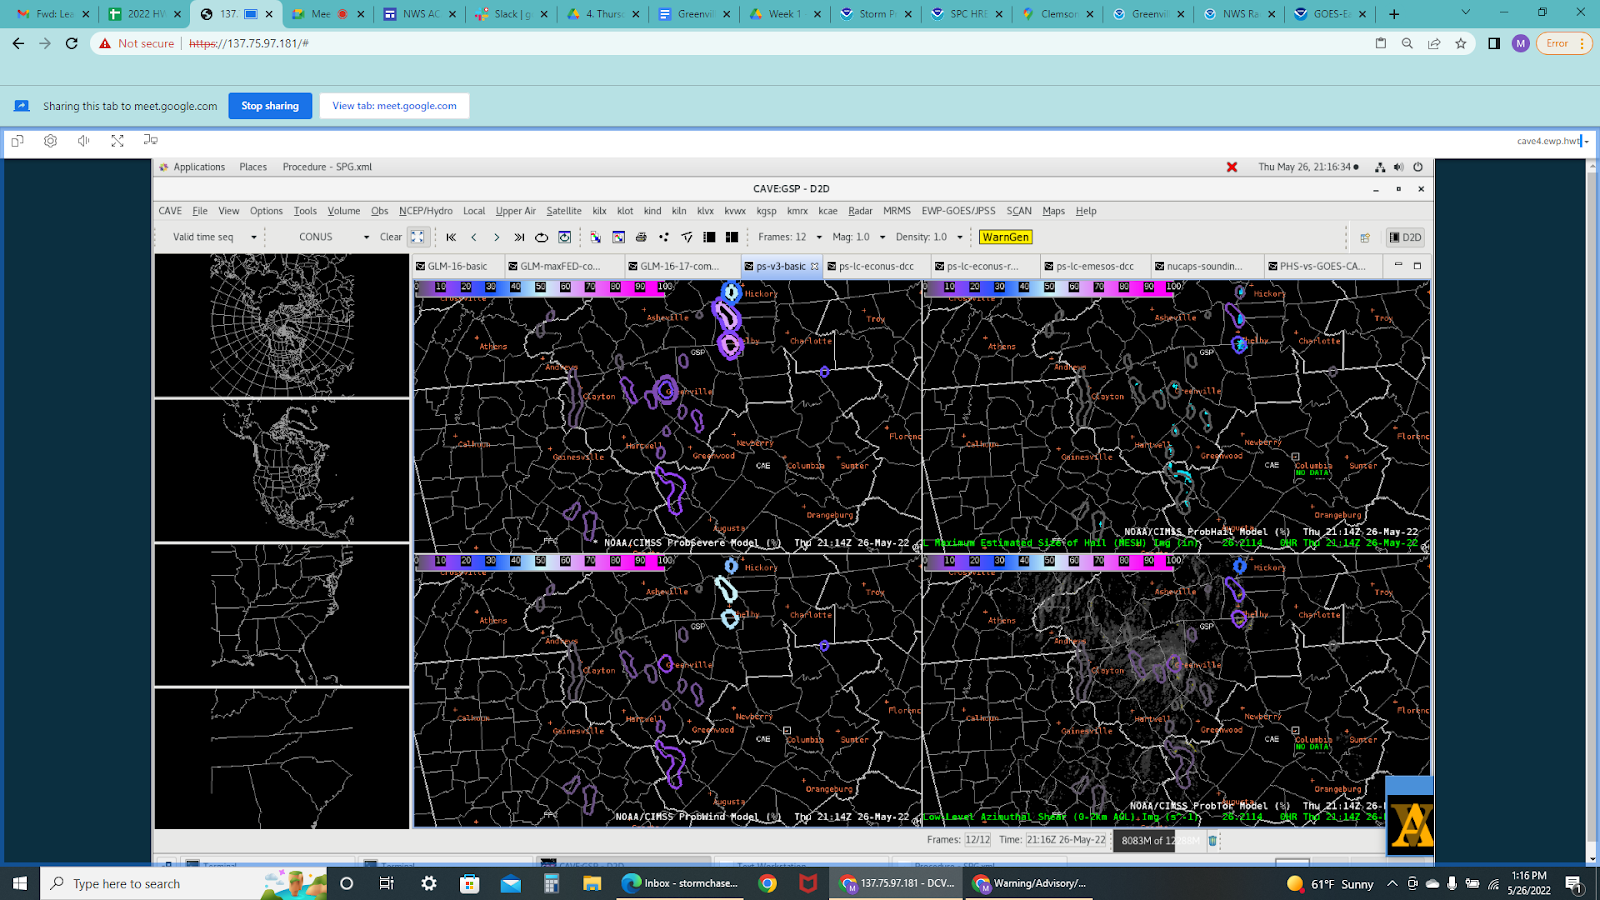
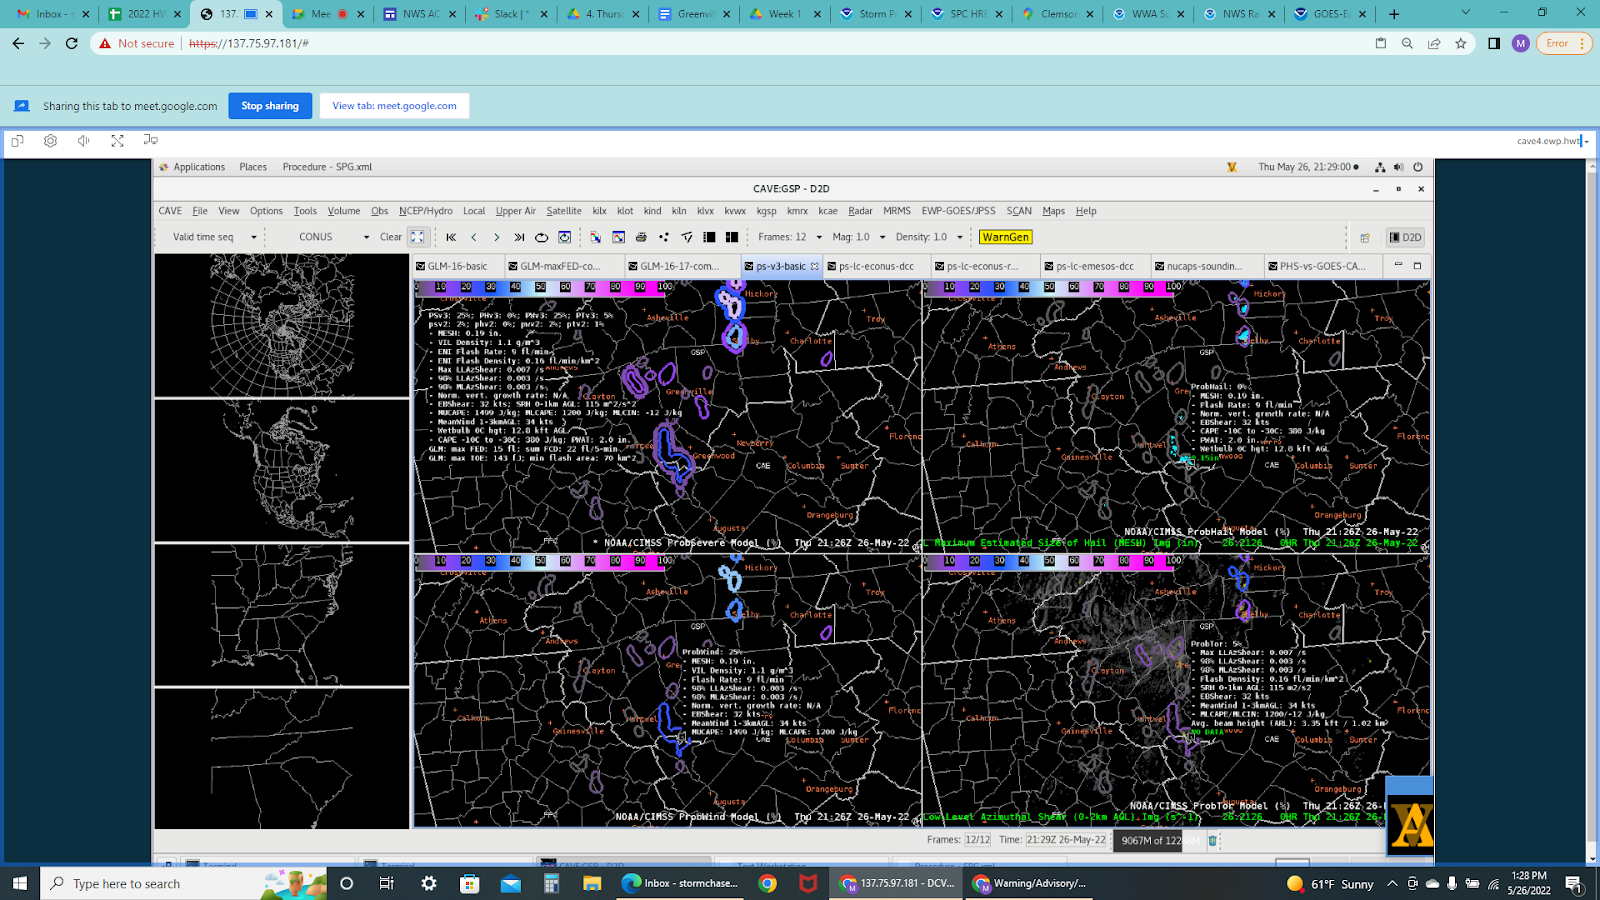
PHS, ProbSevere

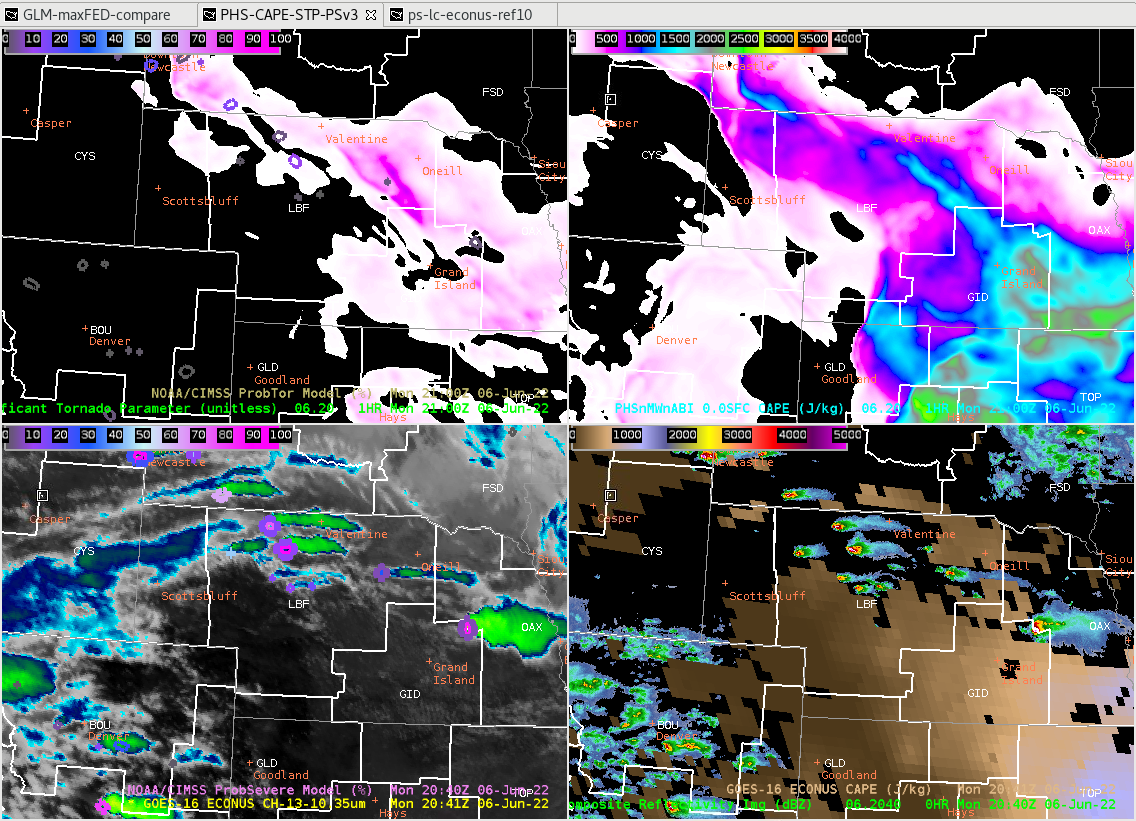
Enjoyed using PHS, especially getting the heads up at the beginning of today’s session to watch along the value gradients for stronger storms. That tip fit the bill for what we were seeing today and higher prob severe seemed to follow the gradient as well. I have not had much practice with version 2 of probsevere, so I cannot not really compare it to version 3. However, I did find version 3 useful today, especially with all the readout information breaking down the threat level for each type of severe hazard as well as mesh values.


2041 UTC

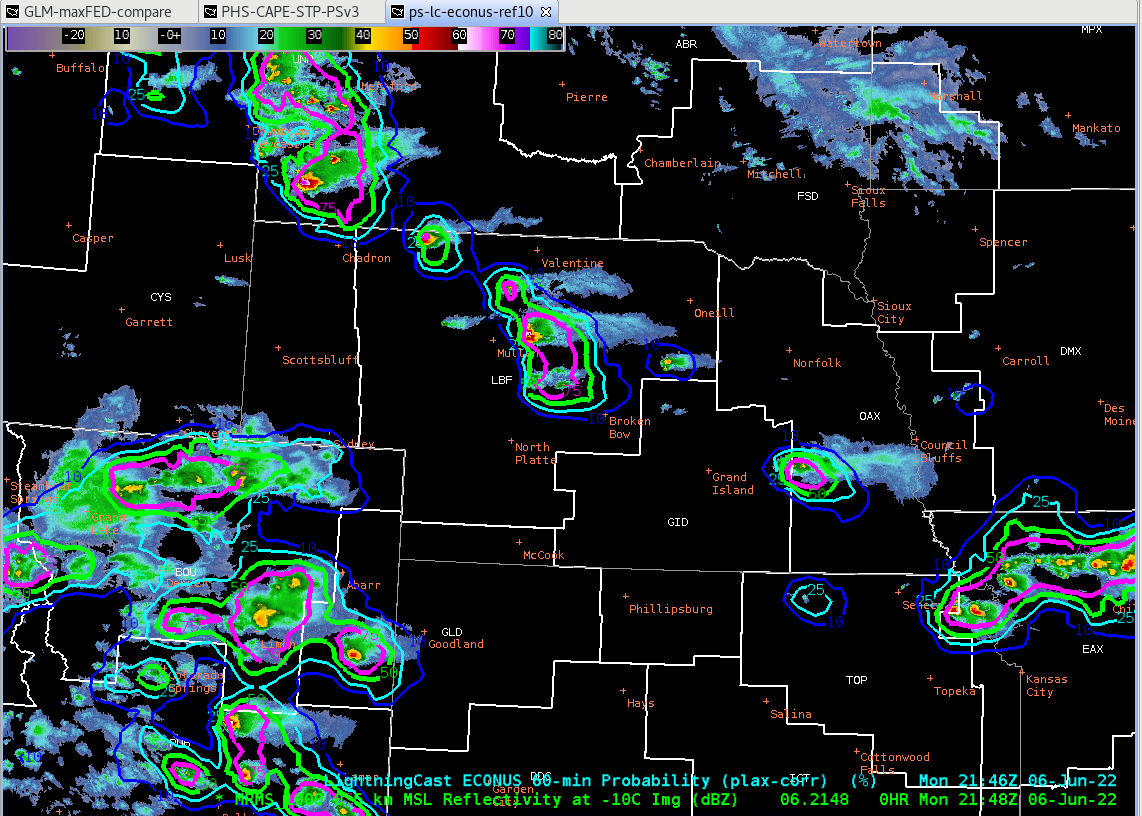
2141 UTC

LightningCast

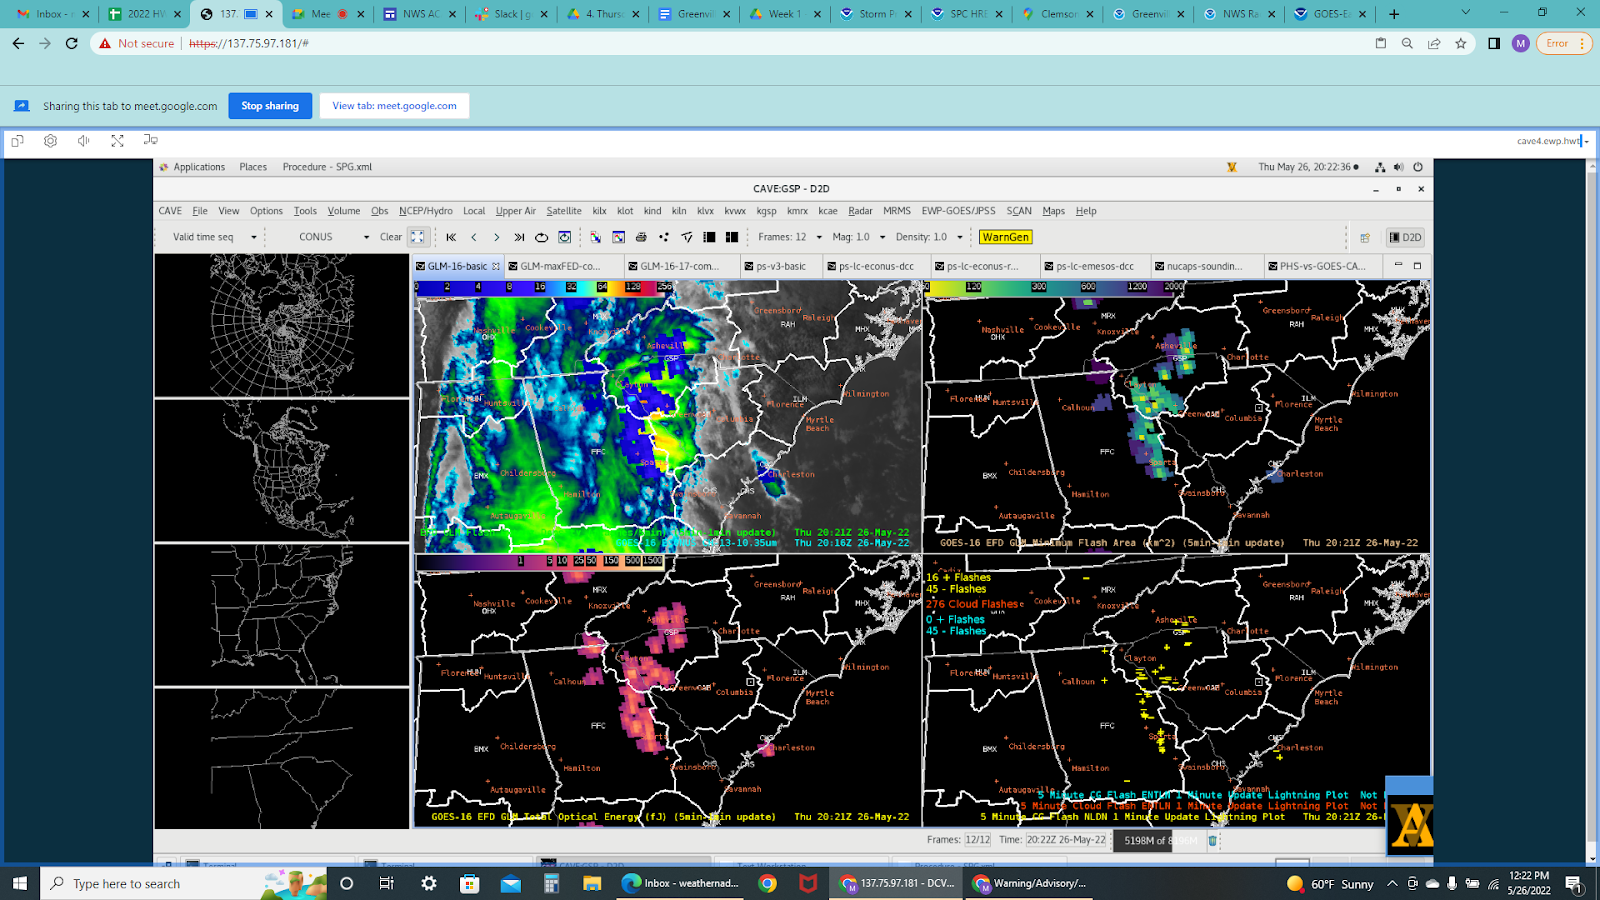
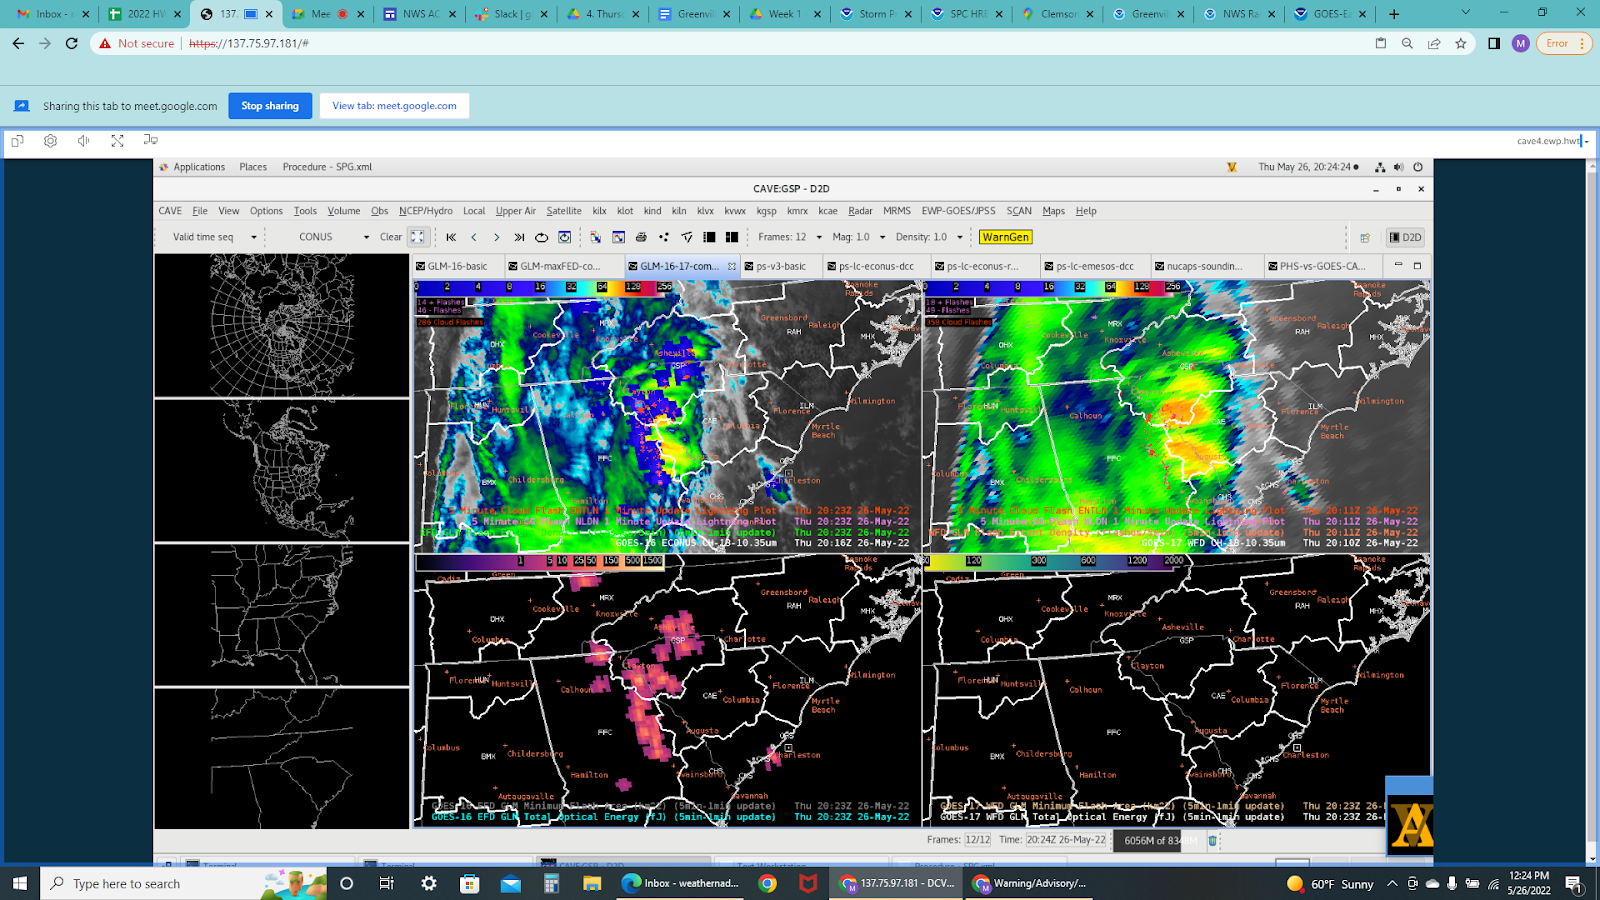
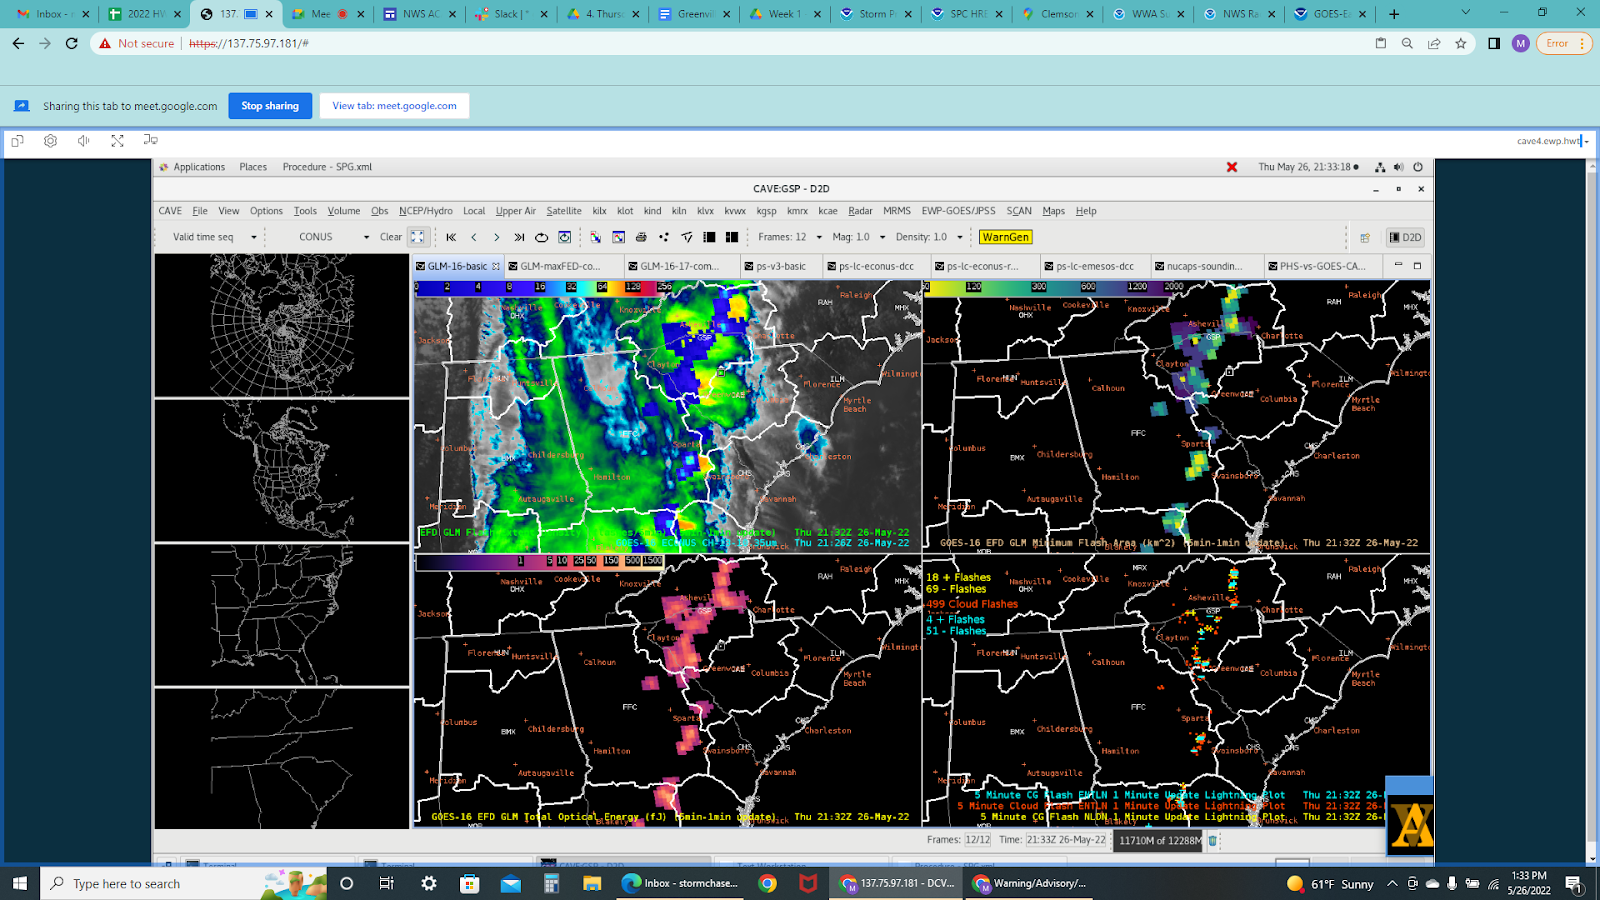
From an IDSS standpoint, the Lightningcast is nice to use to give a heads up and see trends in lightning.

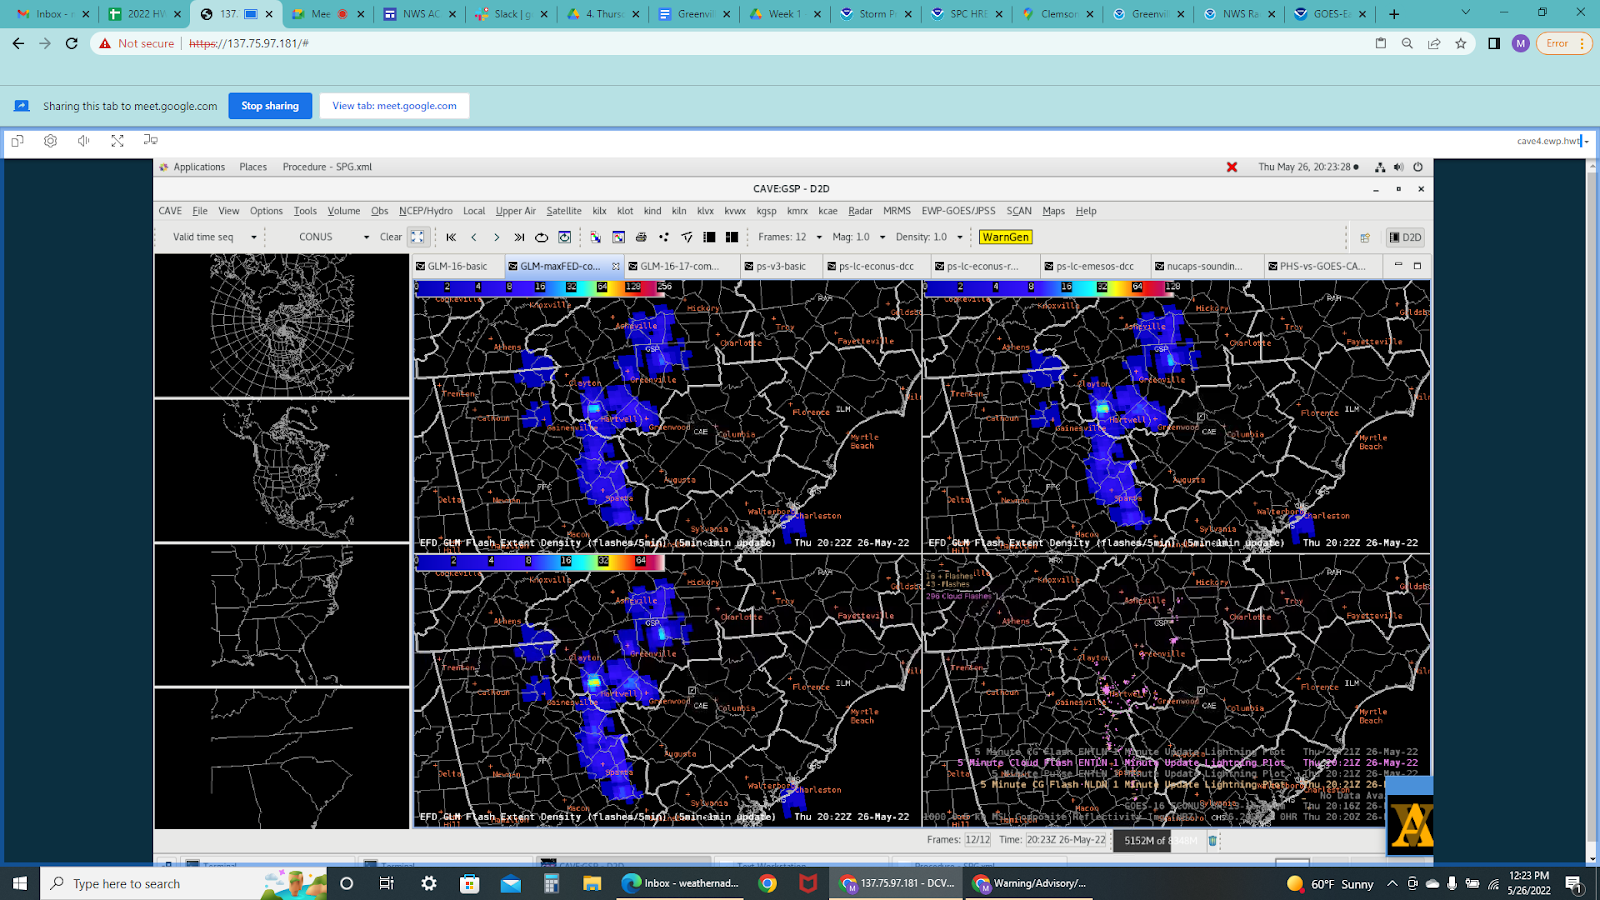
For GLM, I really liked decreasing the max value. Seems to work well in these smaller cells to highlight which cells to watch for.


- Matador

Monday, June 6, 2022

Storm on the High Plains

A storm developed quickly in eastern Wyoming, but the lowest tilts from the KUDX radar were partially blocked by the Black Hills in western South Dakota. Fortunately, ProbSevere utilizes MRMS, which merges nearby radars observations. However, in this part of the country, the "nearby" radars are not all that close. ProbSevere v3 also uses GOES-R satellite growth rates and output from the GOES ABI+GLM-based IntenseStormNet, which capitalizes on storm-top patterns in visible and long-wave IR bands, and internal electrification. 

In this storm, the GOES-R satellite growth rate helped contribute to higher PSv3 early on this storm's life. You can see the growing towers in GOES ABI imagery (Figure 1).

Figure 1: Growing Cb in northeast Wyoming

ProbSevere v3 (PSv3) was 15-30% greater than ProbSevere v2 for this storm, 15-20 minutes before the first warning was issued. Part of the reason for this was the 4.4%/min satellite growth rate, which was designated as "strong". An HWT forecaster noted that PSv3 had a good handle on this storm.

Figure 2: ProbSevere v3 at the time of the first warning.


ProbSevere products for a storm in North Carolina

A storm in North Carolina produced 75-mph microburst wind gusts, downing many trees and overturning a pick-up truck. It also produced 1.5"-diameter hail.

Early on, ProbSevere LightningCast produced high probabilities of lightning well ahead of the first flashes (see Figure 1). LightningCast uses GOES-R ABI channels to predict next-hour lightning occurrence. For the  storm that produced severe weather (in eastern NC), LightningCast had 60 minutes of lead-time to the first flashes, measured from the 50% threshold. LightningCast often produces 20-30 minutes of lead-time to the first flash (see Figure 2).

Figure 1: LightningCast contours, GOES-16 ABI visible channel imagery, and GOES-16 GLM flash-extent density over the Carolinas.

Figure 2: Varying lead-times to initial GLM-observed flashes in coastal Carolina storms, measured from certain LightningCast probability thresholds.

ProbSevere version 3 (PSv3), which fuses radar, satellite, lightning, and NWP data to predict next-hour severe-weather probabilities, had an elevated probability of severe on the storm in eastern North Carolina before severe weather was reported. PSv3 was much higher than ProbSevere v2 (PSv2) early on. For instance, at 18:04 UTC, 21 minutes before the 75-mph wind gust, PSv3 was 39% and PSv2 was 2%. The 0-3 km lapse rate and MRMS MESH were the highest-contributing predictors, with the ENI lightning density and GOES-R satellite growth rate also contributing to the 39% probability of severe.


Figure 3: ProbSevere contours, MRMS MergedReflectivity, and NWS severe-weather warnings for storms in eastern North Carolina


Figure 4: The soon-to-be-severe North Carolina storm at 18:04 UTC, comparing PSv3 and PSv2.

Figure 5: Time series of ProbSevere v3 and ProbSevere v2 probabilities for the early portion of the severe storm in eastern North Carolina.


Friday, June 3, 2022

Scourge of Jersey

A short-wave trough departing the U.S. east coast spawned numerous storms in the Mid-Atlantic states yesterday. One storm politely waited until crossing the Delaware River to start producing severe wind gusts, toppling numerous power lines and trees, some onto homes and cars.

ProbSevere version 3 (PSv3) had a better handle on this storm than version 2, being consistently 30-40% higher in the 30 minutes prior to the first NWS severe thunderstorm warning being issued. PSv3 is being evaluated by NWS forecasters in the HWT this year, its second year of evaluation.


Figure 1: ProbSevere v3 contours, MRMS MergedReflectivity, and NWS severe weather warnings for a storm in Pennsylvania and New Jersey.


Figure 2: Comparing ProbSevere v3 and v2 shortly before the first warning was issued.


Figure 3: Time series of ProbSevere v3 probabilities, local storm reports, and NWS severe weather warnings for this storm.

At 20:08 UTC (in Figure 2), the top six contributing predictors in ProbSevere v3 were the ENI lightning density (0.76 fl/min/km^2), effective bulk shear (47 kt), 0-3 km lapse rate (7.2 C/km), mid-level azimuthal shear (0.007 /s; moderate), the significant tornado parameter-effective (0.15), and the satellite growth rate (1.5%/min; weak). The machine-learning models in PSv3 are able to better discern complex predictor interactions than the models of PSv2.

Tuesday, May 31, 2022

GLM and Minimum Flash Area

 Lightning energy during the HWT was introduced in several different ways. Three of these were:

  1. Flash Extent Density
  2. Minimum Flash Area
  3. Total Optical Energy

For monitoring severe thunderstorms, Flash Extent Density seemed to be the most useful of the three.

However, all of the GLM products were what we focused on.

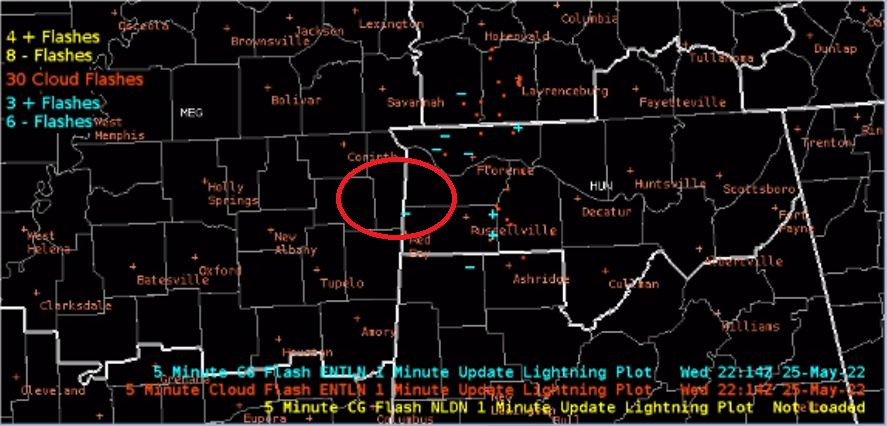
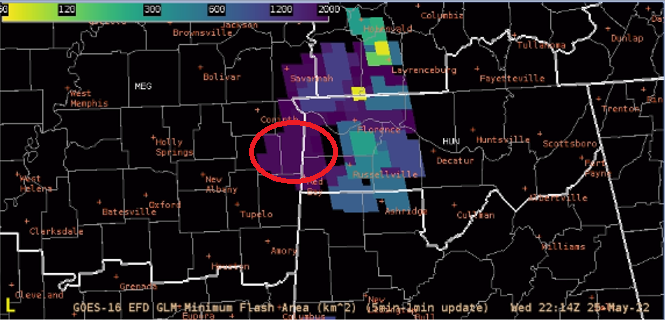
In order to obtain GLM lightning data on the grid or map, you had to obtain a Minimum Flash Area. It was interesting in the stratiform type storms that a wide area was displayed compared to the small area where the flash took place. In this case it was one cloud-to-ground lightning strike (CG).

This image is from the Bottom-Right panel (CG and Cloud Flashes):


This is the top-right panel (Minimum Flash Area):

This shows that one CG Flash can plot a large area on the Minimum Flash Area product. It seemed that this was necessary for other products to plot, such as the Flash Extent Density, but it may be a little bit of a distraction for the operational forecaster as it would seem to flash a bit (on and off if looping it) and for a much larger area than what was shown compared to the cloud Flash and CG plots.

- WeatherTed


Friday, May 27, 2022

Greenville SC Observations

 Synopsis: A deep upper low tracked slowly northeastward across Missouri today. The main cold front associated with this low moved across the Greenville, SC region. Along and ahead of the front, widespread showers and thunderstorms continued over western South Carolina for most of the afternoon and evening hours.  

Our DSS messaging was for Softball Tournament Games located at Clemson University.

SPC Convective Outlook: Slight risk of thunderstorms over extreme northwestern SC, with marginal risk elsewhere.

Primary threat was wind flash flooding and wind with a chance of hail and a possible tornado.

Scattered showers and thunderstorms tracking northward across the forecast area.

IR imagery overlaid with lightning data.

Greenville ACARS sounding taken in 1910Z.

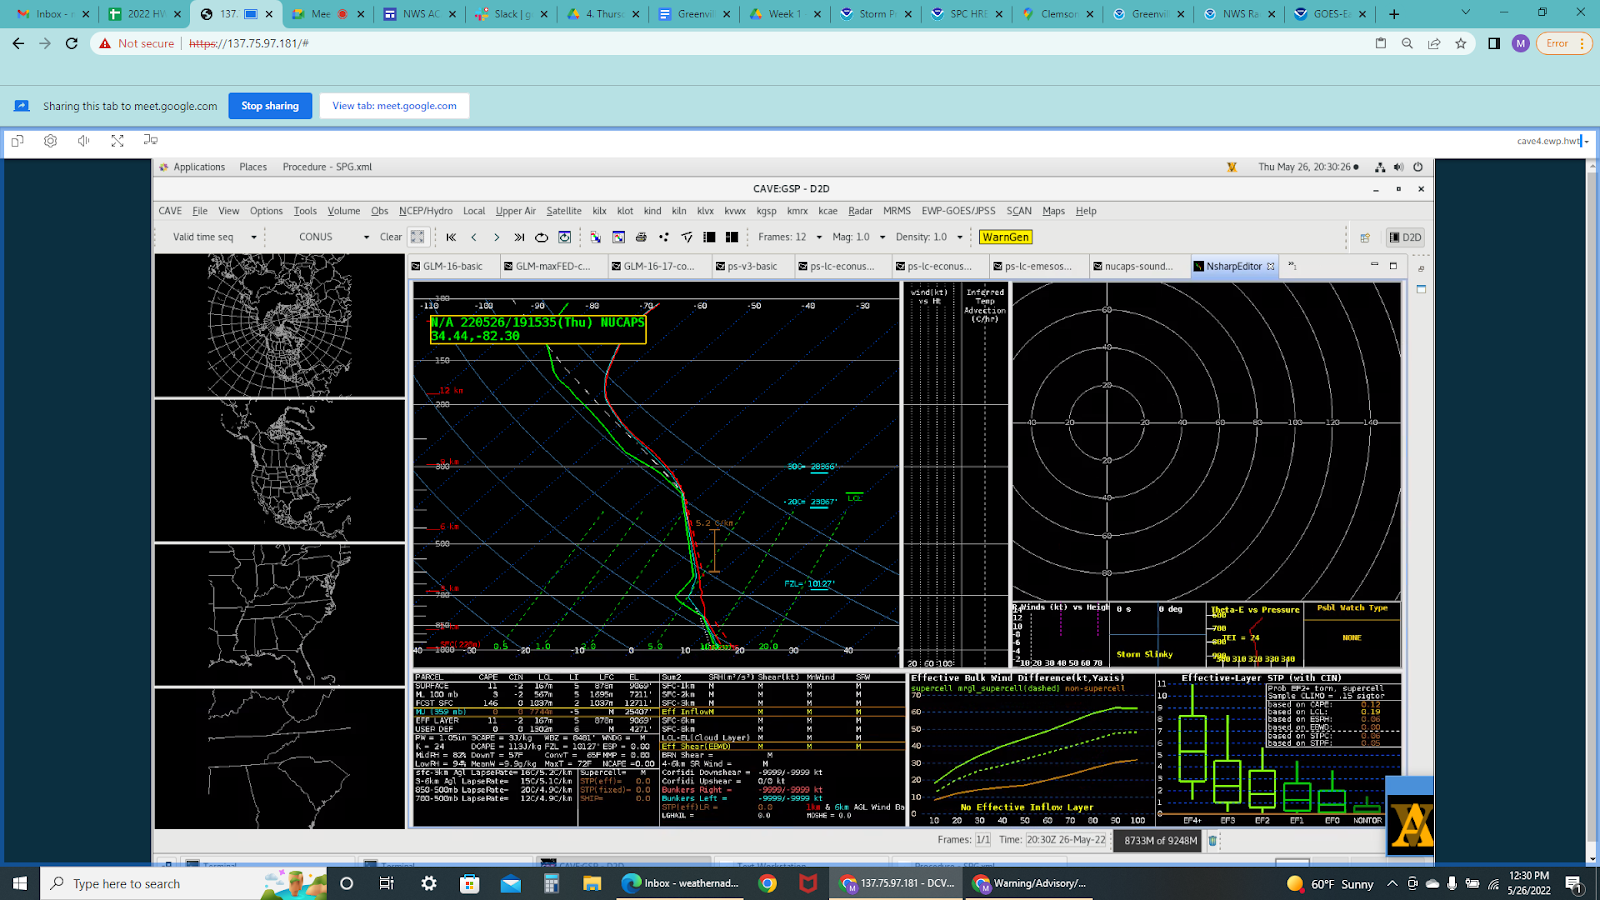
NUCAPS Sounding nearby Greenville.

Another NUCAPS Sounding nearby Greenville.

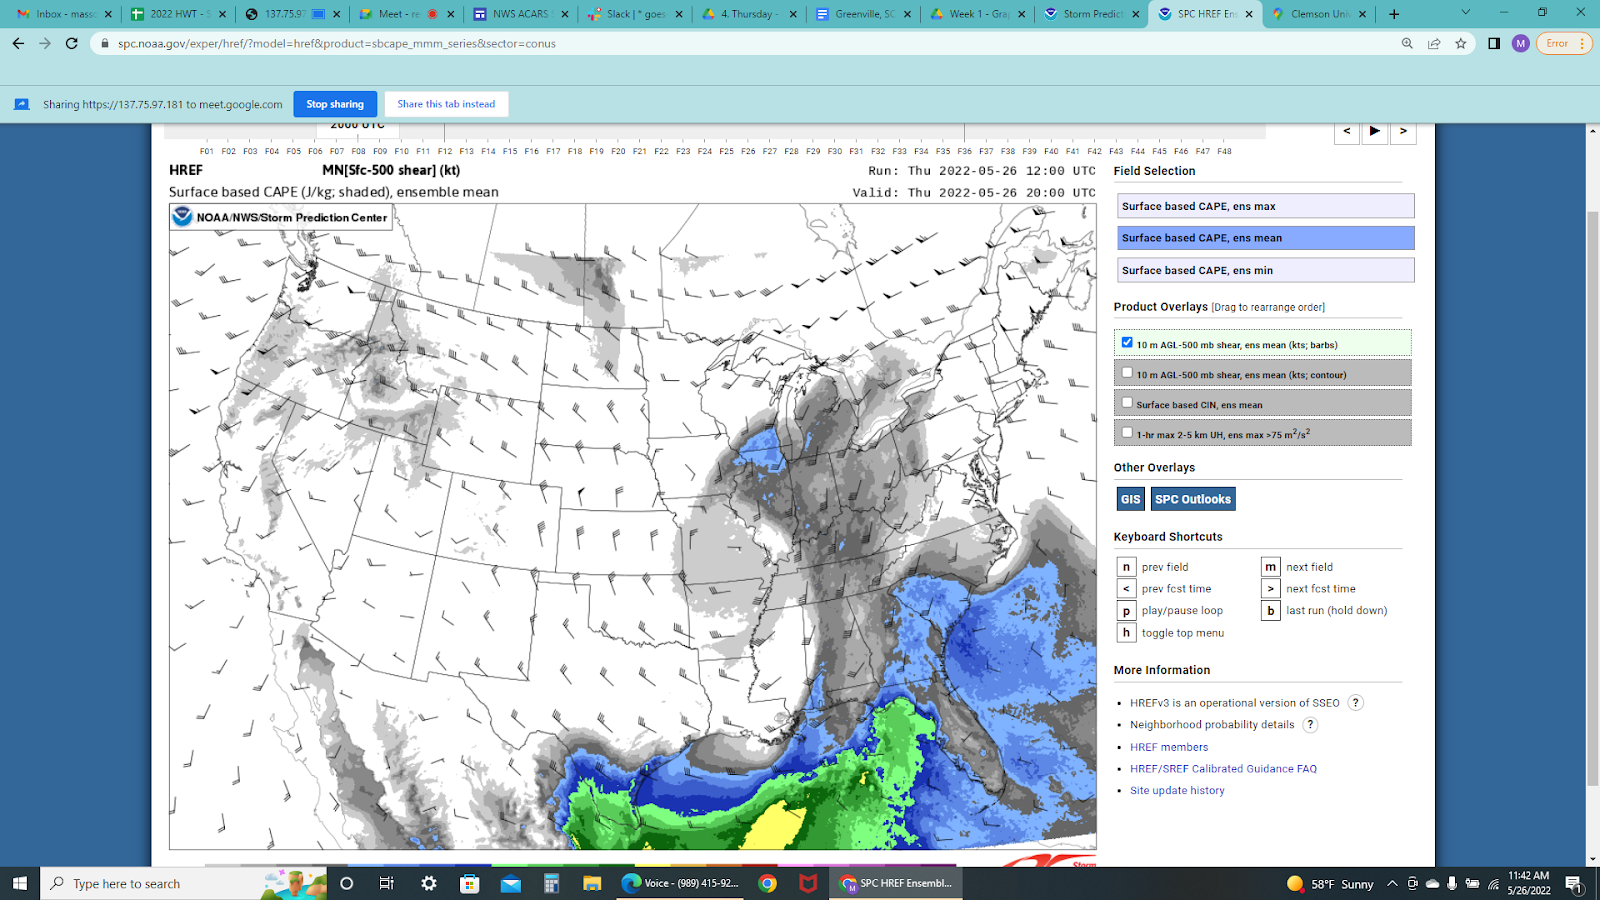
Mesoanalysis - Surface CAPE values ranging from 500 to 1,000 J/kg.

PHS showing similar instability parameters.

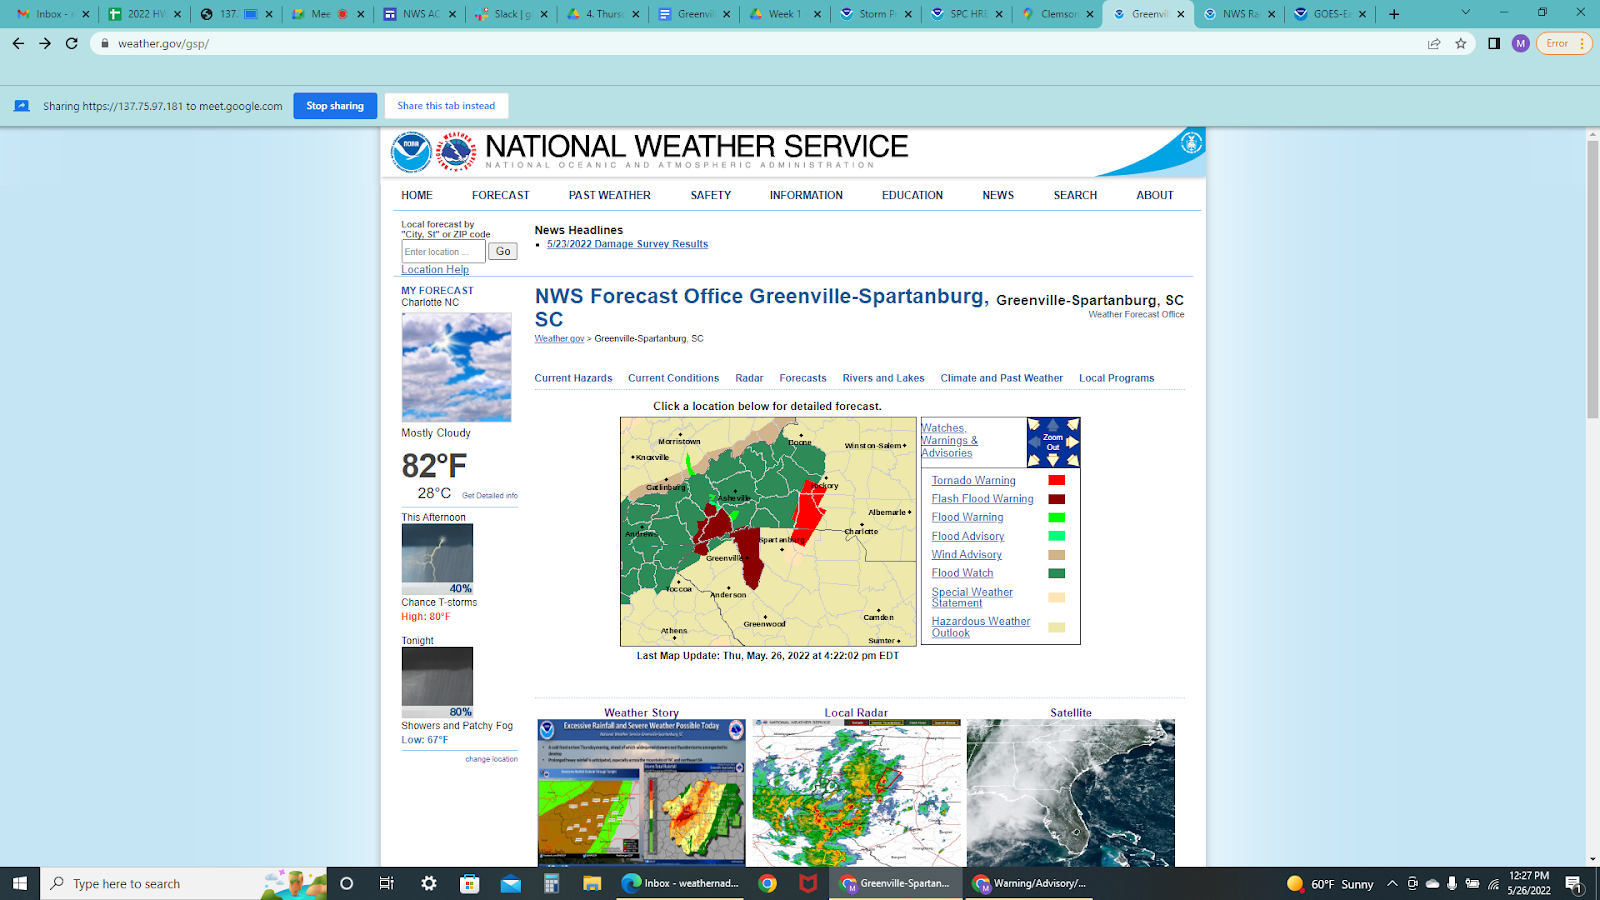
Watches/Warnings products issued throughout the day by WFO Greenville.

ProbSevere3: Low probability of severe weather, but sufficient enough for storm warning operations and convective maintenance situational awareness.

GLM Basic - Helped with operations as well as DSS.

GLM

GLM

Lightning Cast overlaid with satellite was helpful for enough lead time and confidence. 

Lightning Cast overlaid with radar.

Lightning Cast overlaid with satellite.

Radar overlaid with Polygon Warnings issued throughout the day.

DSS update: A Flash Flood Warning was issued for Northwest South Carolina near Anderson county and remained in effect until 9:00 PM EDT.

Latest update on ProbSevere3 and tracking any nearby storms.

Latest update on GLM.

SPC Mesoscale Discussion. Thunderstorms intensified across northeast GA into upstate SC, near and south of a warm front that slowly lifted northward toward western NC.

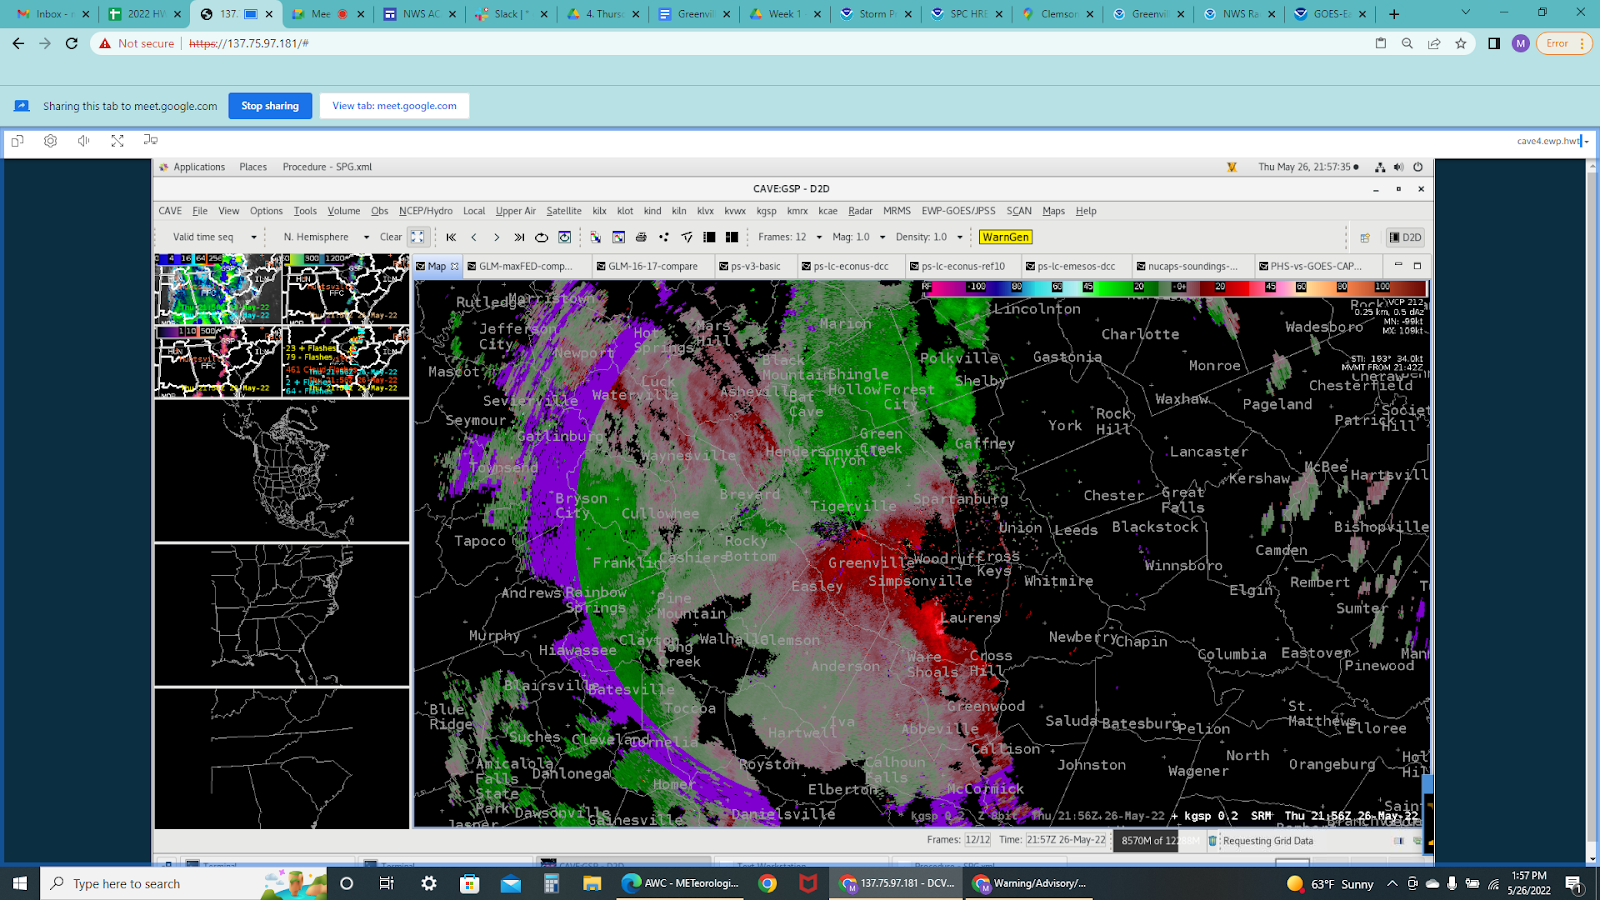
Storm velocity showing gate-to-gate or small rotational couplets near Ware Shoals and Spartanburg.


Vortex Power


Monitoring convection in Louisville, KY CWA

 After an initial batch of rain and embedded storms that are continuing to move across the easernt half of the LMK forecast area, there is a narrow corridor of partial clearing, behind which another band of convection is forming. It is somewhat apparent in the PHS fields (both CAPE and  STP) that there is better destabilization across western portions of the CWA under partial clearing.
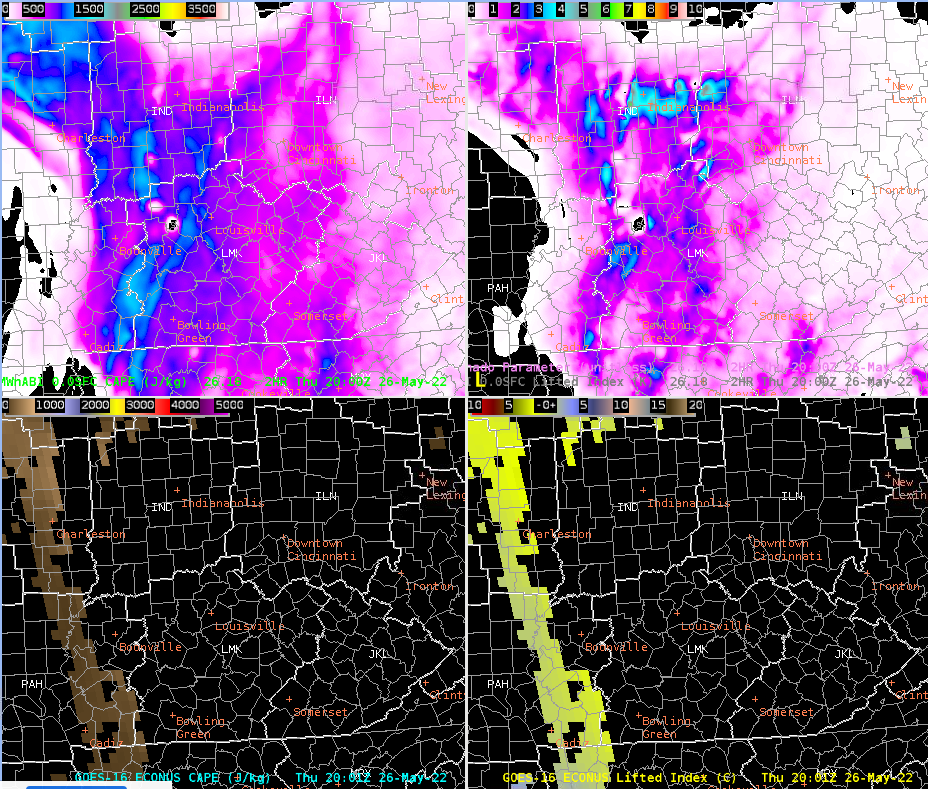
Top left: PHS modeled CAPE at 20z. Top right: PHS moceled STP. Bottom left: GOES CAPE 20Z. Bottom right: GOES LI 20Z.

By 20Z, had issued a significant weather advisory for a cell in the northwestern and portion of the forecast area. ProbSevere began spiking, and GLM FED picked up while MFW decreased, indicating strengthening updrafts. Within the next 20 minutes, cells in the southeastern forecast area began exhibiting similar behavior, and I issued another advisory for those.

0.5 degree base reflectivity at 20Z overlaid with probSevere
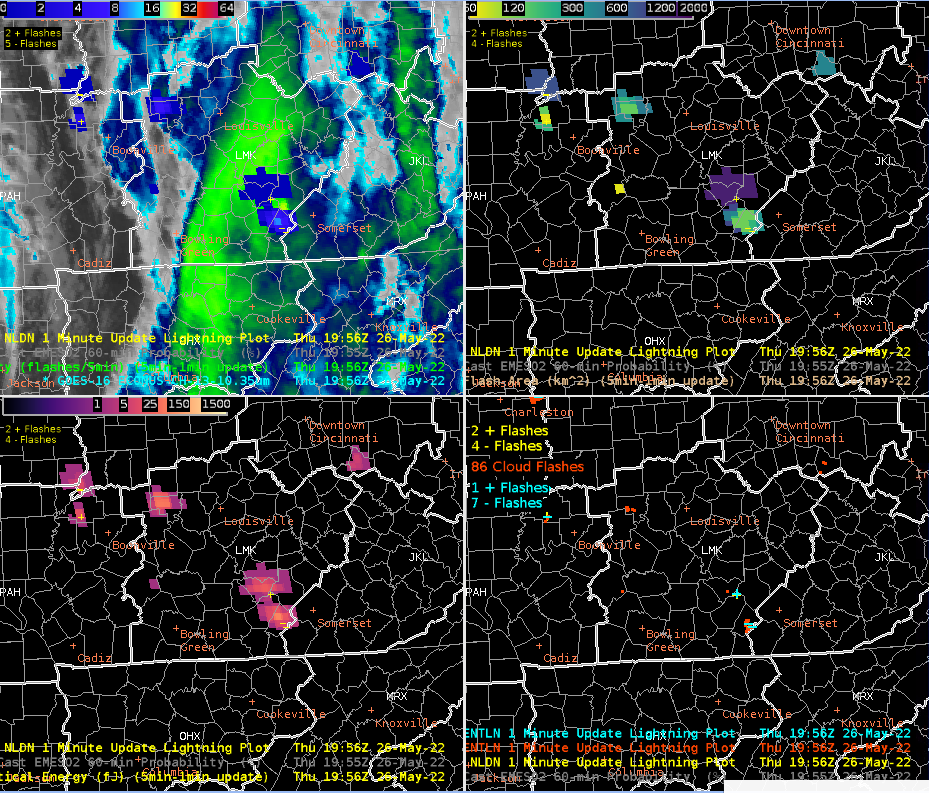
4 panel GLM over IR at 20Z

ProbSevere was indicating more of a wind threat, and a secondary threat from hail with MESH up to a half an inch. Why did I not go severe? Base velocity was decent, up to 30kts on the 0.5deg tilt. Base reflectivity up to 50dbz was only apparent up through around 18kft. NUCAPS soundings from earlier in the day, courtesy of metop C, indicated a freezing level around 11kft, so I would believe small hail.
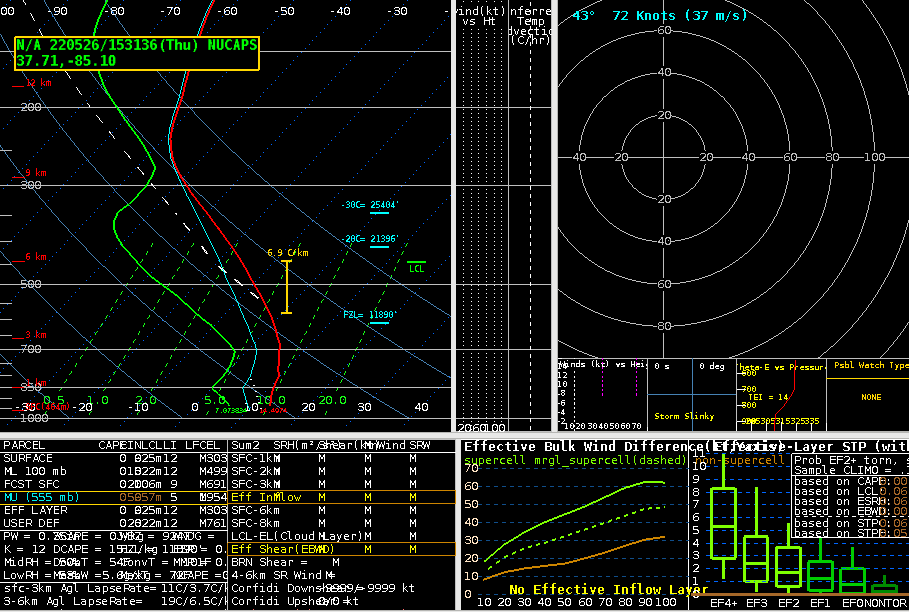
Mid morning NUCAPS sounding over central

By 2130Z, lingering activity is pretty much stratiform with just some embedded storms. Examining Day Cloud Phase Distinction (DCPD), and instability fields courtesy of PHS, we might figure out why. DCPD is indicating thick cloud cover over much of the eastern two thirds of the CWA. Meanwhile, CAPE and STP remain maximized closer to the western CWA boundary, under the area of clearing skies.

21Z DCPD
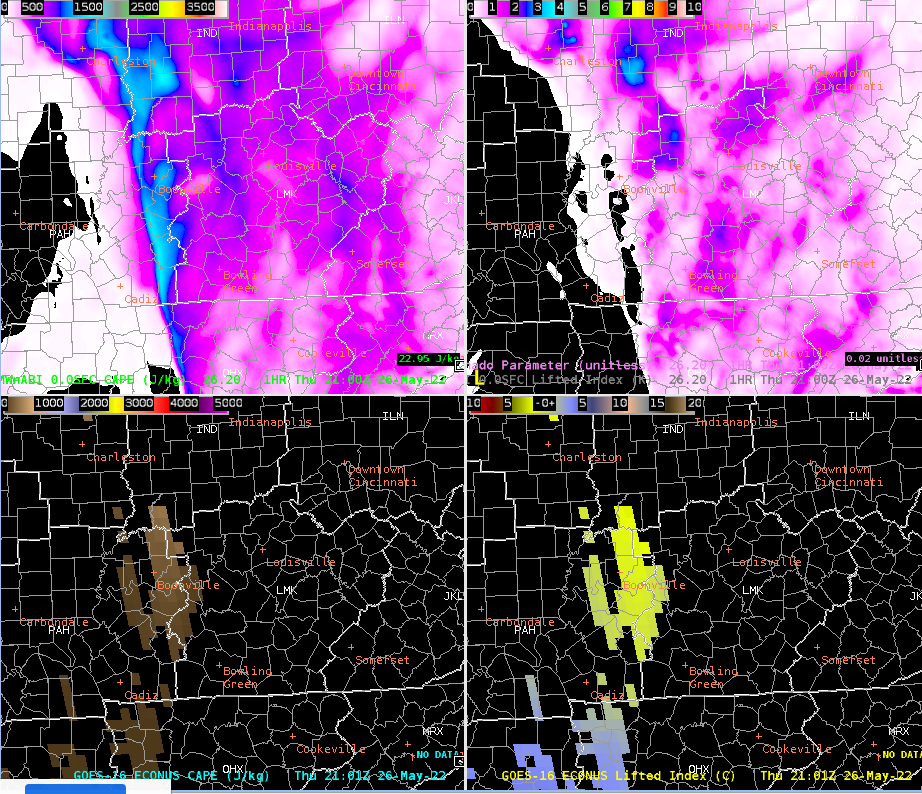
PHS 21Z modeled CAPE, STP (top) and GOES CAPE, LI (bottom)

19Z NUCAPS soundings (from the NOAA20 overpass) were largely unavailable over the CWA due to cloud cover.

A  Modified NUCAPS sounding out of SW KY indicates quite a bit of dry air at the midlevels, but also decent lapse rates and as much as 1500 to 2000j/kg of CAPE

For comparison, the regular, non-modified NUCAP profile at the same location was far less bullish with the instability.

A look at base reflectivity at 2130 indicates that trend towards mainly stratiform rain with embedded storms. In the eastern CWA, ProbSevere is still pretty enthusiastic about an exiting line of convection with probability ranging as high as 20 to 30%  for wind and even up to 20% for tornadoes. An examination of base velocity did indicate some inflow notches ahead of the line.

Base reflectivity with probSevere around 2130Z

However, with GLM FED remaining steady, and MFA on the larger side, the confidence in any real severe weather is waning.

- PoppyTheSmooch