Wednesday, May 22, 2024

LightningCast Imagery Over Vis Satellite

One option that was experimented with for viewing LightningCast data was to use an image overlay on to of visible satellite imagery. Here is an example.


The underlying image is GOES-E meso sector visible imagery (channel 2). The overlaid image is LightningCast East probability of 10 flashes.

To get the image to look like this, the following changes were made to the LightningCast image.

1) In "Edit colors", fill everything up to about 3% with zero. This ensures that there is no overlay to areas where LightningCast probabilities are very low, and the underlying visible imagery shows through cleanly.

2) In "Imaging", change the Alpha value to about 25%-30%, and select "Interpolate Image". I also liked increasing the brightness from 50% to around 60%-65%.

The end result is a display that draws your eyes to the convection with the greatest lightning probabilities, without being as busy as the contours. You could easily overlay extra information over this image, such as GLM, ground-based lightning, or environmental parameters.

--Insolation

Comparing PHS Reflectivity with the HRRR and MRMS Reflectivity


In this animation we track the progression of MRMS composite reflectivity (right) hourly over the previous three hours compared to the PHS (left) and HRRR (center) reflectivity. This morning convection allowing models were slow to initiate convection compared to reality and it seems that trend is continuing this afternoon with the southeastern progression of ongoing convection. The PHS has been slowest today with the southeastern movement, while the HRRR is a bit closer to reality but still behind (especially in the in the northeastern portion of the CWA. 

-Joaq

Two Storms... to Collide?

The storm in Reagan County, depending on the data you look at, looked like they may merge! When looking at OCTANE/Visible satellite, the cell moving out of Reagan actually seemed like it was moving fairly rapidly eastward towards the stronger cell in Tom Green County. But, when viewing radar data, it wasn't moving quite that quickly. Interestingly, GREMLIN has been hinting that these may merge (or is this a smoothing effect?).

OCTANE

KMAF (left) and GREMLIN (right)

Forecaster Cumulus


SCP and SHIP from PHS is struggling in AWIPS

Not sure if something is going wrong with SHiP and SCP today, and it's not a one off. Several cycles of  the PHS are behaving strangely. Although STP and MUCAPE appear to be ingested fine.


The values on the website also appear a bit strange with strange jumping behaviors with lack of gradients. An example of the SCP is shown first, and then SHiP second.


Here are the values on the RAP Mesoanalysis.

So not entirely sure what has gotten into the PHS model.

Kadic.

Using GREMLIN for Time of Arrival

LightningCast has been running high near the PGA Tournament today near Fort Worth as a result of several thunderstorms around the region, but not over the region. As a result, decided to swap over towards trying to use GREMLIN to find the time of arrival of the boundary noted earlier.

So an attempt was made to highlight this in the DSS image to provide an estimate of when these hazards would arrive. Perhaps another proofread would've caught the initial typo from copying it over. However, a value of about 40 percent was noted. Partners still had information that storms would become increasingly likely over a narrower time frame in addition to the probabilistic information from LightningCast. 


But nature had other plans with a strike and a few pulses of lightning over the event at the time this was "sent out". An area of weak convection was in the area, and so I would've thought that this would not produce lightning.


Sneaking in information on the RGB evaluation, you can see how this was not a young storm and likely something in decay, and that may track with a bit of the surprise element.


Kadic


Developing and Splitting Cells in Sterling County TX

This lengthy post will cover a number of interesting observations with developing and splitting cells near Sterling County TX. This post will mainly focus on GREMLIN, but also a few other products.

Initially, we were focused on new updraft development Glasscock County TX. GOES-E GREMLIN (left panel) depicted Z values of about 57dBZ. KMAF comp reflectivity (right panel) was also picking up some 50+ dBZ. The 0.5 slice on KMAF (middle panel) was yet to really show anything of interest. This is evidence that GREMLIN is picking up on situations where echoes aloft have not yet started reaching near the ground. This has a degree of predictive value.


The loop from here shows that this storm then proceeds to split as it moves into Sterling County TX. The storm split is apparent on the KMAF lowest slice and comp reflectivity, as early as 2020Z. On GOES-E GREMLIN, the split does not start to show up until 2040Z, and is not readily apparent and clear until 2100Z.


So, let's look a little closer into why GOES-E GREMLIN may have struggled with picking up the split. The loop below compares GOES-W satellite imagery (left panel) with GOES-E satellite imagery (right panel). While GOES-E data masks the updraft of the left-mover under the anvil from the right-mover, GOES-W has a better view of the left-mover updraft.


Comparing GOES-W GREMLIN and GOES-E GREMLIN, it's clear that GOES-W had the better view of the left-mover updraft, and picked up on the split much more accurately (though it was low on dBZ values). On the contrary, GOES-W GREMLIN did a much less consistent job in handling the right-mover.


--Insolation

From a GLM perspective, it's clear that GOES-West GLM sensor had a better view of the left split updraft and lightning activity than GOES-East. The flash extent density product shown below detected an increase in activity much quicker on GOES-West than its east counterpart. This may be due to the less inhibited view GOES-West had of the updraft looking at it from an angle compared to a more top-down view GOES-East had, which may have been blocked by water droplets or hail near the top of the thunderstorm. 

-Joaq


Comparing GREMLIN Across Two Storms


The GREMLIN radar product is shown above in the top left while MRMS composite reflectivity is on the top right. The two storms in question have severe warnings on them in this loop. The thunderstorm in the southwest is more isolated from other convective cloud debris, while also displaying a more intense thermal couplet and cloud top divergence signal than the thunderstorm to the northeast. It seems likely that this is the reason why the northeast storm has a lower ceiling for GREMLIN reflectivity than the southwest storm, even though the MRMS composite includes a 60 dBZ core in the northeast storm. 

-Joaq

Splitting Cells - OCTANE and GREMLIN

It was interesting to see the cell in Glasscock County, TX moving into Sterling CO via KMAF. OCTANE shows the divide really well and the stronger right mover. However, GREMLIN hadn't picked up on the split yet.


Forecaster Cumulus

Speed of Incoming Surface Boundary

One of the things that we noticed was that it appears that model guidance is too slow dropping a weak surface boundary to the south. As a result the convection in model guidance is likely being developed too far to the north of what is likely to actually occur.

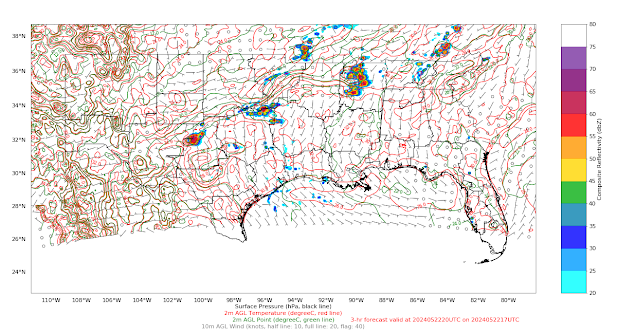
Below is the surface winds from the PHS model forecast from the 17z run for 20z. It has a boundary that is near or north of the Texas-Oklahoma border.


In reality, the boundary has been a bit further south. However, this has been the theme of the day, with convection generally advancing east faster than most high-resolution model guidance. Below are the surface observations across Texas showing how much further south the boundary is, in addition to the fact that the wind field is stronger than what PHS is indicating.


The image below has the forecast model composite reflectivity (top right) nearly a degree longitude to the west of MRMS radar reflectivity (bottom right).


This raises additional concerns, as out ahead of the convection, the PHS forecasts an increase in SRH. If this is unchanged considering the current placement of convection, it may indicate a greater probability of storms rotating. The fact that we're also seeing a sharper boundary present in the wind field suggests we could also see stronger convergence along the band of developing convection than may be indicated within the PHS forecast.

Kadic

PHS Environmental Paraemeters vs RAP and Radar for Warning Ops

For this case, we have a data outage for radar, so the closest radar we have to use is KMAF for WFO SJT (no MRMS data either). Was looking at the tornado probability for the storm moving out of Runnels County since the midlevel meso was strengthening. So, I took a look at the environmental parameters from PHS (namely, the SRH). It looked like the storm was ingesting 800-900 m2/s2 SRH, which is a bit high, but the idea that the storm was ingesting more SRH/modifying the environment to possibly increase the tornado potential was useful. Interestingly, the RAP from the SPC Mesoanalysis page shows an area of enhanced 0-3 km SRH (just to the NW of the storm).

PHS environment parameters at 1947Z

SPC Mesoanalysis 0-3 km SRH


KMAF 0.9 deg tilt indicating a very strong midlevel meso

Another thought - Perhaps having either 30 minute data or intervals (30 minute, 1 hour, 2 hour, etc.) might help from a mesoanalysis standpoint.

Forecaster Cumulus