Wednesday, May 1, 2024

Cold front on the Plains

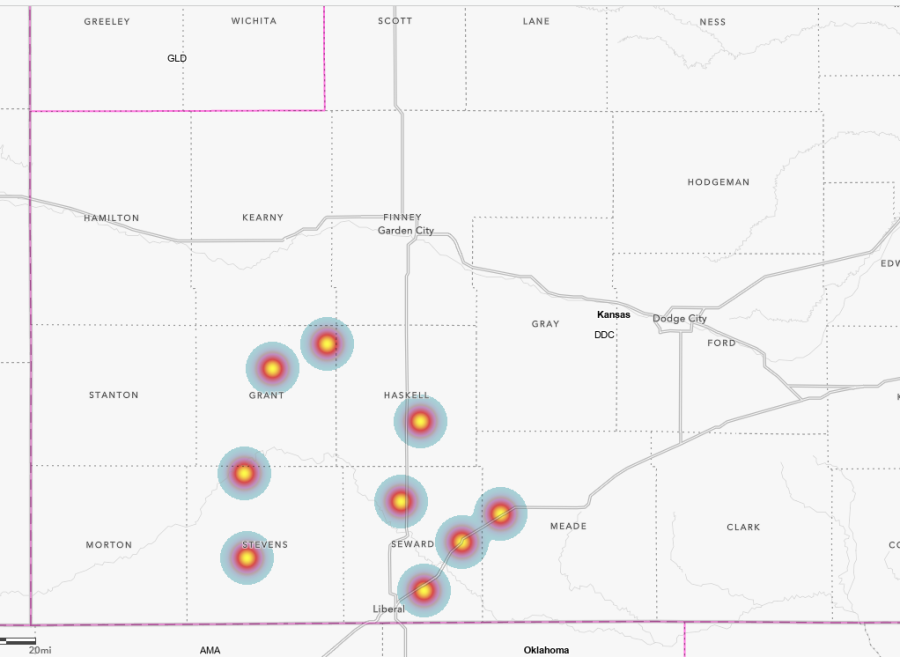
A potent cold front swept through the Great Plains in late April, spawning severe storms, including supercells, producing large hail, severe wind gusts, and tornadoes. 

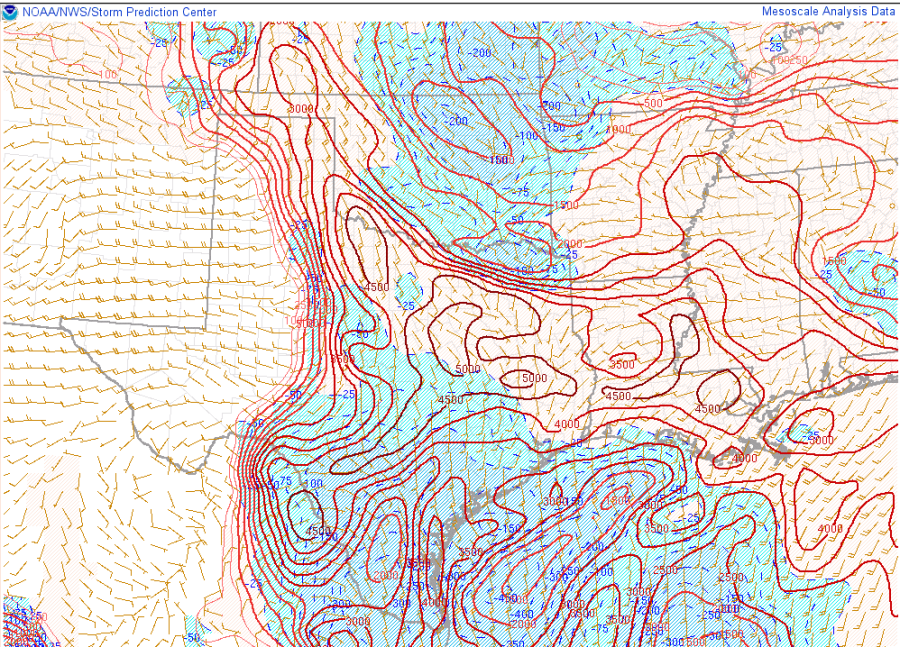
Figure 1: Storm Prediction Center local storm reports from 12Z on 30 April to 12Z on 1 May 2024.


ProbSevere LightningCast was able to pick out developing convection along and ahead of the cold front, shown by regions of enhanced probabilities---first in eastern Nebraska, and then later in Kansas and Oklahoma. Toggle back and forth in time in the animation below to investigate model lead time to the first GLM flashes in different cells.


LightningCast is being evaluated at the HWT this spring, with some new features including:

  • better probability calibration (as a result of more training data)
  • static and on-demand lightning dashboards
  • GOES-West version trained on only GOES-18 data
  • an additional output product, the probability of ≥ 10 flashes in the next 60 minutes
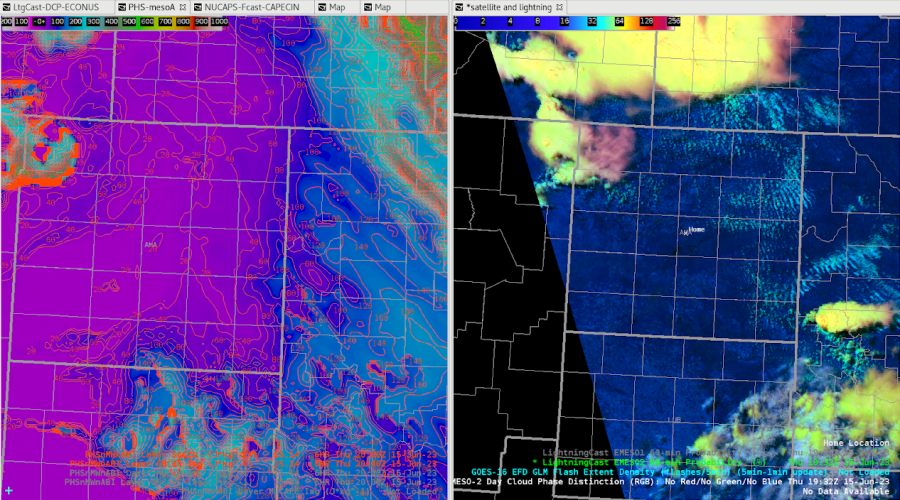
The lightning dashboards are available from the LightningCast webpage for static locations such as airports and football stadiums, as well as dynamically changing locations like active wild-land fires.


The panel above shows some time series of LightningCast probabilities for the 5-min CONUS sector (red) and 1-min mesoscale sector (yellow) for Wichita Mid-Continent Airport, as storms developed and traveled over the airport. Blue dots are GLM centroid observations within 5 miles (large dots) and 10 miles (small dots) of the airport. 

A new feature being evaluated this year at HWT is the on-demand dashboard capability, whereby a NOAA user can submit location and timing information for an event that they want a dashboard for. They simply fill out this form and receive an automated email with the valid link: https://go.wisc.edu/x16m56. In this way, forecasters can get custom guidance for locations they are serving with decision support. This capability has already been used for events such as NFL games and state fairs.

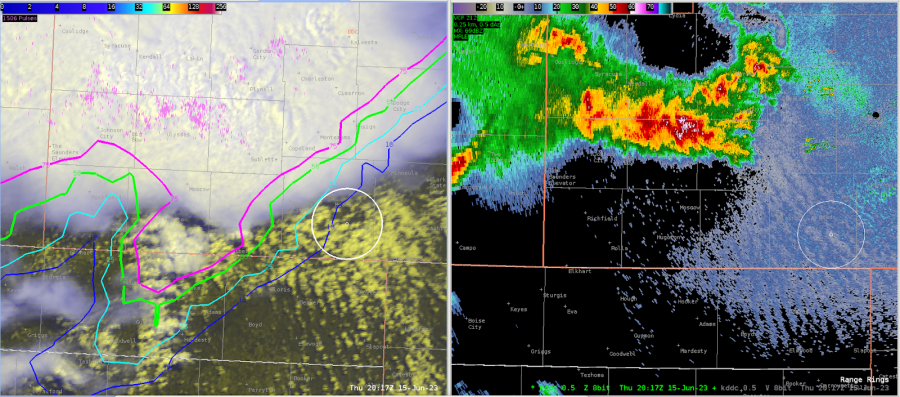
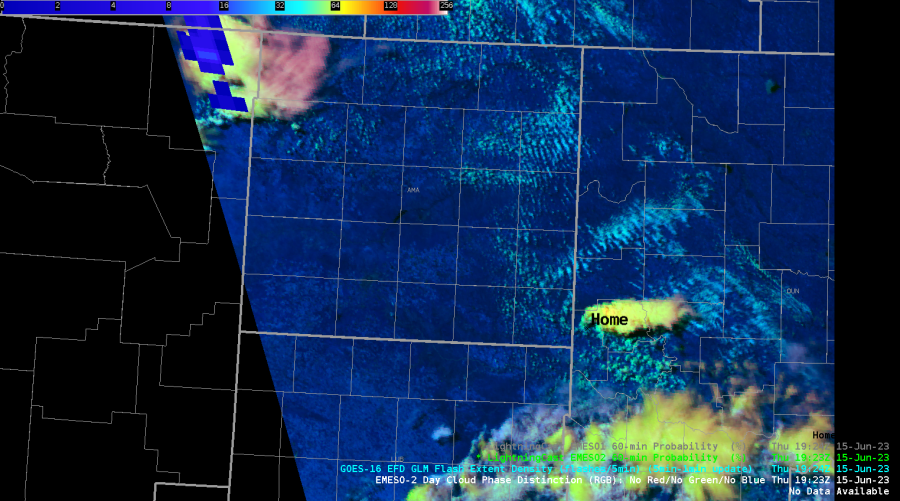
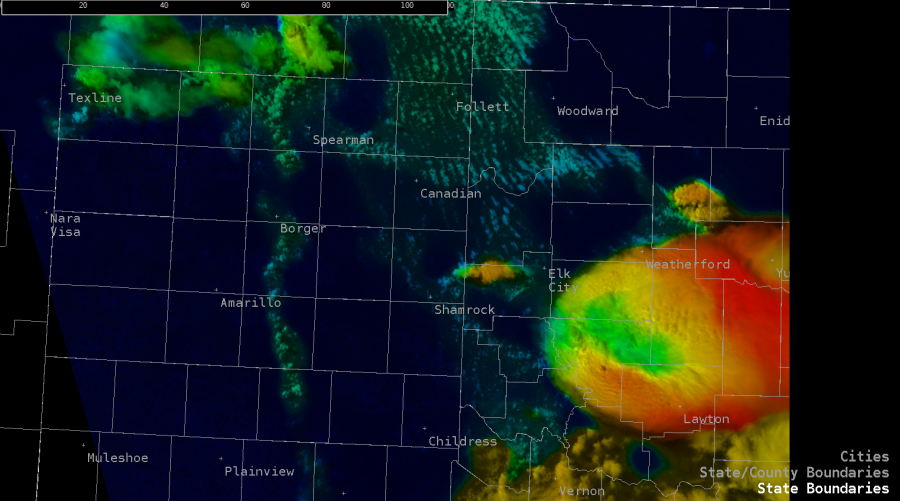
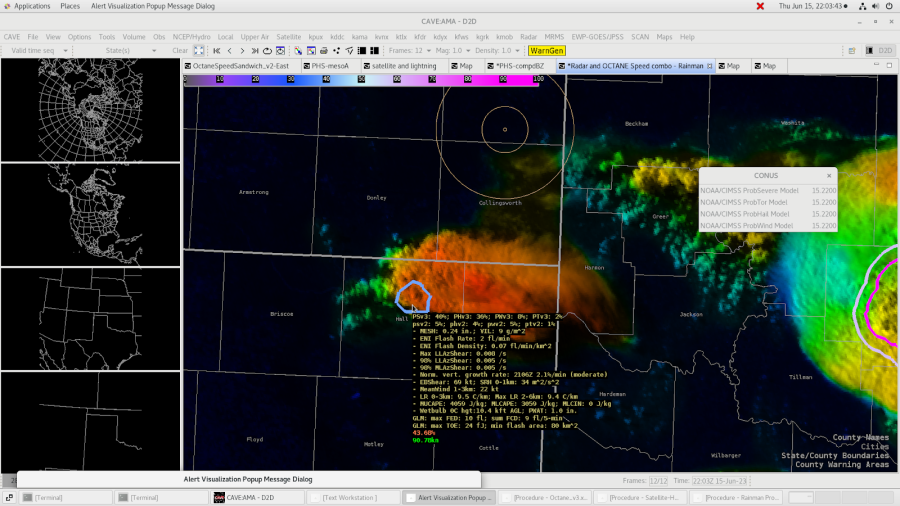
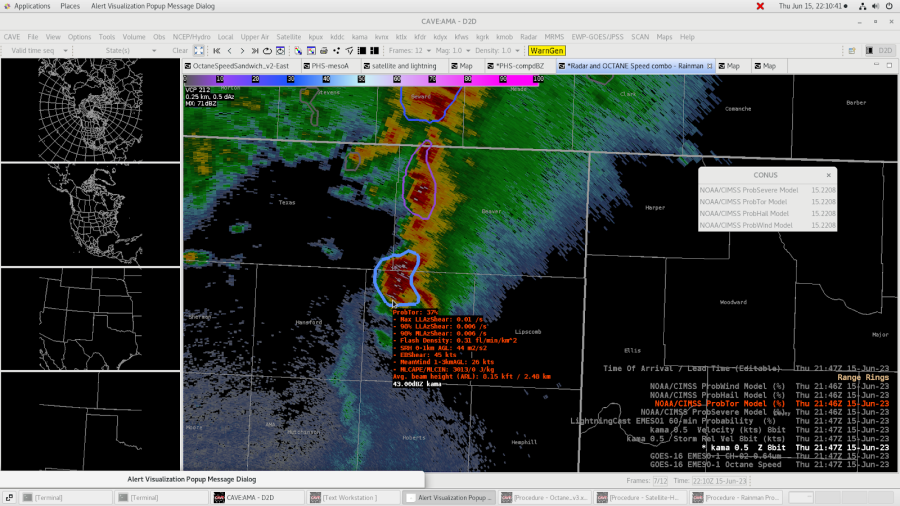
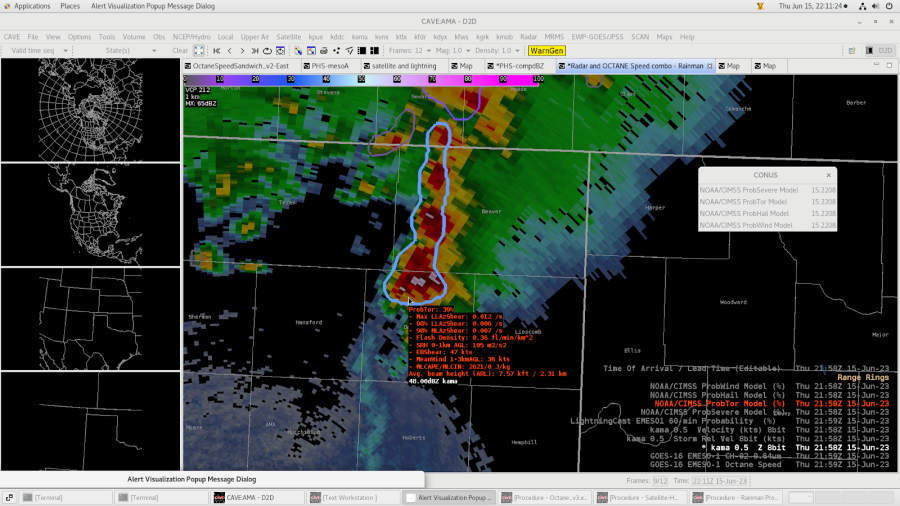
Below is output from ProbSevere IntenseStormNet, which is a deep-learning model like LightningCast, but uses images of GOES-R ABI and GLM data to predict the probability of "intense" convection, from a satellite perspective. It is useful as storms are maturing. 


From the animation above, one can see how strong overshooting tops, bubbly-like texture in the cloud tops, and above-anvil cirrus plumes correspond well with stronger probabilities, which correlate well with local storm reports. IntenseStormNet works well for deep convection, day and night. Output from this model is used in ProbSevere v3, but can also be useful stand-alone severe-weather guidance in regions without radar coverage. 

Wednesday, February 28, 2024

Midwest storms...in February!

 Record-breaking high temperatures for February preceded and helped spawn storms in eastern Iowa and northern Illinois yesterday.

ProbSevere LightningCast gave a heads up on the developing convection. LightningCast uses deep-learning methods and GOES ABI data to predict the probability of lightning up to an hour in advance. LightningCast version 1 (LCv1) is being transitioned to NOAA operations in 2024. 

Development and improvement of LightningCast continues, however, based on forecaster feedback. One new product that is being evaluated at the Hazardous Weather Testbed this year is the probability of ≥ 10 fl in 60 min. Forecasters remarked that in some situations, having guidance on a more robust level of lightning would be very helpful. 

In the animation below, the P(≥ 1fl in 60 min) are depicted by contours in shades of blue (at 10%, 25%, and 50% levels). The P(≥ 10 fl in 60 min) are in red-shaded contours (10% and 25% levels).

For the three storms in Illinois, there was 13 min, 6 min, and 13 min of lead time to ≥10 flashes (when measured from the 10% contour). The storms in Iowa never got to 10 flashes, but the LightningCast probabilities only touched 25%. Users should recognize that lead time for the 10-flash product will be lower than the 1-flash product. When probabilities above 10% begin to appear (and especially above 25%), forecasters should anticipate an intensification in the lightning activity. 

Figure 1: LightningCast contours (P[≥ 1 fl] in blues, P[≥ 10 fl] in reds), GOES-16 ABI imagery, and GOES-16 GLM flash-extent density for storms in eastern Iowa and northern Illinois.


These storms developed rapidly into supercells and produced hail, severe wind gusts, and several tornadoes. ProbSevere v3 corresponded with NWS warnings quite well, even in this explosive environment. Notably, ProbTor v3 was much higher (30-45%) than ProbTor v2. While more investigation is needed to confirm this, it is likely that the HRRR model inputs in v3 were more impactful than the RAP model inputs in v2, signifying that the HRRR better depicted the environment. 


Tuesday, September 26, 2023

ProbSevere v3 for a couple of early autumn storms

ProbSevere v3 (PSv3) was able to provide an earlier heads-up and increased lead time to the initial severe hazards in several recent autumn storms on the Southern Great Plains. 

On September 23, there were a number of powerful supercells ravaging east-central Oklahoma. The storm in Figure 1 quickly split into two cells, with the right split producing 2"-diameter hail at 23:55 UTC and 3" hail at 00:15 UTC.

Figure 1: ProbSevere v3, MRMS MergedReflectivity, and NWS severe weather warnings for storms in central Oklahoma.


Figure 2: ProbSevere v3 for a storm in Pottawatomie county at 22:56 UTC.

As this supercell was developing (see Figure 2), PSv3 was 37%, whereas PSv2 was only 3%. Hail appeared to be the main threat. At this time, the very weak lightning signal (only 5 fl/min) and low MESH (0.33") were keeping the PSv2 probability very low. However, the top 5 contributing predictors in PSv3 were:

  • Lapse rate 0-3 km (8.4 C/km)
  • MLCAPE (3685 J/kg)
  • Eff. bulk shear (46 kt)
  • Sat growth rate (2.7%/min -- "moderate")
  • MRMS MESH (0.33")
ProbSevere v3, compared to v2, is more adept at extracting salient signals in the combined NWP, satellite, radar, and lightning phase space. In the developing stage of this storm, the environment and the satellite were more important than the radar predictors.  

The next evening, it was Texas's turn. One lone supercell in west Texas produced golfball-sized hail and wind reports of 59 and 62 mph (Figure 3).

Figure 3: ProbSevere v3, MRMS MergedReflectivity, and NWS severe weather warnings for a lone supercell in west Texas.


Figure 4: The storm in Figure 3, at 01:44 UTC.

ProbSevere v3 again had a jump on this storm before PSv2. At 01:44 UTC, right after the initial severe wind report, PSv3 was 55% vs. v2's 9% (Figure 4). PSv3 was showing both hail and wind as potential threats. The very weak low-level mean wind (5 kt) was keeping ProbWind v2 low (5%), and the modest flash rate and MESH, and very low hail CAPE (~250 J/kg) were combining for a ProbHail v2 of only 9%.

In contrast, the top contributors in ProbSevere v3 were the modest flash rate (18 fl/min), modest MESH (0.72"), the effective shear (47 kt), and the low-level lapse rate (8.1 C/km). PSv3 was able to integrate the marginal radar signature with favorable NWP data (from HRRR) to provide a better indication of severe probability.

Figure 5 highlights the higher probability of severe in PSv3 well before PSv2 shoots up, which was after the initial wind report. This storm later produced severe hail and another wind report.

Figure 5: Time series comparing PSv3 and PSv2 probabilities during the developing stage of the supcercell in Figures 3 and 4.


Thursday, June 15, 2023

Using Satellite to Aid in Defining Areas of Concern for Graphical Messaging

 June 15, 2023 - Role playing as DDC, a colleague and myself were tasked with creating a public graphic for a near term forecast regarding the location and timing of the potential for severe thunderstorms and associated hazards.

There was ongoing severe convection within the western half of the CWA by the start of our shift. After going through a quick forecast process and mesoanalysis, it was determined that a prime environment for either additional or sustained severe convection was spreading into the southern and eastern portions of the CWA.

Shortly thereafter, satellite gave indications of convective initiation in the vicinity of a triple point of a surface low. Satellite imagery and products that gave indication of building, infant convection included Day Cloud Type RGB and LightningCast via GOES-West Mesosector 1.

Figure 1.

Day Cloud Type RGB was used to track the vertically growing Cu, while using the Time of Arrival Tool and knowledge of the environment to estimate the spatiotemporal extent ( orange dashed outline) of where severe convection would occur within the next two to three hours, as displayed in Figure 1. Additionally, LightningCast was used to build confidence in where convection was growing and tracking, aiding in defining this area of concern.

Figure 2.

When comparing this to radar reflectivity (Figure 2.), radar was devoid of robust convection in the growing area of concern. Thus satellite proved useful in providing further lead time in defining the area of concern as well as when to start graphic creation. While we opted to not show satellite imagery for public consumption (satellite imagery can be distracting and/or misinterpreted when messaging severe hazards and impacts), it was crucial in the development stage of graphic creation, particularly defining areas of growing concern.

Here was the graphic we created:


How did it pan out? Pretty well, actually:

Figure 3 shows an animation of MRMS Composite Reflectivity and ProbSevere through the window of forecast hazards to help illustrate how severe convection developed between 20:00 UTC through 22:15 UTC within DDC during the period of concern.

Additionally, here are the SPC reports between 20:00 UTC to 22:15 UTC within DDC during the period of concern, including a measured 88 mph wind gust at 21:30 UTC within Seward County:

- 0SMBLSN

June 15, 2023 - Role playing as DDC, I was tasked with providing DSS for a (fictitious) grass fire near Meade, KS. DSS: Grass fire near Meade, KS For this DSS, requested information included lightning within 10 miles of the site, any significant changes in wind speed and direction, as well as other hazardous weather that would pose a risk to emergency personnel containing the fire. Figure 1. There was ongoing severe convection within the western half of the CWA by the start of my shift, and there was a high likelihood of this convection approaching the DSS site. As shown in Figure 1,  my datasets/tools of choice for tracking severe convection and lightning were as follows: GOES-East Mesosector LightningCast, MRMS Composite Reflectivity, ENTLN intracloud and cloud to ground lightning, surface observations, Time of Arrival Tool, Distance Bearing Tool, and Range Rings Tool. Ground based lightning observations and LightningCast complimented each other nicely when assessing the potential for lightning at the site. Additionally, LightningCast picked up on additional agitated Cu well ahead of the main line of thunderstorms closer to the DSS Site. Using the Time of Arrival tool to track the main cluster of cloud to ground lightning associated with the severe convection was also very useful in providing information on potential to see most lightning via advection, in the absence of additional convective initiation and/or a rapid change in forward speed in ongoing convection. Figure 2. Some consideration was made to not “overwarn” on lightning potential as the main breadth of lightning would likely come from the severe convection still well off to the west. So with this particular scenario, I set an internal threshold of 80% within LightningCast to send a DSS message. The data readout of the parallax corrected LightningCast offered within AWIPS (not shown) was favored over the non-parallax corrected time series (Figure 2), giving higher confidence in the true probability of occurrence used within the DSS message. This gave around a 35 minute lead time before the first strike was detected within 10 miles of the DSS site. Had we used the non-parallax corrected readout values, lead time would have been much shorter, around 10 minutes using 1-minute imagery and less than 10 minutes using 5-minute imagery. This clearly demonstrates the value of using parallax corrected data compared to non-parallax corrected data when performing DSS. Here was the DSS message sent at around 21:10 UTC: Severe thunderstorms have developed around 50 miles to your west, and will likely move over your site between 5:15 pm to 6:30 pm CDT. There is a high chance for storms to remain severe by the time they reach your site, bringing very strong winds over 70 mph out of a direction ranging between northerly to westerly, large hail, heavy rainfall, frequent lightning. We still cannot rule out the potential for a brief tornado, although the chance for a tornado is much lower than previous hazards mentioned. Because of the approaching thunderstorms, the chance for lightning to occur within 10 miles of your site within the next hour (5:15 pm CDT) is over 80%. - 0SMBLSN

 While providing (fictitious) DSS for a grass fire near Meade, KS on June 15, 2023, LightningCast was utilized in notifying the onset of lightning within 10 miles of the DSS site as a line of severe thunderstorms approached. Additionally, consideration was given to the potential for lightning cessation over the site in an effort to give information on potential for the “all clear.”

Figure 1.

LightningCast within the trailing anvil portion of the squall line steadily dropped off within the trailing stratiform region. However, these probabilities decreased when cloud to ground lightning was still being observed, with even some strikes occurring in probabilities less than 10%. This can be seen in Figure 1 in the far left hand portion of the animation with CG icons occurring within and outside of the lower contours of LightningCast.

This significantly lowered confidence in tracking the lower probability contours to give an estimated time of cessation.

Here was the DSS message sent at around 21:45 UTC:

As of 4:45 pm CDT, severe thunderstorms are 20 miles west of your site, and continue to approach your site. There is a very high chance these storms remain severe by the time they reach your site, currently expected between 5:15 pm and 5:45 pm CDT, bringing very strong winds over 70 mph out of a direction ranging between northerly to westerly, heavy rainfall, and frequent lightning. We still cannot rule out the potential for a brief tornado and large hail, although the chance for a tornado and hail is much lower than previous hazards mentioned.

Because of the approaching thunderstorms, the chance for lightning to occur within 10 miles of your site within the next hour (5:45 pm CDT) is over 99%.

It is worth noting that even after severe hazards associated with this line of thunderstorms have ended, there will remain over 75% chance of lightning over your site for an additional 1-2 hours, along with the potential for continued gusty winds over 20 mph ranging out of the southeast to northeast.

- 0SMBLSN

Utility of Parallax Corrected LightningCast Versus Non-Corrected within DDC

 June 15, 2023 - Role playing as DDC, I was tasked with providing DSS for a (fictitious) grass fire near Meade, KS.

DSS: Grass fire near Meade, KS

For this DSS, requested information included lightning within 10 miles of the site, any significant changes in wind speed and direction, as well as other hazardous weather that would pose a risk to emergency personnel containing the fire.

Figure 1.

There was ongoing severe convection within the western half of the CWA by the start of my shift, and there was a high likelihood of this convection approaching the DSS site. As shown in Figure 1,  my datasets/tools of choice for tracking severe convection and lightning were as follows: GOES-East Mesosector LightningCast, MRMS Composite Reflectivity, ENTLN intracloud and cloud to ground lightning, surface observations, Time of Arrival Tool, Distance Bearing Tool, and Range Rings Tool.

Ground based lightning observations and LightningCast complimented each other nicely when assessing the potential for lightning at the site. Additionally, LightningCast picked up on additional agitated Cu well ahead of the main line of thunderstorms closer to the DSS Site. Using the Time of Arrival tool to track the main cluster of cloud to ground lightning associated with the severe convection was also very useful in providing information on potential to see most lightning via advection, in the absence of additional convective initiation and/or a rapid change in forward speed in ongoing convection.

Figure 2.

Some consideration was made to not “overwarn” on lightning potential as the main breadth of lightning would likely come from the severe convection still well off to the west. So with this particular scenario, I set an internal threshold of 80% within LightningCast to send a DSS message. The data readout of the parallax corrected LightningCast offered within AWIPS (not shown) was favored over the non-parallax corrected time series (Figure 2), giving higher confidence in the true probability of occurrence used within the DSS message. This gave around a 35 minute lead time before the first strike was detected within 10 miles of the DSS site. Had we used the non-parallax corrected readout values, lead time would have been much shorter, around 10 minutes using 1-minute imagery and less than 10 minutes using 5-minute imagery. This clearly demonstrates the value of using parallax corrected data compared to non-parallax corrected data when performing DSS.

Here was the DSS message sent at around 21:10 UTC:

Severe thunderstorms have developed around 50 miles to your west, and will likely move over your site between 5:15 pm to 6:30 pm CDT. There is a high chance for storms to remain severe by the time they reach your site, bringing very strong winds over 70 mph out of a direction ranging between northerly to westerly, large hail, heavy rainfall, frequent lightning. We still cannot rule out the potential for a brief tornado, although the chance for a tornado is much lower than previous hazards mentioned. Because of the approaching thunderstorms, the chance for lightning to occur within 10 miles of your site within the next hour (5:15 pm CDT) is over 80%.

- 0SMBLSN

Day 4 Review of Products & Operational Applications

 Today, I took on the role of mesoanalyst during operations. I first looked at PHS fields (mainly MUCAPE and bulk shear) and compared them to the SPC mesoanalysis of said fields. The two agreed well, though I do have a suggestion – PHS bulk shear fields are given in m/s, but knots or mph would be better for quick comparison to SPC mesoanalysis and most model output.

I then looked at OCTANE imagery and immediately took note of the divergence signature associated with an especially robust storm over western DDC (Figure 1). This signature was easy to identify as the environmental winds aloft were relatively light.

Figure 1

As the operational period wore on, LightningCast indicated a high likelihood of convection over the southwest portion of DDC well before any radar returns actually appeared (Figure 2). My group used this information to create a DSS graphic that highlighted this area for likely storm development later (which did in fact end up happening).

Figure 2

OCTANE Direction later captured what at first glance appeared to be a couple divergence signatures over southwestern DDC (Figure 3). Upon closer inspection, however, these signatures were co-located with relative minima in OCTANE Speed. The proximity of these signatures to areas of missing pixels (where winds are likely <5 kts) in OCTANE Direction suggests very light winds and/or lower quality data, per the developer.

Figure 3

- Vort Max

6/15 Feedback for AMA

 PHS

The surface based CINH at 20z lined up rather well with the satellite imagery showing the slightly more stable clouds over the eastern CWA.

When sampling an image versus contours, the contour sampling has the entire product name in the readout

PHS captured the initial convection just east of AMA well, even though the convection started an hour earlier than PHS indicated.  Image on right is PHS SB CAPE and contours are PHS SB CINH.  Home is roughly where the storm is located.  Satellite image is around 1930z and PHS forecast is 21z when CINH dropped from 80j/kg to 40 j/kg.

PHS did a reasonable job predicting the general storm coverage by 21z from the 16z run.

Toward the end of the exercise, the storm coverage was well captured by the PHS 16z run.  Should have taken this into account for my public graphics when describing the storm evolution.

NUCAPS

This is a NUCAPS sounding in the TX panhandle near AMA vs. a RAP40 sounding at the same point.  The RAP has the same trend in the dew point profile as NUCAPS, but is lower.

Noticed the NUCAPS sounding didn’t have the lower dew points around 400 mb as shown in the special sounding.  NUCAPS did have a hint of the weak cap near the surface though.

NUCAPS 700-500mb lapse rates from the gridded data was a constant 34.17 C/KM across the map.

NUCAPS forecast for ML CAPE was slightly less than what SPC mesoanalysis had at the same time of 20z.

NUCAPS ML CINH was higher than SPC Mesanalysis for 20z, with some parts of the CWA having almost 90j/kg of CINH south of Liberal, KS.

The 700-500mb lapse rates matched well with SPC meosanalysis for 20z.

OCTANE

OCTANE showed the cumulus developing along the dry line and warm front well.  Can also distinguish which clouds are becoming taller.

OCTANE highlighted where convection was taller, and Lightning Cast started to show probabilities for those same updrafts.

ProbHail

Noticed what could be an above anvil cirrus plume with the storm in question.  Prob Hail only had a 35% chance for severe hail at the time.

Prob Tor

Noticed the Prob Tor jumped up depending on what cells it was encompassing.  Took three screen shots to denote the trend.  Seemed reasonable for it to increase since the end cell was ingesting the dry line at the time the probabilities increased.

-Rainman

6/15 HWT OUN SuperCell

 A very intense supercell formed across western portions of OUN CWA. This cell underwent many transformations including splitting and merging at other times. Octane was very interesting to watch as this cell went through the various processes before eventually producing a tornado. Octane was able to show the storm splitting before it occurred on radar.  PHS was also showing corridors of stronger 0-3 and 0-1 SRH; SPC Mesoanalysis was showing this as well but I did like how the PHS was able to highlight exactly where these occurred. Seeing that and a near stationary boundary did increase my confidence that if a storm was able to latch on it would become tornadic. Probsevere/MESH did struggle to catch on to how large the hail actually was initially before finally picking up on the hail size.

4 Panel with Octane on the top row; appears to be two distinct divergence signatures occurring

Radar Loop of storm splitting shortly after Octane signature…. Notice how the left mover dissipates.

Using the 4 panel with Octane, IR and Day Cloud Phase it was also beneficial to see the upper divergence signature on Octane correlate with the cooling cloud tops of IR and Day Cloud Phase. Although it didn’t seem to create any additional lead time with that aspect; at least that I was able to notice. It was overall a very interesting storm to watch for this experiment.

4 Panel Intensification of storm.  Note the rapid color gradient to blue (upper level divergence)on Octane towards the end of the loop.

Radar loop around the same time as the 4 panel above   

- Tor Nader

6/15/23 HWT - AMA

 What appears to be a nice distinction between sheared / lesser sheared convection across the Octane window. Stronger shear across SW OK producing much different appearance versus SW KS convection.  Nice quick visual distinction for operational use. The idea of a quantifiable divergence contour and/or grid would be welcome also.

Octane data from Goes west meso sector was zoomed in along the inflow region across the SW OK supercell (not our CWA but I had to look). The upper right panel is the directional component and the color scale was changed to highlight approximately 210 - 150 degree range. The increasingly warm colors represent a backing of flow at approximately 4.5 kFt. This level of storm integration (if appropriate) would be advantageous to warning operations.

ProbSevere time series plots do not sample. I would like sampling tied to the cursor as in the parent CAVE window. The element assignment within ProbSevere did cause a problem with the time series information with a storm that strengthened on the southern end of a developing line. The storm initially had a defined area for the region of interest but once ProbSevere assigned it to the larger line the probabilities became much less representative. This impacted ProbTor values which were being monitored ahead of an eventual tornado warning in the Tx Panhandle. I was the warning forecaster today and used ProbSevere extensively for my decisions. It is not the deciding factor but it certainly weighs into the decision process.

PHS model output was interesting and the Updraft Wind element was noted as something not usually seen with model output. It was viewed initially but I didn’t monitor the model output once storms developed and warnings were being issued.

NUCAPS forecasts were unavailable until the very end of the operational window. I did view the 19z overpass soundings and found the familiar  trends of errors at the boundary layer when compared to nearby surface observations. This limitation continues to impact my confidence in the product.

- jbm