Wednesday, June 14, 2023

6/14/23 HWT - SHV

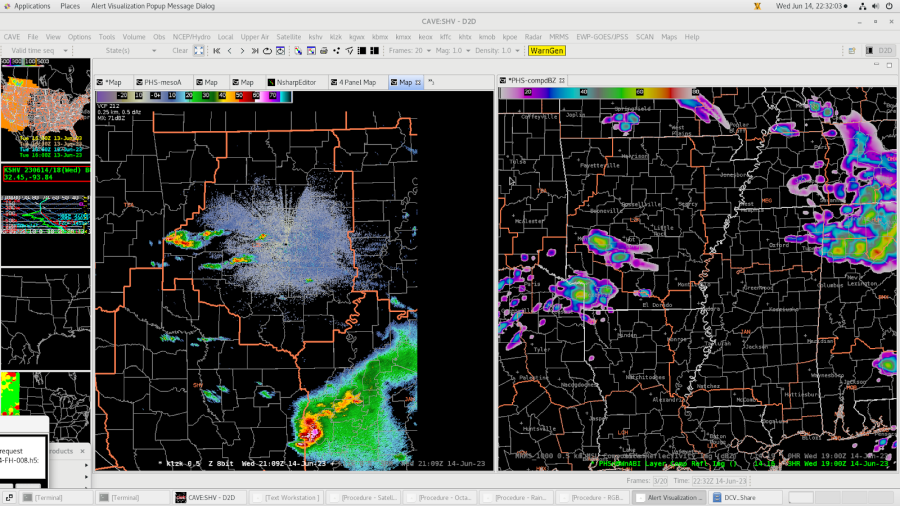
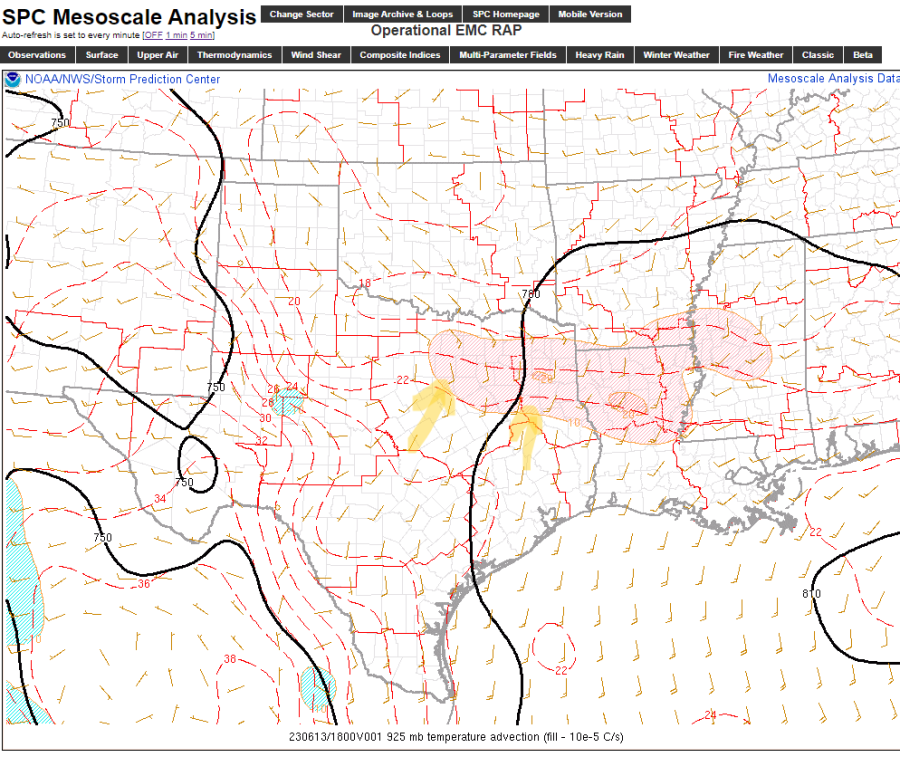
 Operational window encompassed ongoing severe storms at the start of the period which moved eastward out of the CWA by mid afternoon. The resultant outflow boundary / cold front intersection to the west of the CWA become the focus regions for potential for renewed storm development.

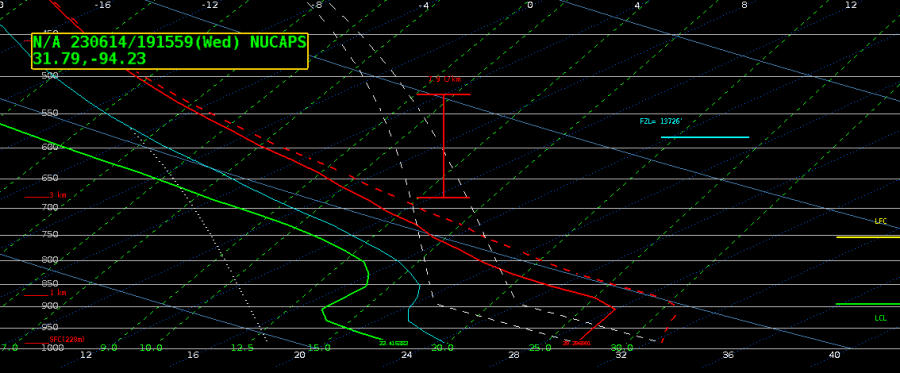
NUCAPS 6/14/23 19z sounding south of the outflow boundary of interest compared to nearby surface observation showed a large discrepancy in observed surface conditions (90/72 at nearby ASOS). This raises considerable questions on how these soundings are to be best utilized in operations.
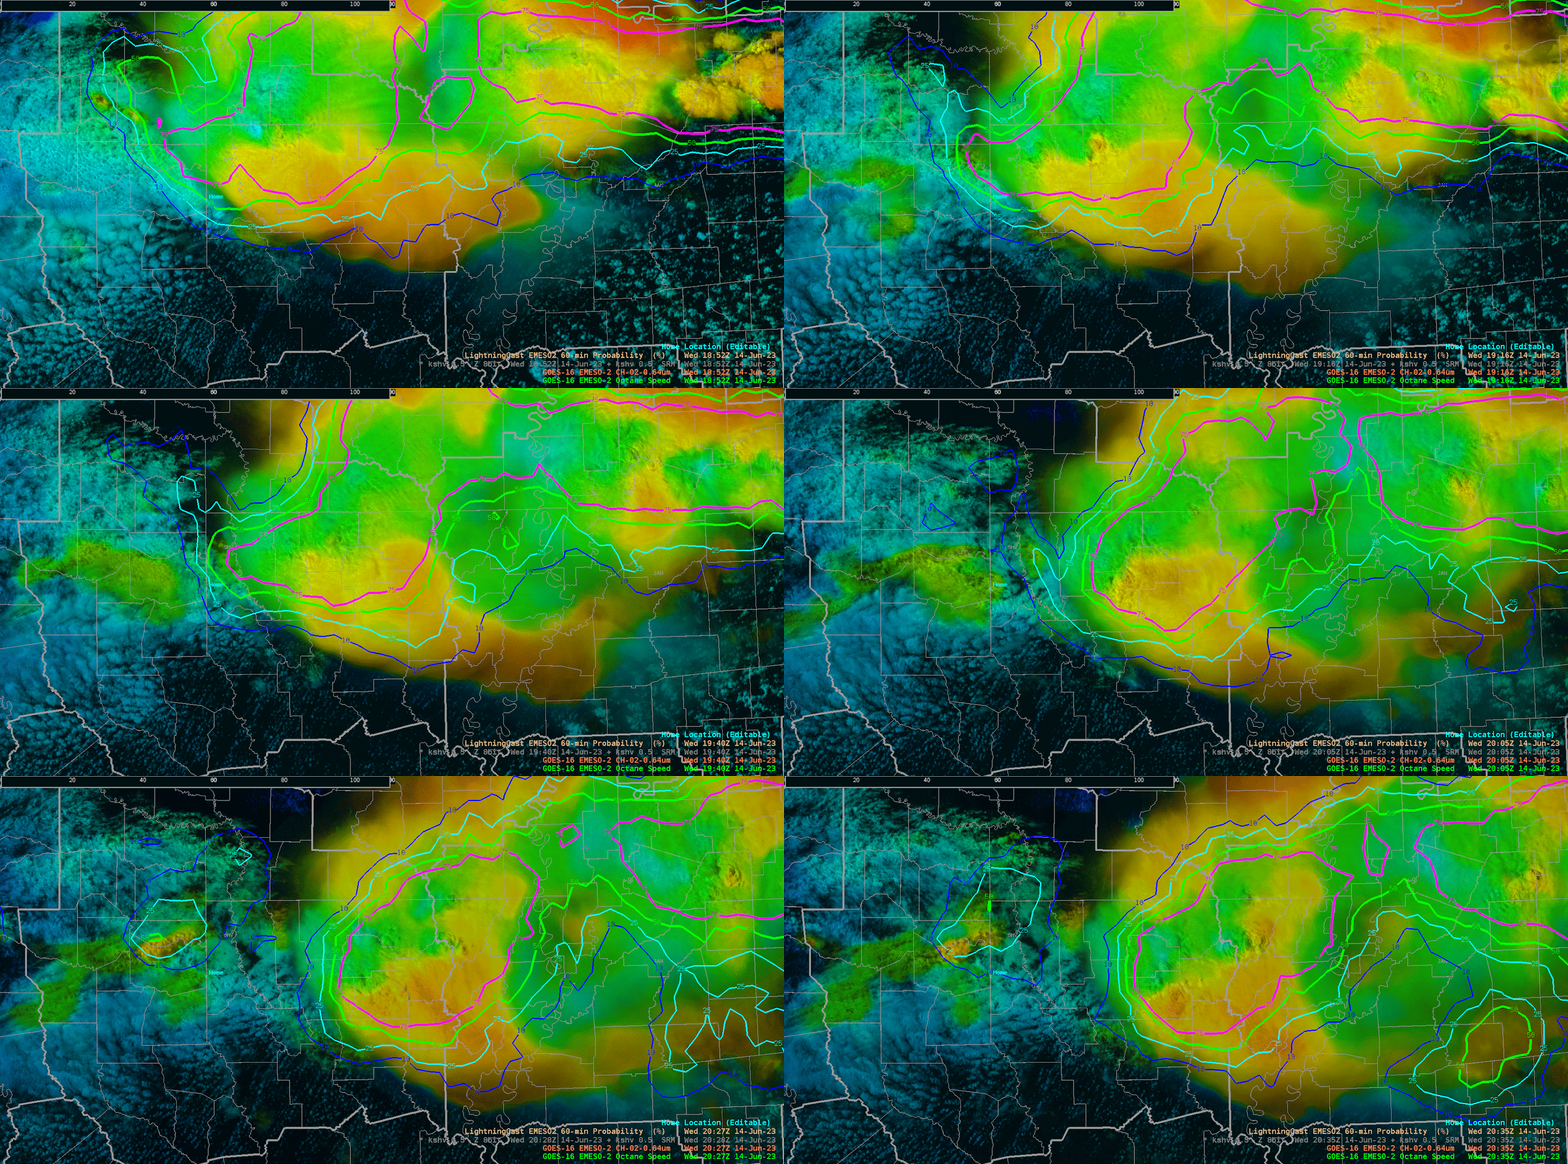
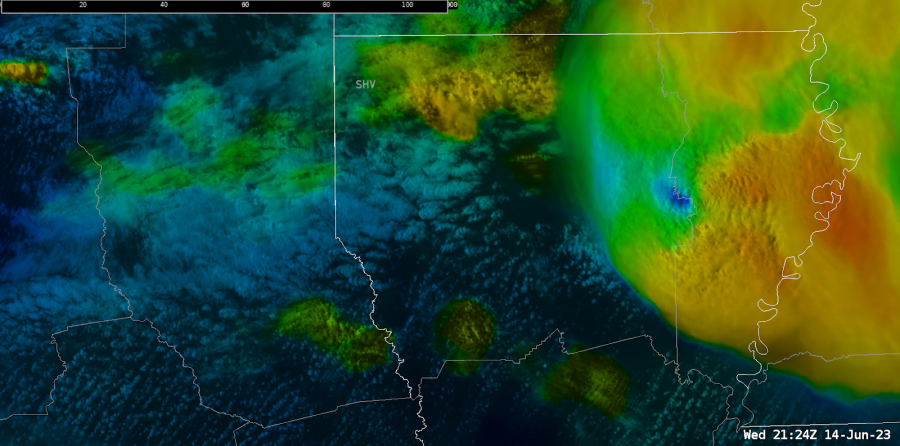
OCTANE was useful in monitoring the attempted updrafts along the outflow boundary. It seems to show updraft growth more clearly than the day cloud phase product. I would like to see these data incorporated into the LightningCast model as this product is also very good at highlighting potential areas for CI.

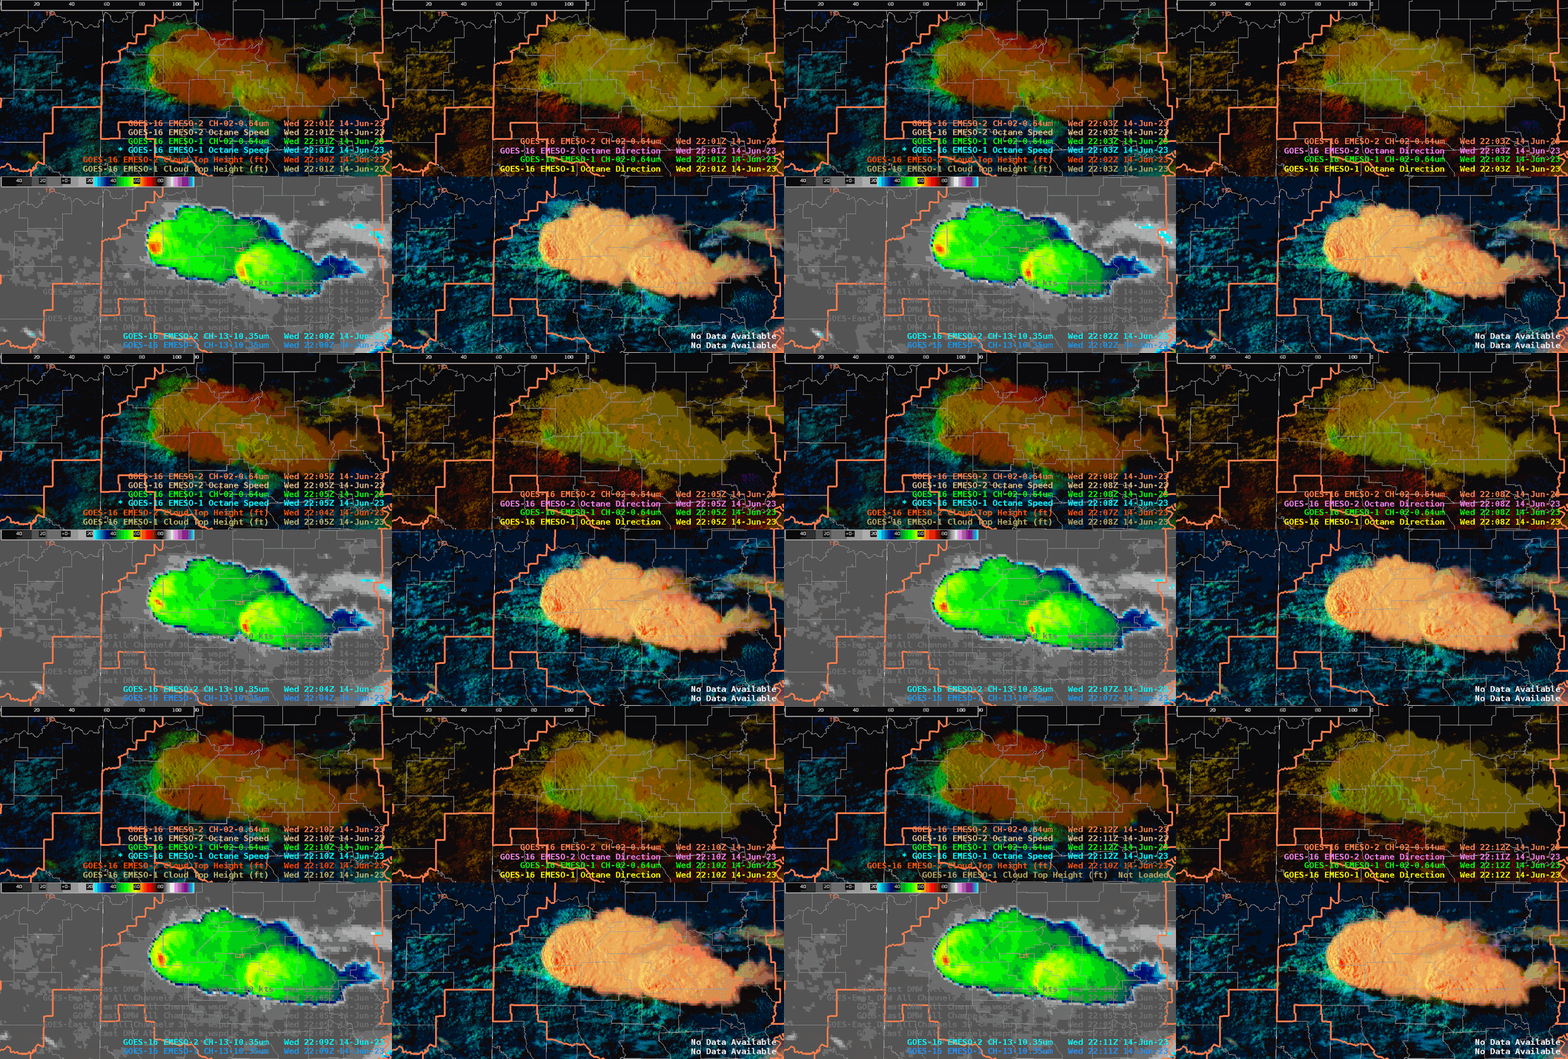
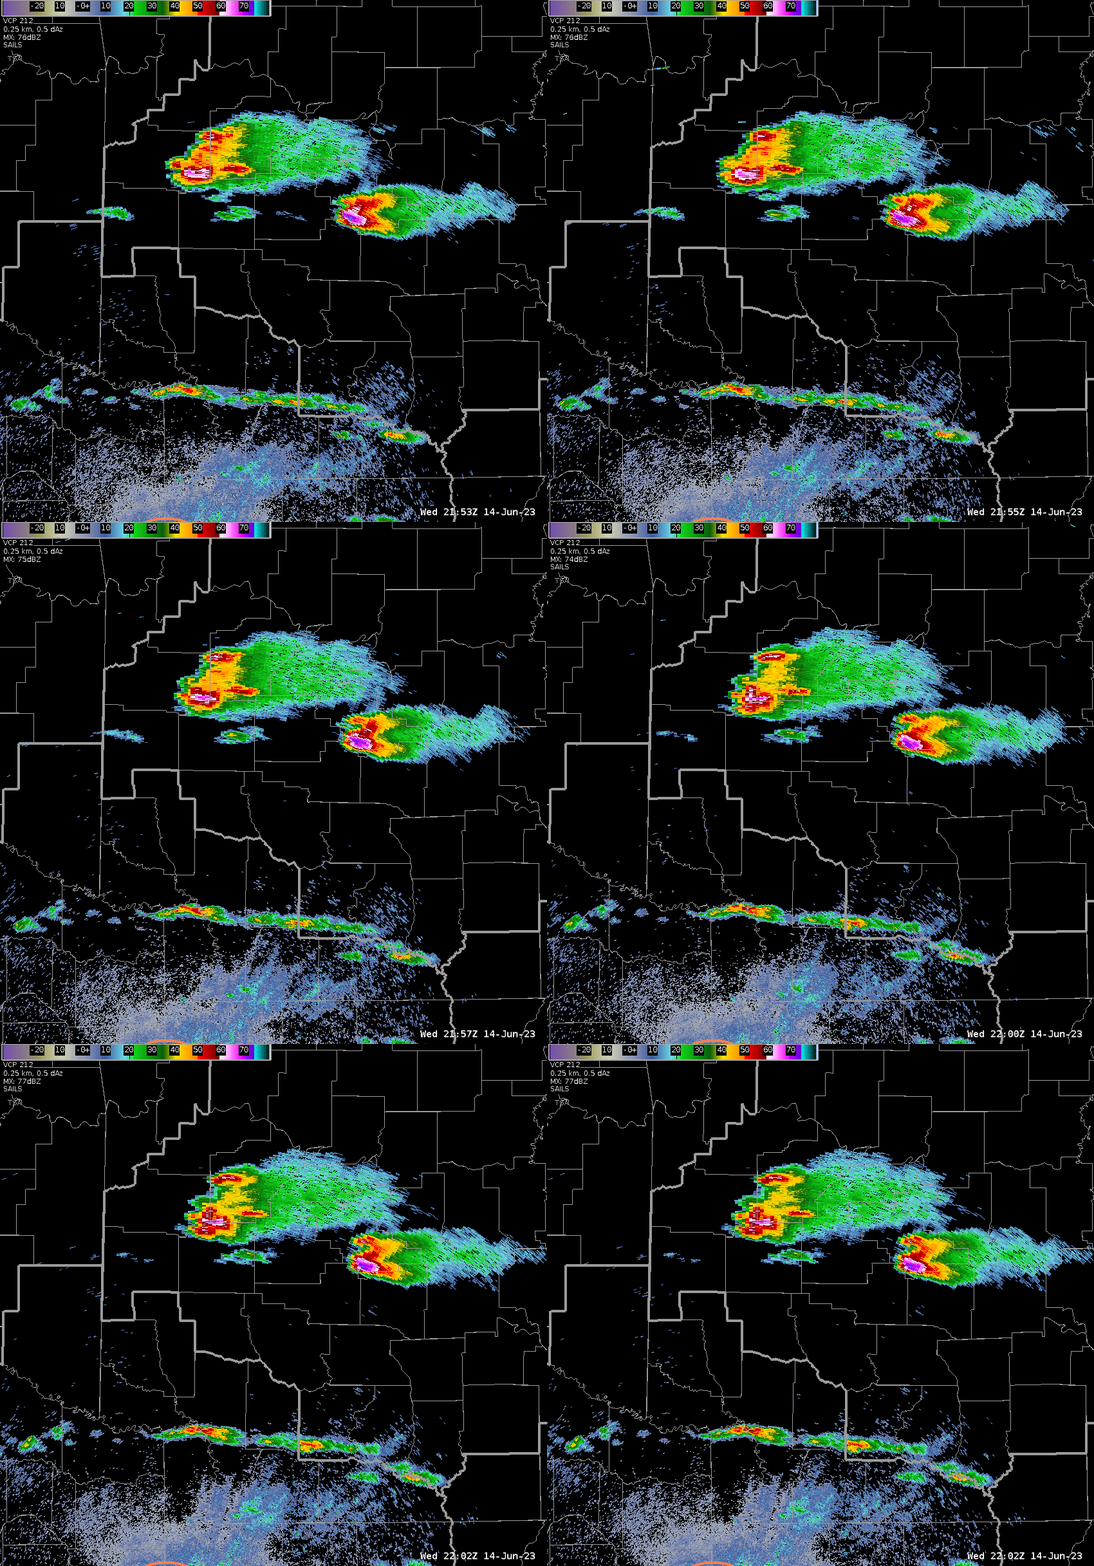
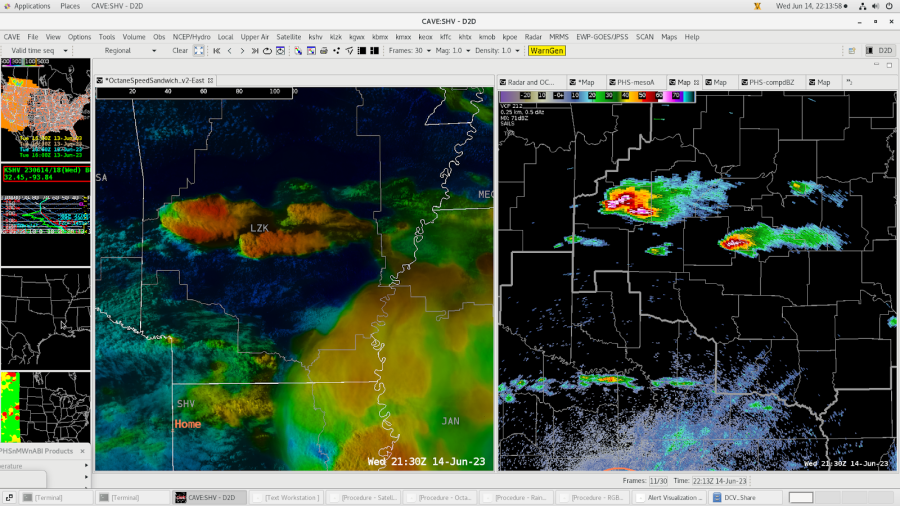
OCTANE output was also viewed  in a region of a splitting supercell across western AR. Good conversation with developers on further development of the wind retrievals with observational data constructed hodographs being an operational request.

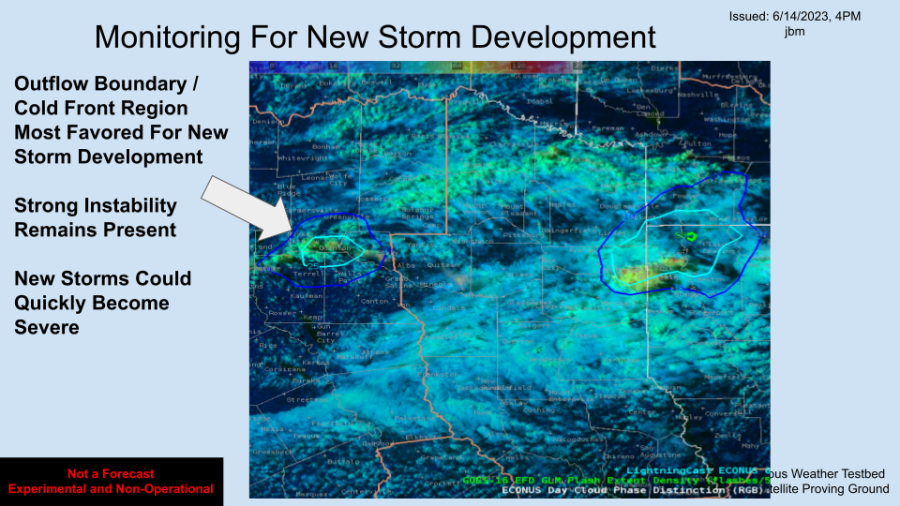
Utilized LightningCast to highlight the region of concern for new storm development. The storms did develop but it was a more gradual evolution. The highlighted region did verify as the region of development.
ProbSevere did a great  job as a safety net for radar warning operations. The element trend window is a helpful addition.  Talked with the developer on potential marking times along the time series where the element changes ID or grows in area to show when ProbSevere has merged or separated elements as this impacts resultant probabilities.

PHS model output from the 16z run was viewed online and compared to the corresponding HRRR. At the time of the exercise conclusion its solution had verified better on composite reflectivity than did the HRRR. A product in AWIPS highlighted regions where the fusion data is different than a zero hour model output would be beneficial for situational awareness and potentially for model output utilization.

- jbm
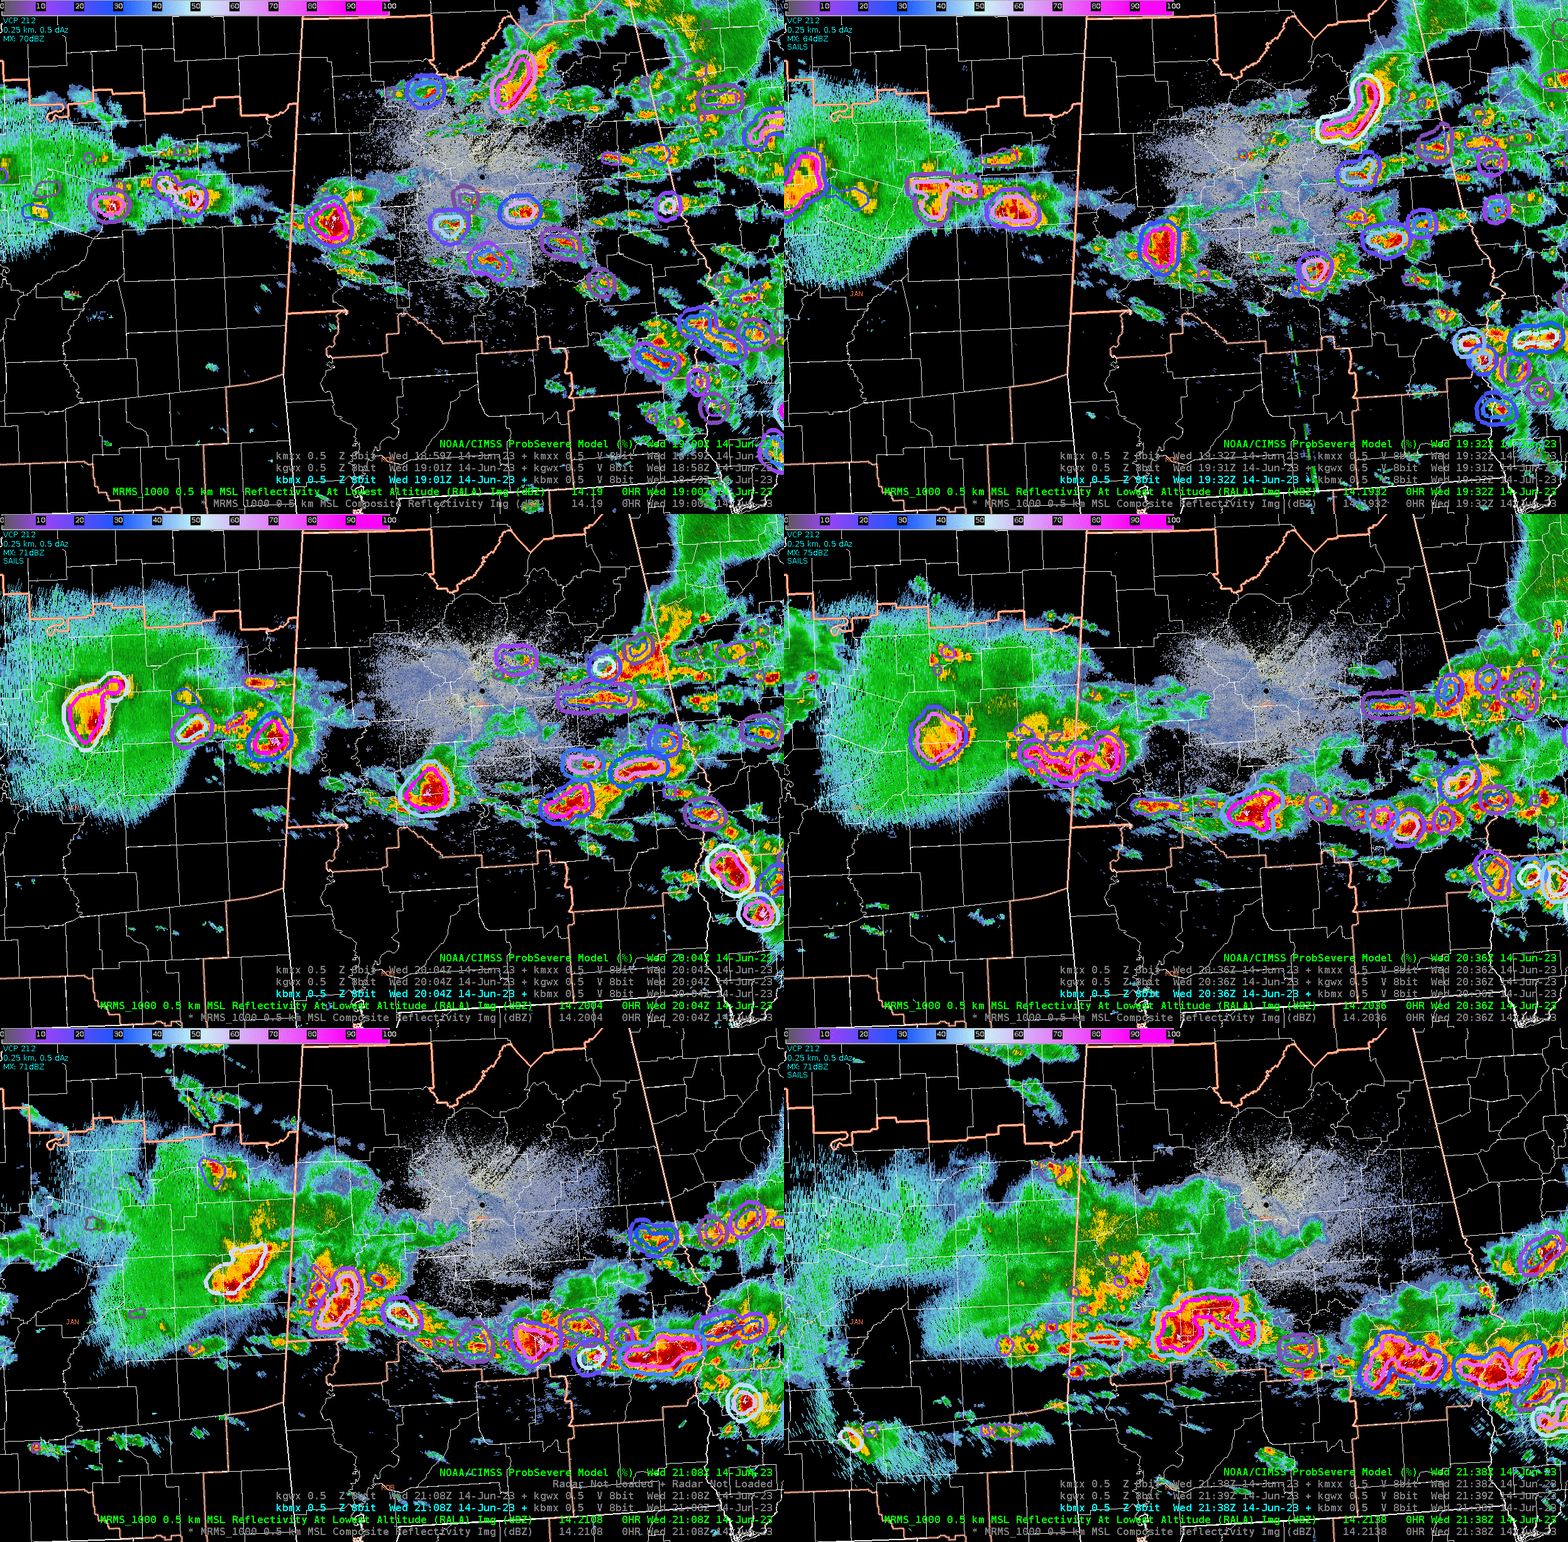
BMX Warning Met (West Sector) on June 14, 2023

 Our group role played as BMX during an anomalously conducive environment for severe weather consisting of very high instability and very high shear. My position was warning met, sectorized for the western half of the CWA.

ProbSevere helped considerably in triaging which storms deserved attention, and which storms were trending in such a way that warranted a warning decision and/or adjustment. A combination of several supercells that would merge with other cells and evolve into clusters and bowing quasi-linear structures made it difficult to have a comfortable handle on storm behavior and associated hazards. This was compounded by the fact that radar data from the favored radar site, KBMX, was dropping out at times. While other datasets were referenced (satellite, surface observations, storm reports, objective analysis, etc.), ProbSevere felt like it gave the biggest helping hand in warning decisions during this complex scenario.

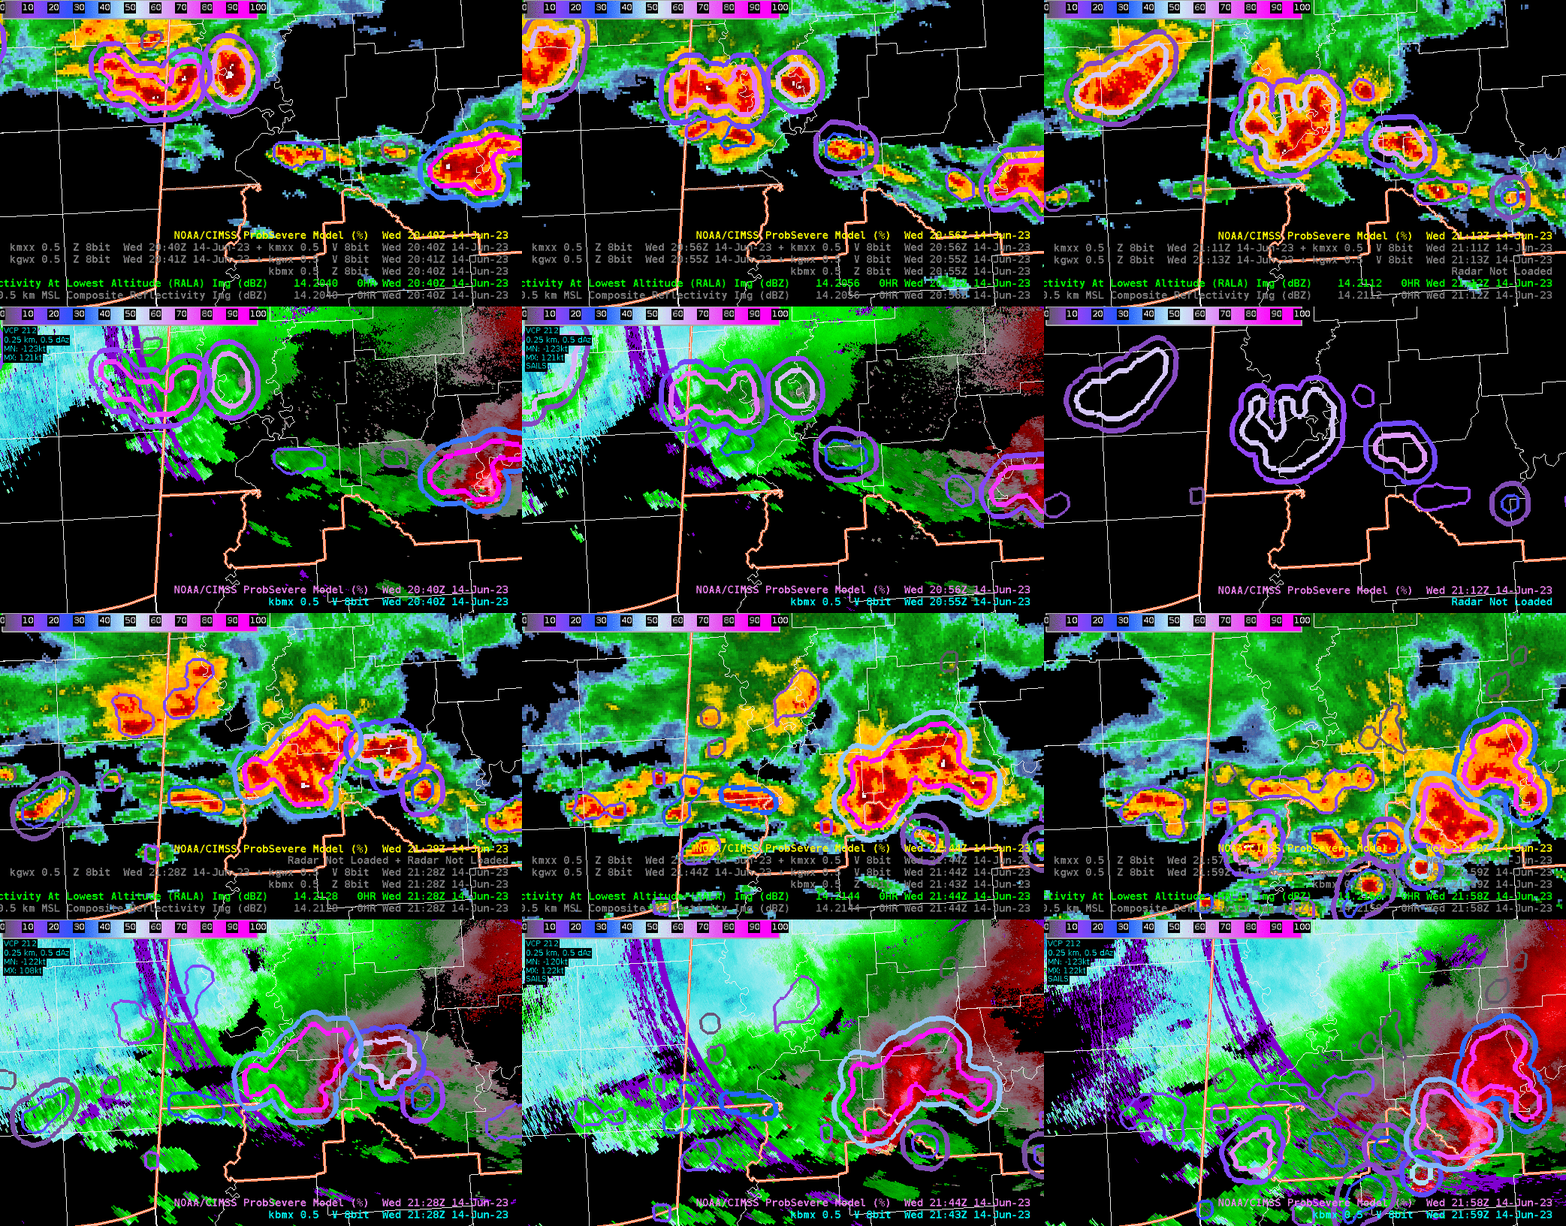
Looking in the southwest portion of the CWA around 20:30 - 22:00 UTC, ProbSevere signaled the diminishing probabilities associated with a bowing segment that earlier resulted in an 82 mph wind gust within eastern MS as convection was decaying rapidly. This helped grow confidence in holding off on a warning as it entered BMX’s CWA.

ProbSevere also pointed at a cluster of storms increasing in potential for severe hazards. This was helpful given the noisy velocity data, higher than desired sample height (closest radar sampled ~5-8kft), and likely complications regarding wind vectors having some orthogonal component to the radar radial. Essentially, ProbSevere provided clarity and continuity in a noisy radar situation increasing confidence in storm behavior.

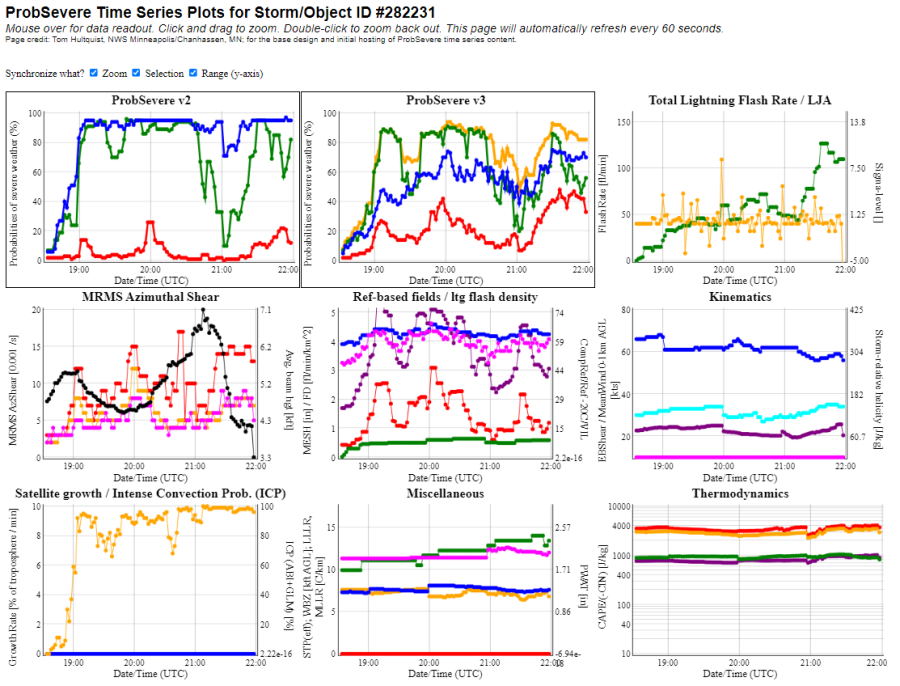
Having discussion with a developer, I expressed how useful it was to not only have a time series to view trends in overall probabilities of severe hazards, as well as of each hazard (i.e. hail, wind, tornado), but also time series of the data that drives the probabilities like those offered by CIMSS.

The above time series corresponds to the cluster of storms in southwest BMX around 20:30 - 22:00 UTC (link). Notice in the time series the local minima in probabilities within ProbSevere v3 around 21:00 UTC (~47%)  followed by a notable increase in probabilities, exceeding 80% around 20 minutes later. This trend in local minima followed by increasing probabilities was more obvious than ProbSevere v2. Looking at the individual inputs, this was likely driven by an increase in things like Azimuthal Shear, VIL, MESH, Lightning attributes, along with other environmental attributes.

- 0SMBLSN

Verification of NUCAPS Soundings

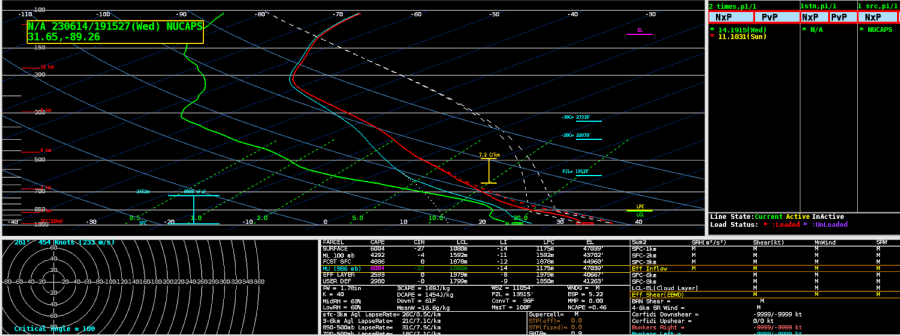
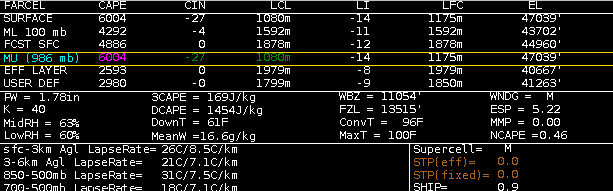
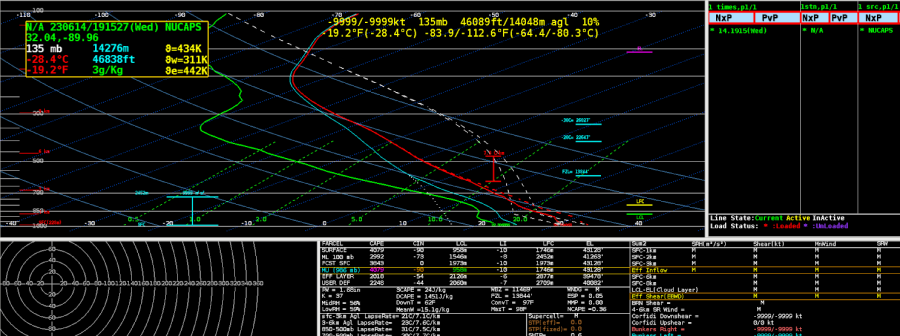
 Using the 1930z pass of the NUCAPS soundings during an SPC Moderate Risk was quite exciting.  The environment was primed for significant severe weather and having NUCAPS soundings available at the time of convection out of ahead of storms was beneficial. It provided additional confidence in the severity of the environment. 

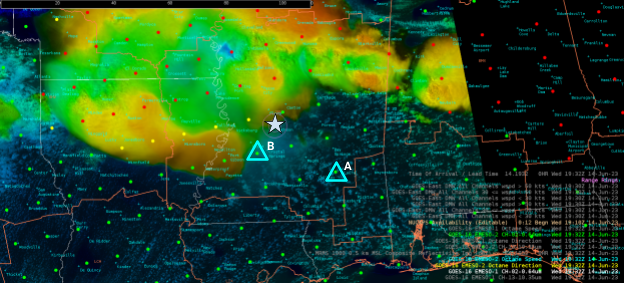
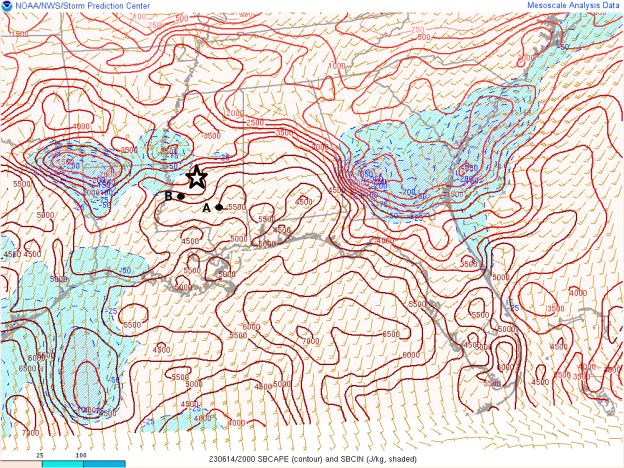
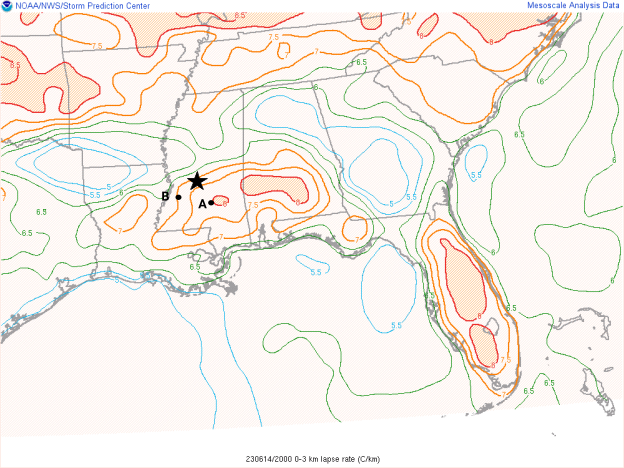
As you can see from the satellite, soundings were unusable further north due to the ongoing convection and cloud cover. Thankfully clear skies prevailed from Jackson and southeastward providing some impressive sounding data to compare to SPC Mesoanalysis.  Sounding A was well in the warm sector and sunny skies and thus had the highest CAPE values and lapse rates. Sounding B was just to the southwest of the DSS event and was beginning to see some anvil over that location, but it still provided reasonable data and compared well with SPC mesoanalysis.    

Figure 1: Location of the NUCAP Soundings chosen to view and compare to SPC mesoanalysis. For reference, the range rings outline the 5 and 10-mile radius around a DSS event in Jackson, MS. 

Figure 2: Sounding A with a surface-based CAPE of 6004!

Figure 3: Sounding B with a modest 4079 surface-based CAPE.

Figure 4: SPC mesoanalysis Surface-Based CAPE and CIN at 20z on June 14, 2023.  The star is the DSS event location and the two dots are the estimated location of the soundings analyzed.

Figure 5: SPC Mesoanalysis 0-3km lapse rate (C/km) depicted lapse rates from 7.0-8.0. Once again, both soundings matched up well with SPS data.

- Podium

Day 3 Review of Products & Operational Applications

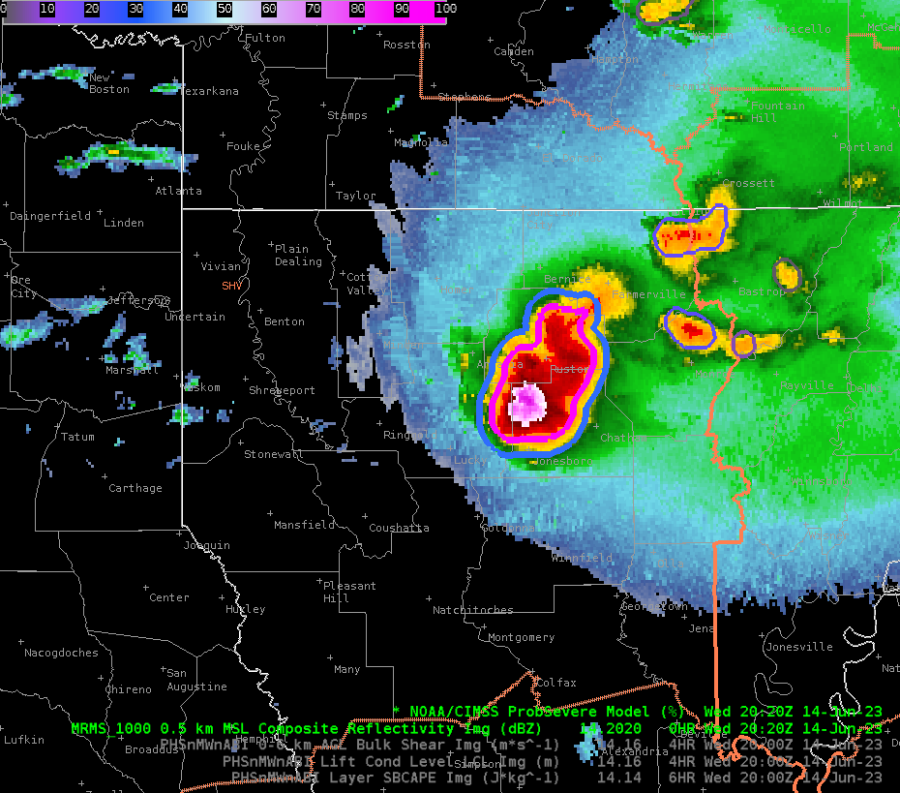
 I took on the warning forecaster role during the operational period today. A supercell was underway at the start of the period, so I began by issuing a Severe Thunderstorm Warning. ProbSevere was (unsurprisingly) indicating a slam dunk for severe wind and large hail (Figure 1) but I noticed when sampling the ProbSevere data that MESH was slow to pick up on just how large the hail was with this storm. A broadcast meteorologist passed along a report of 5-inch hail at 2000z, but MESH did not indicate 4+ inch hail until 2020z.

Figure 1

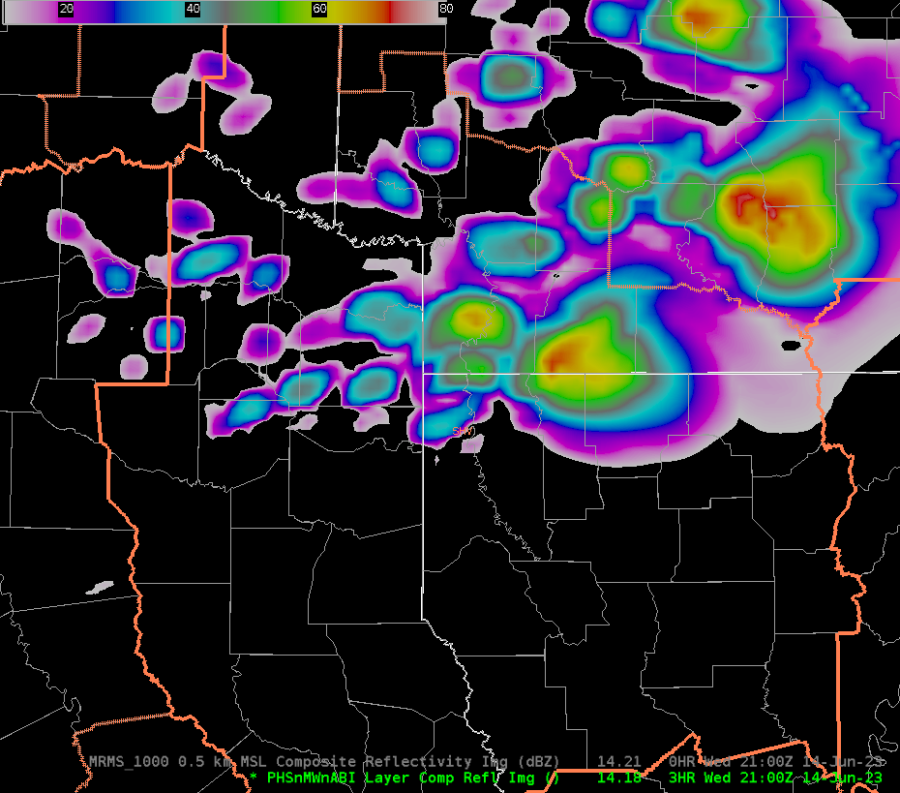
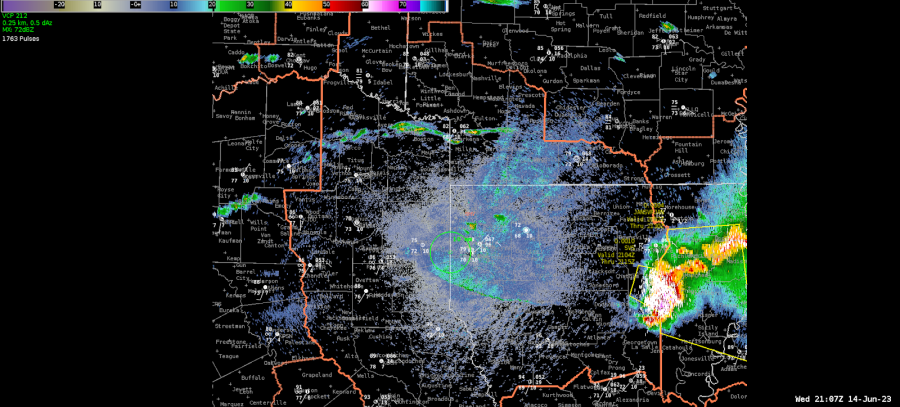
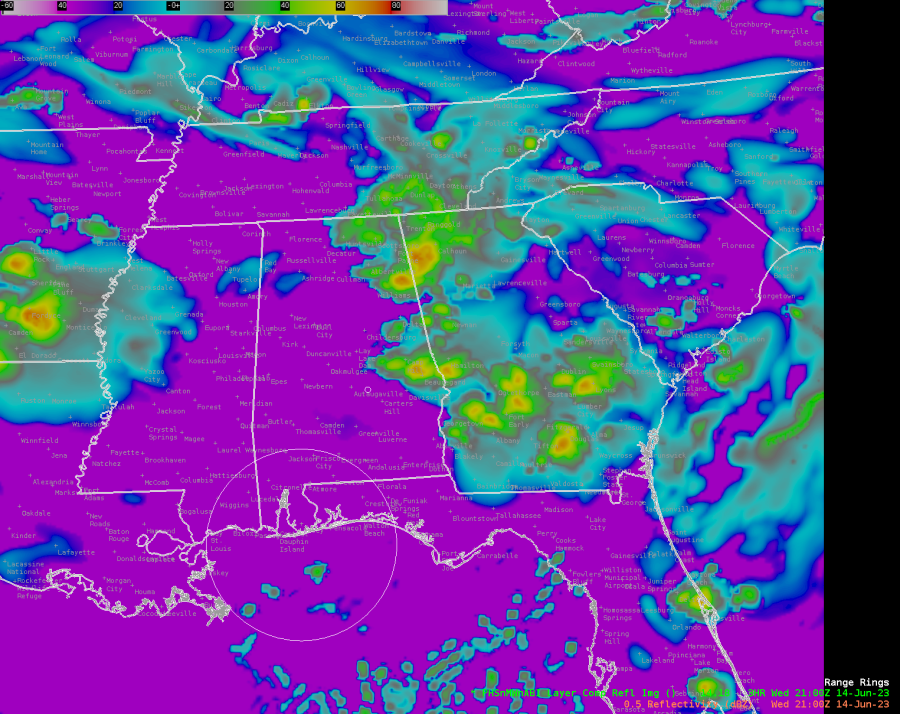
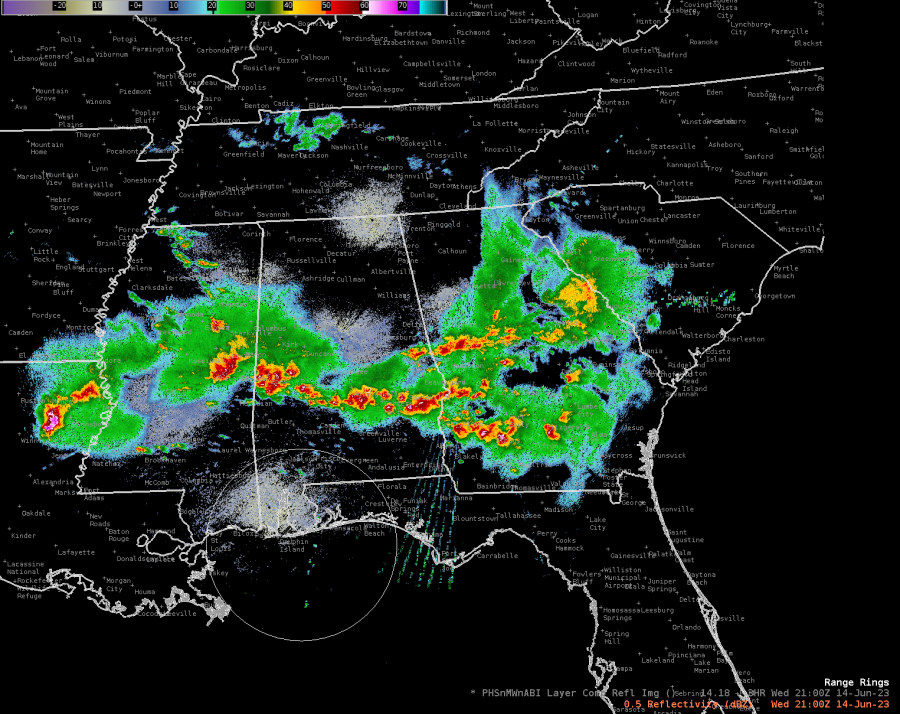
I also noticed that PHS composite reflectivity was much too slow with the progression of convection across the SHV CWA. Below are a screenshot of PHS progged composite reflectivity at 21z and a screenshot of the radar 0.3 degree reflectivity at 21z. PHS expected the supercell of interest to still be located over the northeast portion of SHV (Figure 2) while in reality the supercell was about to exit the easternmost fringes of the CWA (Figure 3).

Figure 2

Figure 3

Once the aforementioned supercell exited the SHV CWA, we pivoted to the LZK CWA to monitor the ongoing convection there. I decided to interrogate the OCTANE products because I hadn’t looked at much satellite imagery thus far.

OCTANE was especially useful in two ways today:

  • OCTANE Speed indicated a storm split underway as two speed maxima can be seen in the red-orange hues (Figure 4, top left panel)
  • I tweaked the AWIPS colormap for OCTANE Direction to better depict the storm-top divergence occurring (Figure 4, top right panel)

Figure 4

- Vort Max

PHS Reflectivity Forecast Helping Out with DSS

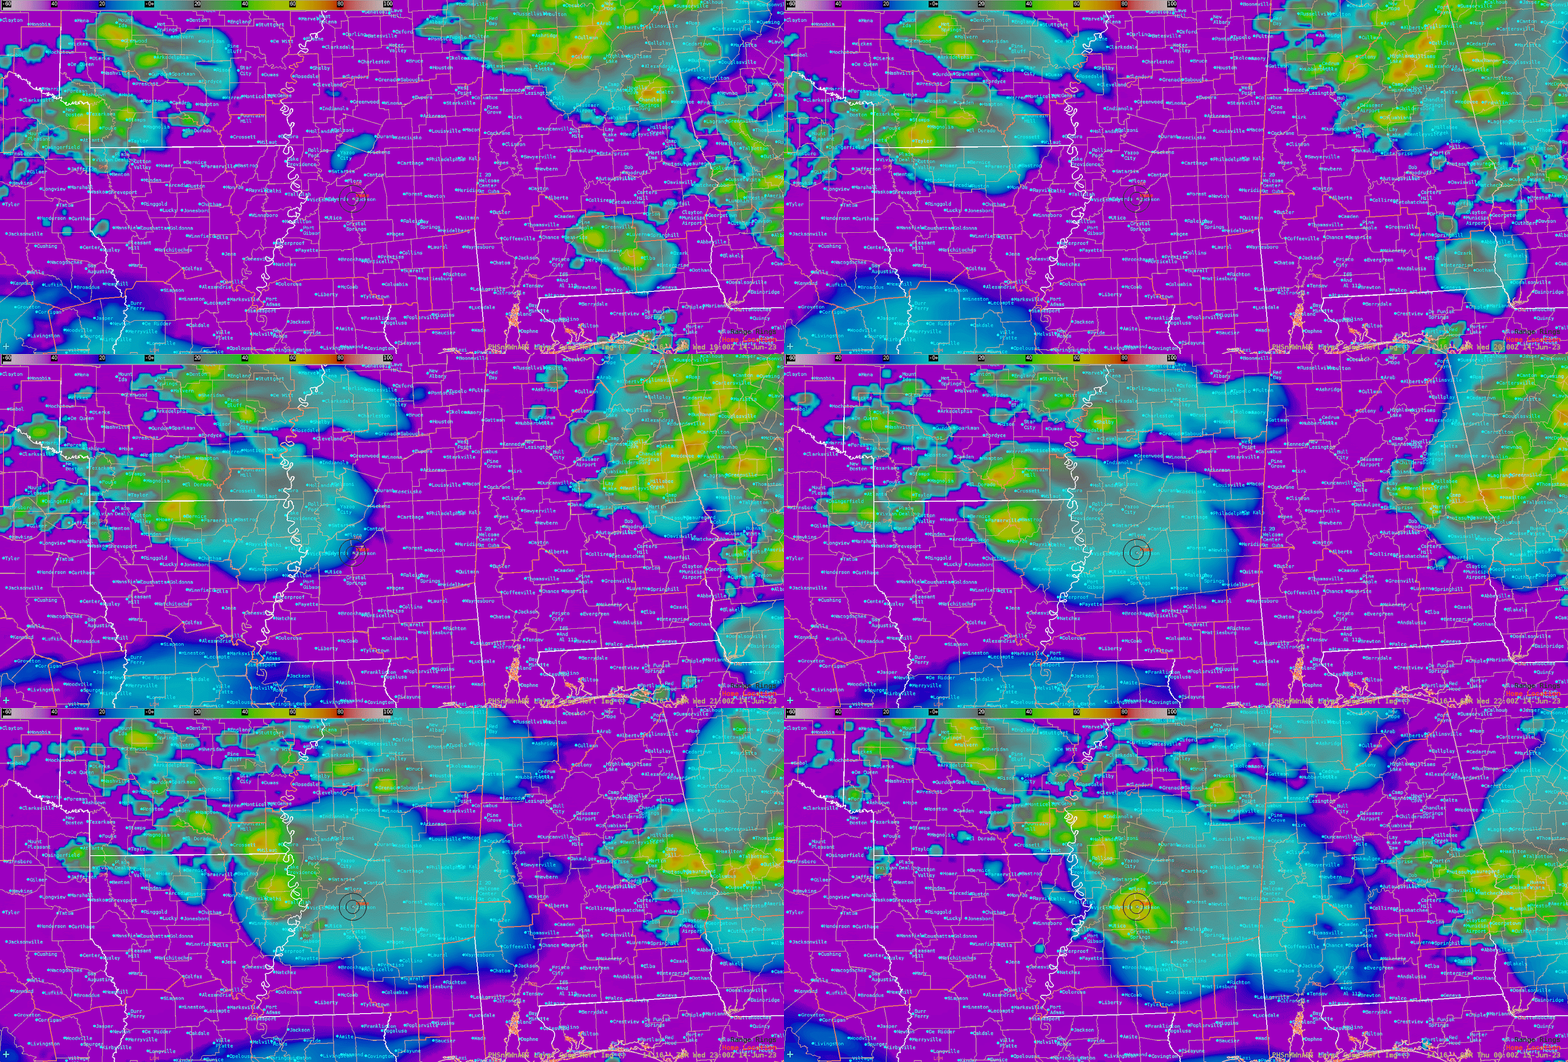
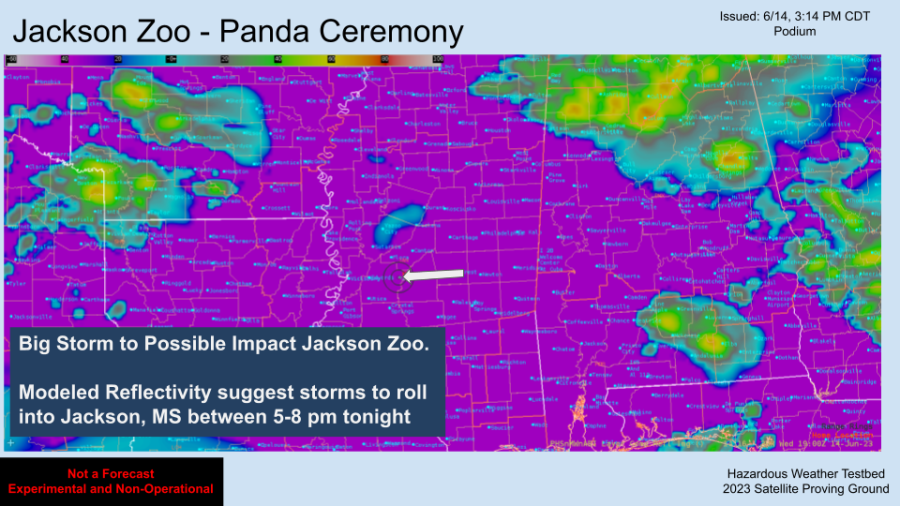
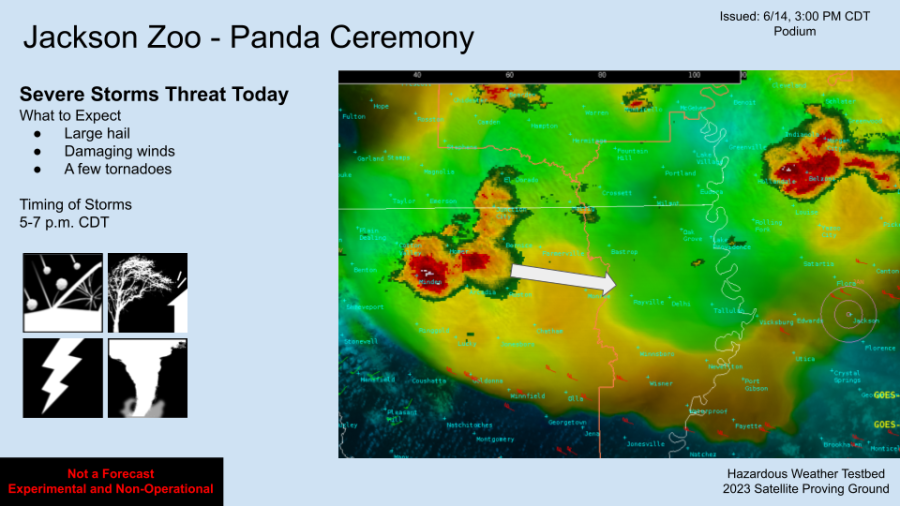
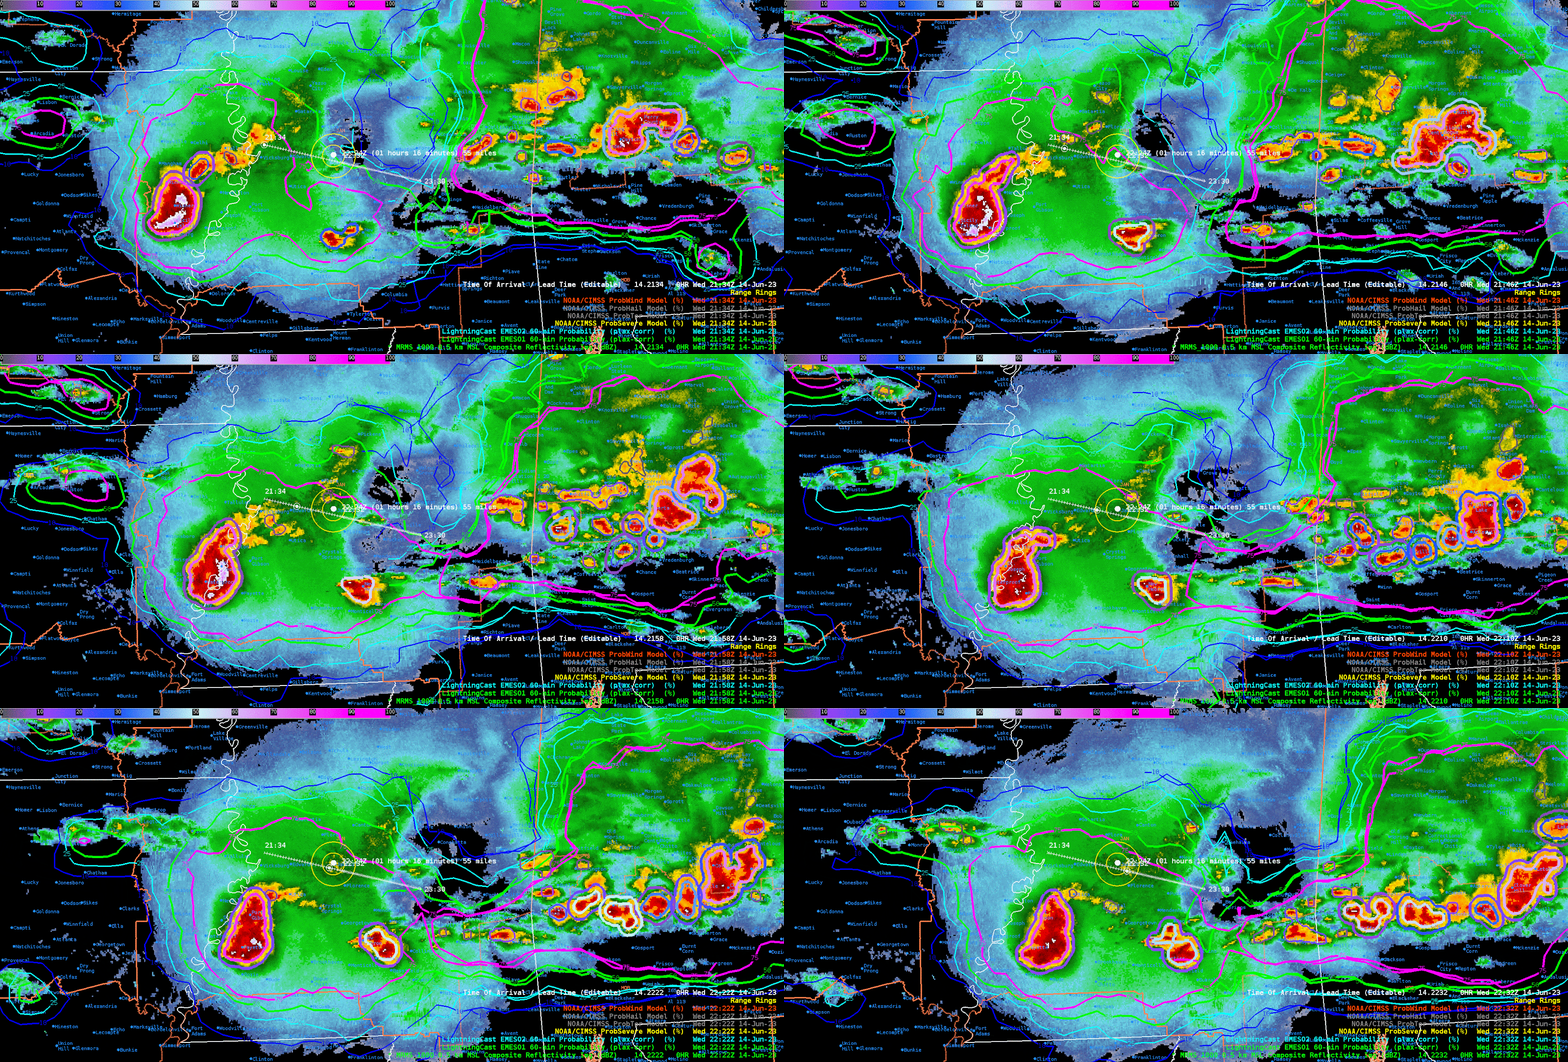
 The Panda Ceremony was held at the Jackson, MS Zoo on the evening of Wednesday, Jun 14, 2023.  Strong to severe storms were forecast throughout the afternoon and evening hours and the event coordinator requested DSS for lightning and any severe weather with as much lead time as possible.  Using the 14.16z initialization of the PHS reflectivity was useful in providing some timing details to the event coordinator (See Figure 1). It suggested a fairly robust storm to roll through the Jackson area by around 00z with the forecast reflectivity ranging from 50-65 dBz directly over the event site.  

The reflectivity forecast did well with depicting a fairly large storm to move across southern Mississippi but was a bit too north on the location.  Overall, the product was very useful in boosting the forecaster’s confidence in the convection timing to impact the event. See Figure 4 for a look a the verification.

Figure 1: Loop of the 14.16z PHS layer reflectivity had a large storm over Jackson, MS, and impact the event (black range ring) by 00z.

Figure 2: A DSS Graphic was issued shortly after 3 p.m. to highlight the timing and potential impacts of the Panda Ceremony.  The original image had the animated GIF above with the PHS reflectivity forecast.

Figure 3: This was the first of 3 graphics created for the event and this graphic highlighted the severe weather threat and timing.  Overlaid is the MRMS reflectivity greater than 35 dBz and OCTANE Winds.

Figure 4:  A loop of MRMS with ProbSevere and LightningCast shows some verification of the PHS reflectivity forecast shown above. This loop ends at 2232z.   

- Podium

BMX Severe Thunderstorms

 Overall, I used OCTANE, PHS, ProbSevere 3 and LtgCast today. NUCAPS wasn’t really accessible. Worked the DSS event, an Air Show, which was canceled due to severe thunderstorms all afternoon producing tornadoes, large hail and damaging winds. DSS for this event would have been done days ago.

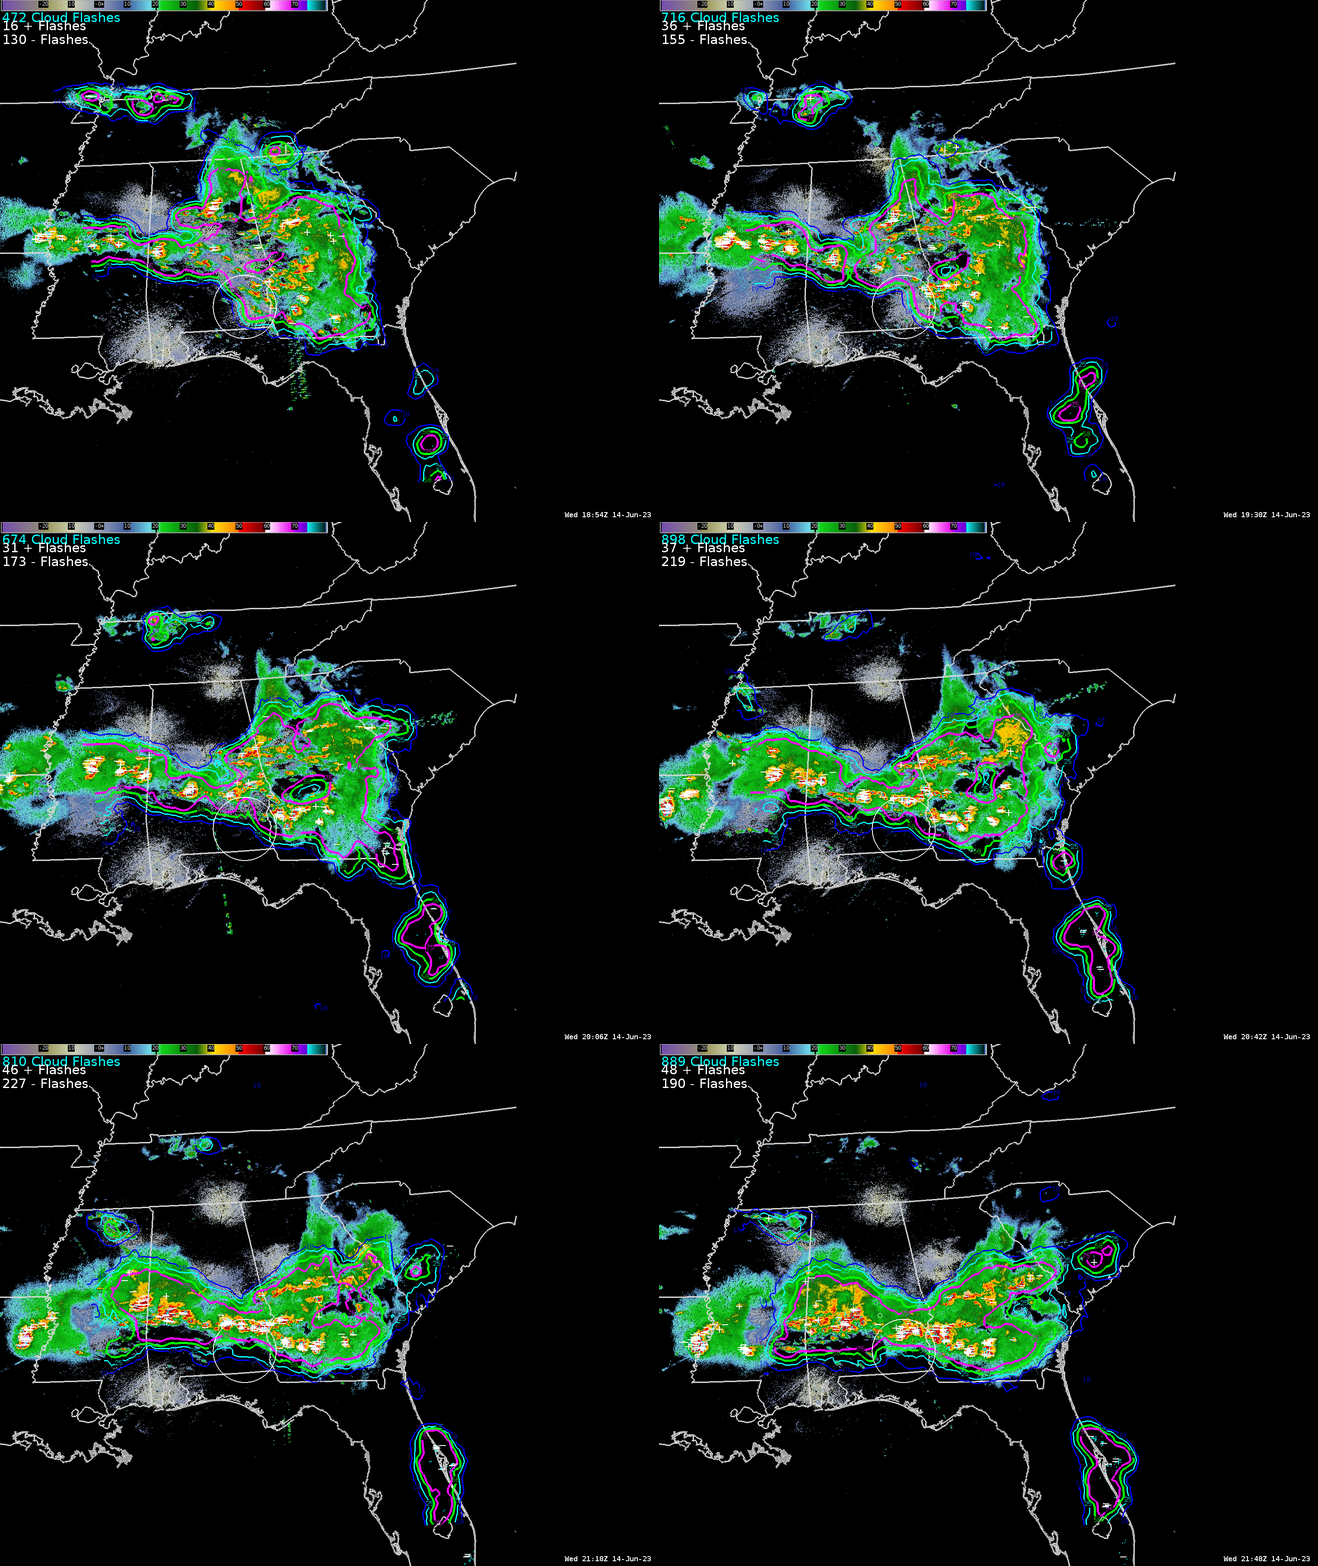
Below is a shot of LtgCast on a radar background and ELN measured lightning, the +/- are positive and negative ground strokes, and the cyan dots are in-cloud. It is interesting how the 75% probs lead out into southwestern Georgia though the showers there are more stratified and lightning isn’t expected, yet it gave about 45 minute notice of lightning strikes; that’s a good thing. But how useful is this? It predicted a few single lightning strikes tens of miles apart scattered across 100 miles which isn’t really useful; would you stop all outdoor activities across ¼ of Georgia for a few stray strikes? Would you clear the baseball field because a lightning strike will hit in the next hour somewhere within 50 miles? Not likely, but knowing there is some chance is valuable information for an event coordinator for risk analysis. If they can make minor changes to activities with little or no impacts, it helps, especially if it’s an area where lightning isn’t expected. What would be a big plus would be an estimate of flash density/frequency expected to go with the probs. That gets back to tracking the convective cells to predict areas of dense lightning. We have radar and ELN’s for that.

PHS composite reflectivity vs radar at 21Z… I find little value in the PHS composite reflectivity product. Below you see PHS composite reflectivity compared to the radar returns at 21Z. It’s not doing too well and I haven’t seen a time when it has done well predicting where the storms will be. The HRRR, NSSL WARF, HRef, NAM Nest and other high res models do much better.

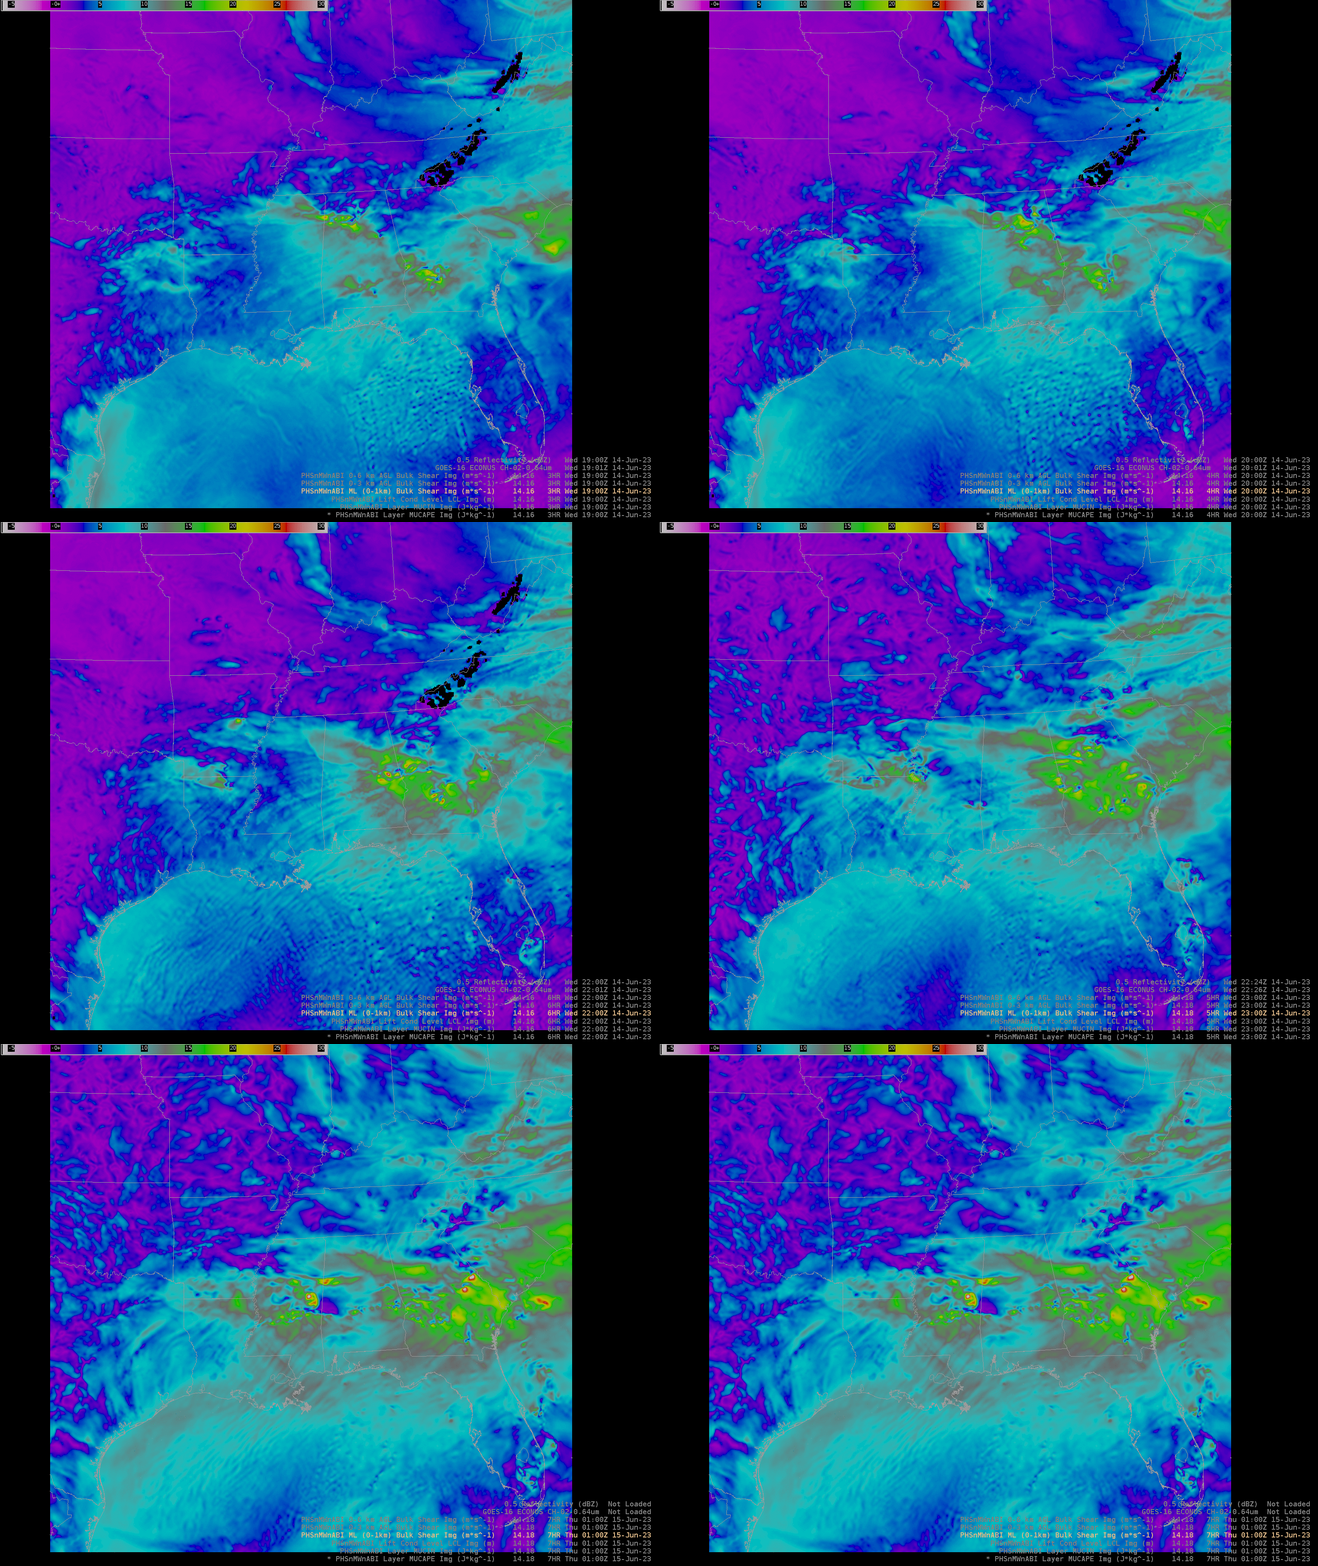
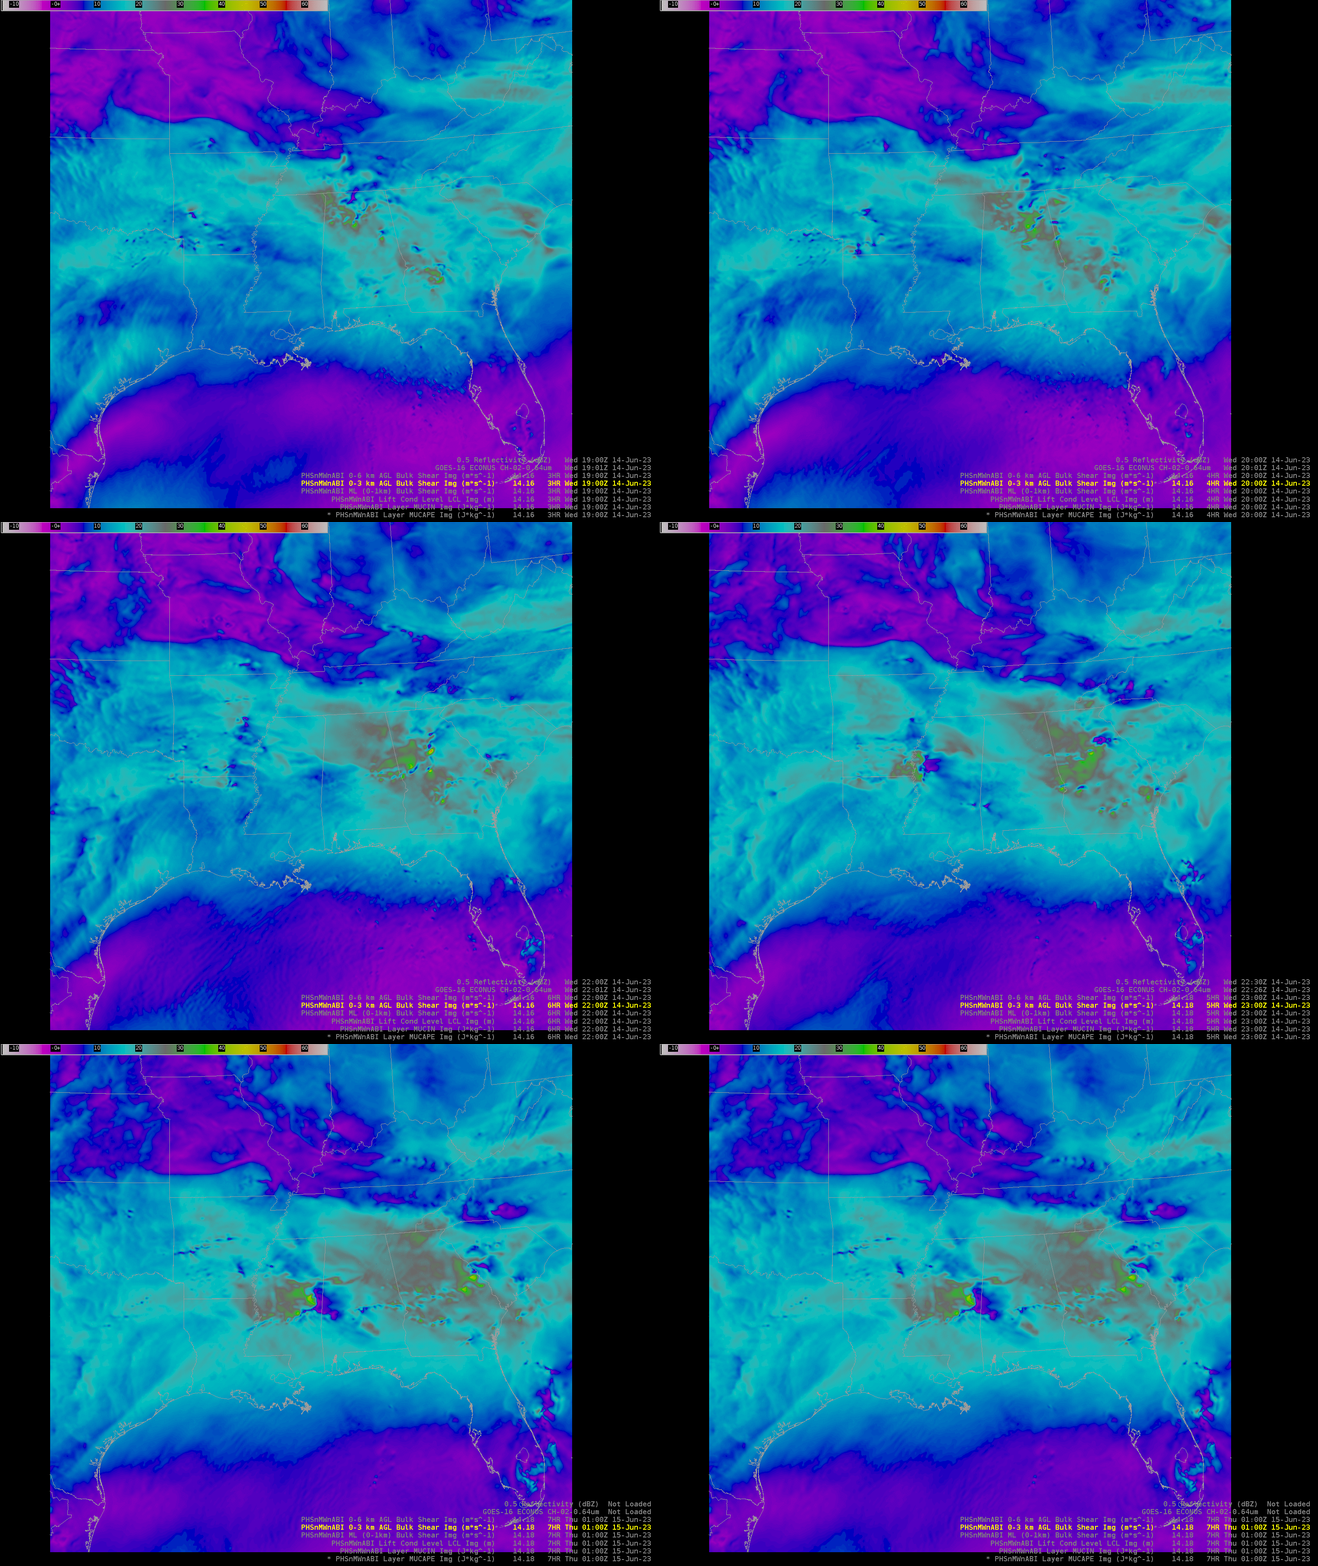
PHS Bulk Shear 0-1 km below on the left and 0-3 km below on the right both show a line between areas of lower and higher shear along the boundary where the severe storms were tracking, but this occurred after the convection started. I don’t see a pre convection signal pointing to where the training storms formed.

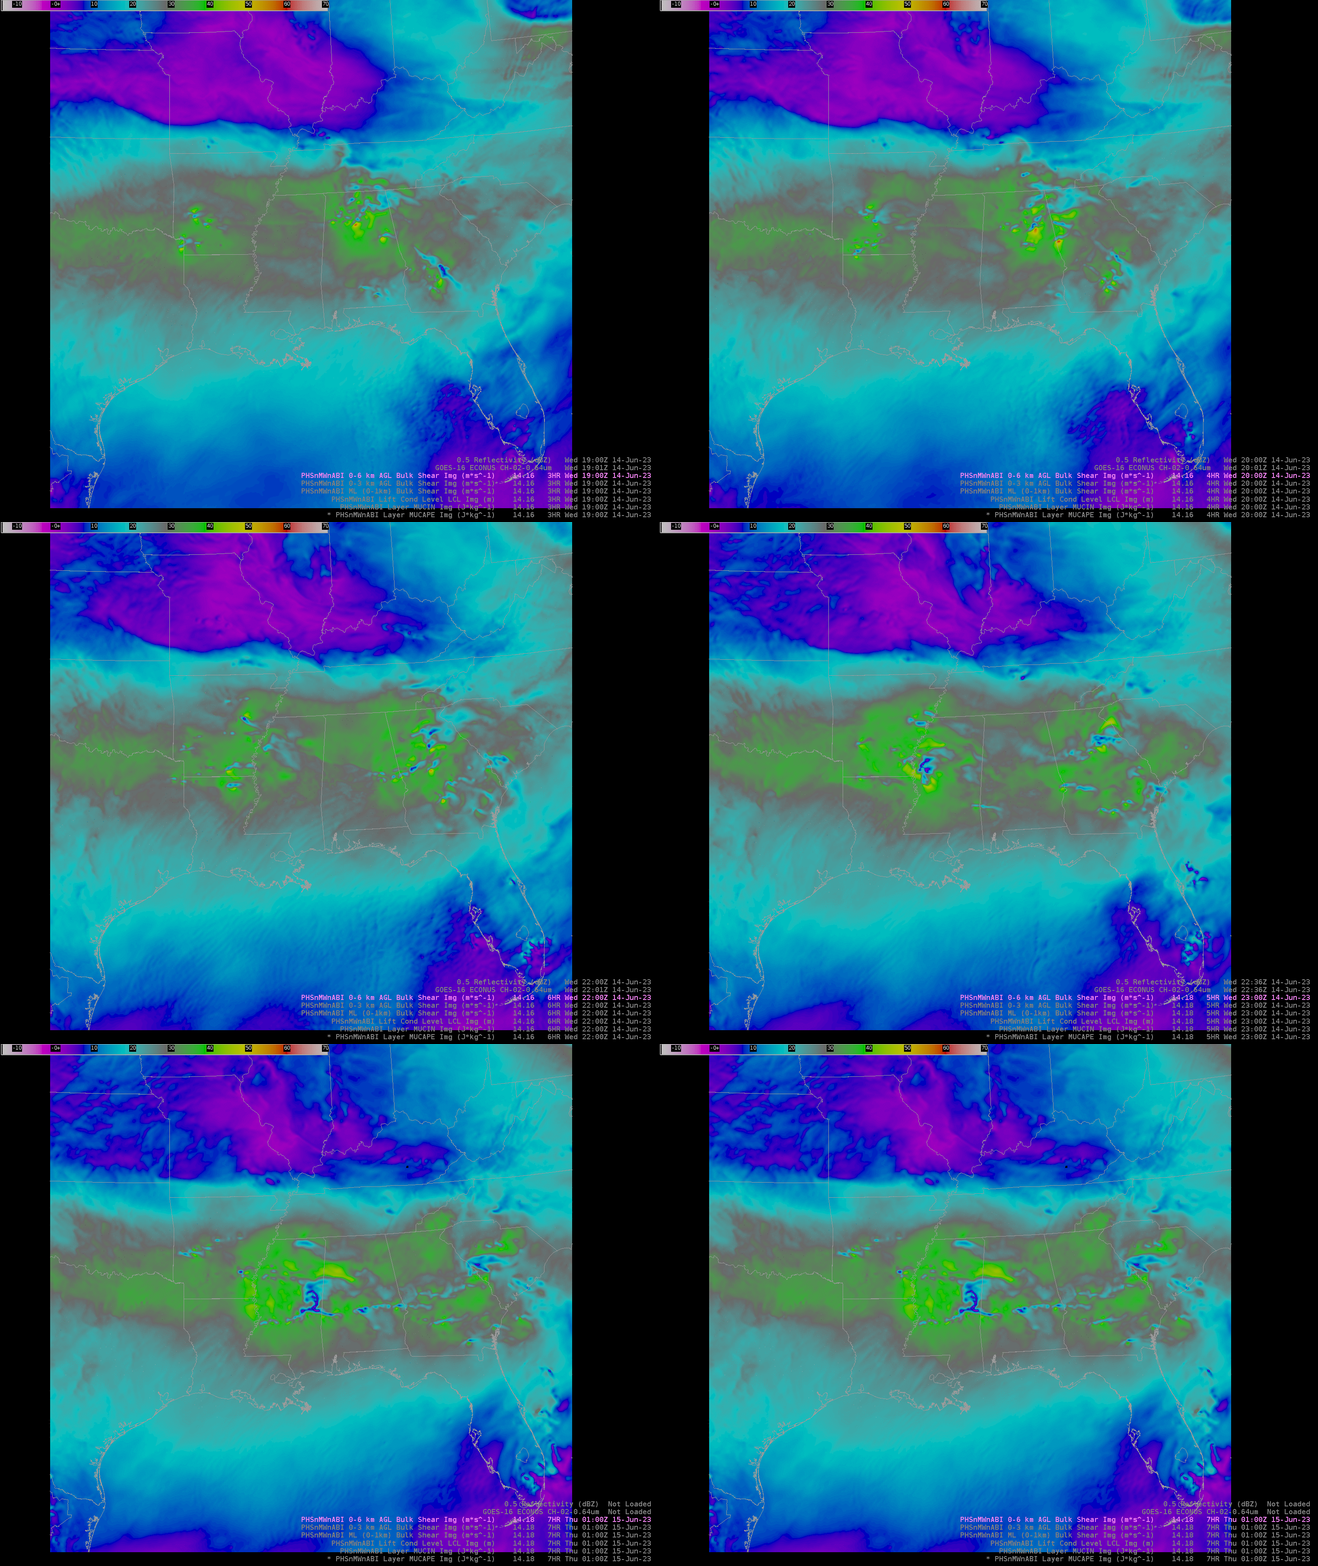
The Bulk Shear 0-6 km below shows more promise with the 19Z  frame showing a boundary where the training severe storms formed/tracked (what did it look like at 16Z or 17Z?). I would need to see more of this pre convection to really make a judgment, and would need to see positive validation/verification to have any confidence in it as a tool.

- Super Bolt

SHV Feedback for 6/14 and some feedback from LZK CWA


NUCAPS

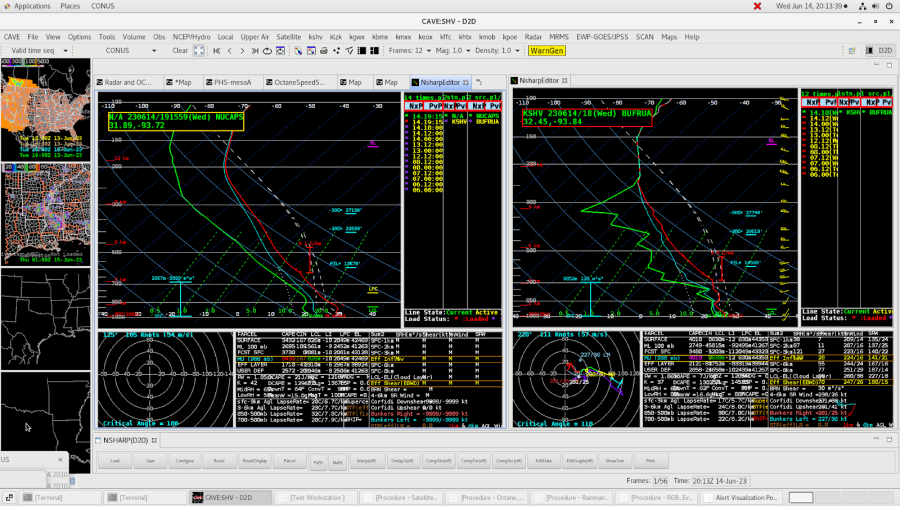
Noticed the SHV special sounding was very similar to the NUCAPS sounding done an hour later.  NUCAPS on the left and SHV on the right.  The surface and near surface environment did not match as well.

OCTANE

Neat to see OCTANE highlight the taller clouds that are developing behind the main storm activity over the western CWA.  Lightning Cast started highlighting this area too for a lightning threat.

Very nice divergent signature on the updraft.  However, the 80 kts of divergence seems underdone given the MESH of 1.51”.  I know the speeds are dependent on the environmental winds, but just seemed odd given the hail potential.  Calibration would be helpful to help determine the hail size potential based on updraft divergence.

OCTANE captured two updrafts from a splitting storm over LZK’s CWA.  This helped to see the potential split earlier than when viewable on Radar.

Here is when OCTANE first denoted the split vs. what radar had at the same time.

PHS

Handled the storm location and timing rather well at the start of the exercise for SHV.

Noticed for the LZK CWA PHS was about 2-3 hours early with the storm activity, but had the location correct.  Radar image at 21z, PHS image at 19z

- Rainman

Convection filling in

Our forecasters have begun the day in Shreveport, LA, Jackson, MS, and Birmingham, AL. A PDS-severe watch has been issued for Jackson's entire CWA. In Figure 1, you can see ProbSevere LightningCast capture the developing convection as it "fills in" between more mature storms. With forecasters concerned with severe, tornadic, and lightning threats (for DSS), LightningCast can help forecasters quickly discern new areas of concern.

Figure 1: LightningCast contours, GOES-16 ABI daytime cloud phase distinction RGB (background) and GOES-16 GLM flash-extent density (orange-yellow foreground).

Tornadic Panhandle storm emblematic of the differences between ProbTor v3 and v2

A powerful storm that saw it's genesis in northeast New Mexico and it's demise in south-central Oklahoma, spanned nearly 11 hours. It produced tornado reports near the Oklahoma-Texas border in the Panhandle region, as well as numerous gigantic hail (5" diameter) and wind reports (up to 75 mph) (Figure 1).

Figure 1: ProbSevere v3 contours (outer contour is colored by ProbTor v3), MRMS MergedReflectivity, and NWS severe weather warnings for a supercell in the OK/TX Panhandles.

This storm clearly demonstrates some important differences between ProbTor version 3 (PTv3) and version 2 (PTv2). Early on in the storm's lifecycle, PTv3 was much greater than PTv2. At 21:24 UTC (see Figure 2), PTv3 = 34%, vs. PTv2 = 1%. The first tornado report was at 21:51 UTC, when PTv2 finally increased to 14% (PTv2 later increased to about 70%). Looking into this further, we found several things contributing to the elevated PTv3 and much diminished PTv2:
  • In PTv2, which uses RAP, the SRH 0-1 km AGL was only 50 m2/s2, vs. 100 m2/s2 in the HRRR, which PTv3 utilizes.
  • Similarly, PTv2 strongly relies on the mean wind in the 1-3 km AGL layer, which was only 16 kt. This also was dampening the PTv3 probability.
  • The 0-2 km azimuthal shear (i.e., low-level storm rotation) was modest. This was not enough to overcome the poor low-level kinematics in PTv2 (until much later), while at the same time, it was not too harsh on PTv3.
  • The top contributing predictors for PTv3 were the 0-2 km azimuthal shear, the effective bulk shear (~ 65 kt), the very high MESH (3.43") and surprisingly, a strong low-level laspe rate (8.8 C/km). 

Figure 2: ProbSevere v3 contours (outer contour is colored by ProbTor v3), MRMS MergedReflectivity, and NWS severe weather warnings for the tornadic supercell. Note that PTv3 is 34% here, while PTv2 was only 1%. 

Later on, as the azimuthal shear went off the charts (see Figure 3), PTv2 was much higher than PTv3, but also much more erratic. PTv3 consistently remained in the 30-40% range for awhile, despite very high azshear. This indicates that the PTv3 model has learned that azshear can be quite noisy (due to things such as radar sidelobe contamination), and it learned not to overemphasize the radar-based rotation predictors.

The PTv3 model correctly ramped up probabilities to 30-35% when rotation increased in a decent environment (from about 20:20 to 21:00 UTC), but hedged when rotation (as observed by MRMS azshear) was very high, as evidenced by probabilities below 40%. As of now, there were no other tornado reports after 22 UTC, so this seems like a sensible hedge (the storm was tornado-warned until 02:15 UTC).

In practice, we hope that forecasters find value in earlier ramp-ups in the probability of tornado, while understanding the uncertainty of using scalar-based predictors leads to lower probabilities overall, compared to PTv2 (and fewer erratic swings). We hope that using image-based methods will improve the guidance even further. 

Interactive version of the plots in Figure 3. 

Figure 3: Time series of PSv2 and PSv3 probabilities and certain predictors for this storm.


Tuesday, June 13, 2023

OCTANE's Ability to Assess Areas of Lift In Strongly Sheared Environments


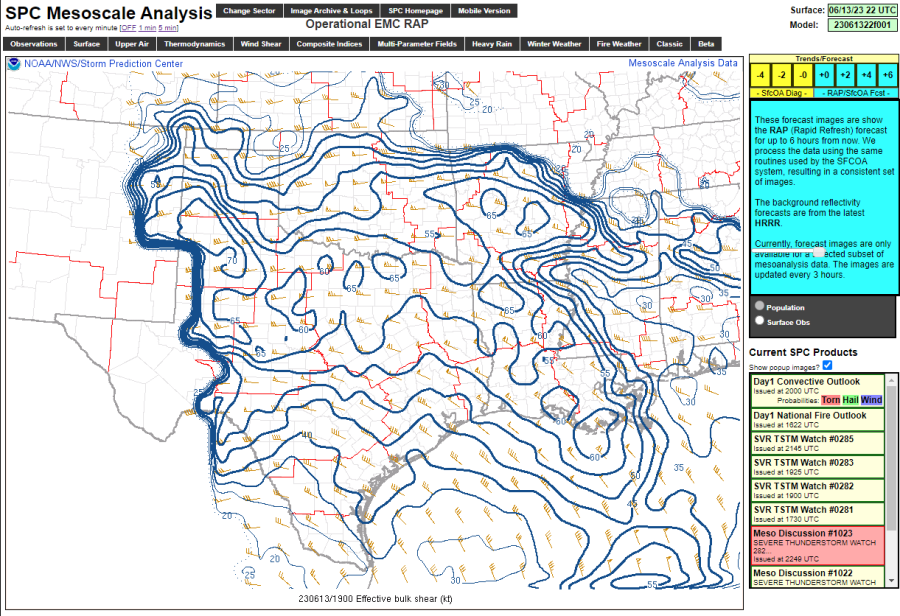
Over northeastern Texas during the afternoon of June 13, 2023, an area of isentropic lift was contributing in the development of robust, severe convection over the ArkLaTex region within a highly sheared environment.

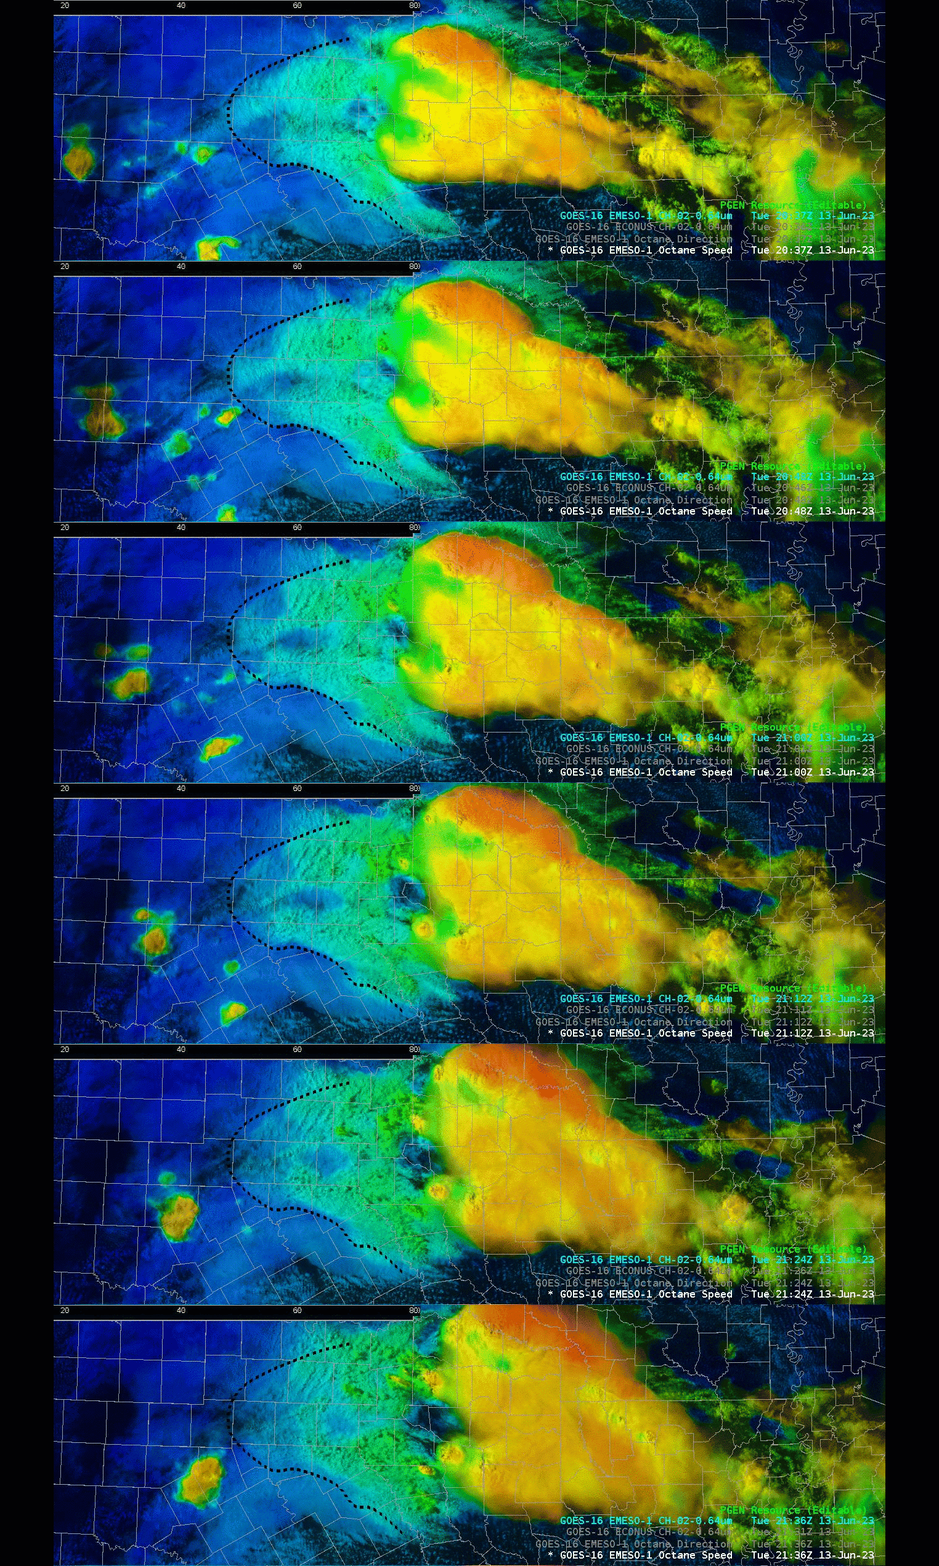
When Looking at the OCTANE Speed Sandwich, a notable gradient in color between darker blue and cyan/green can be seen within widespread stratus over northeasternl TX. This  delineated agitated stratoCu in cyan/green from flatter, more uniform stratoCu darker blue. The color change acquired by the agitated stratoCu was thought to be a result of the satellite product’s ability to detect relatively faster cloud motions of the agitated stratoCu as it grew vertically into a faster wind regime. This made it easy to find where lift was locally higher (in this case isentropic lift via low level WAA overrunning a surface boundary).

Identifying and tracking the area of lift was helpful in assessing the potential for additional convection to blossom downstream, sparking the seeds for eventual robust convection in a highly sheared environment.

Animating a loop of images, one could even see how this area of lift was propagating. Notice the subtle trend area of relatively warmer colors (cyan to green) propagating slowly to the north and east of the annotated line. Tracking the delineating line as well as the overall zone of lift itself as it moves over time could help increase a forecaster’s confidence on whether additional convection associated with this forcing mechanism would remain possible or become unlikely, proving OCTANE can be a useful tool in the Mesoanalyst’s tool belt.

Comparing OCTANE Speed Sandwich to the popular Day Cloud Phase RGB, OCTANE appeared to highlight the area of lift more easily than Day Cloud Phase RGB, and to a relatively high degree of spatial detail.

-OSMBLSN