Tuesday, May 6, 2025

Houston CWA May 6th event.

 Started out issuing a warning for parts of northwest Houston’s area based on info from the Flash density product.

3:06 PM. Using Octane, noticing a cluster of convection that is developing and becoming more interesting for warning purposes.

3:38 PM Severe Tstorm with tornado warning out. Special feature noted on Octane Speed Product where the updraft was reisting ambient wind flow as the storm intensified noted by cyan colors on LA/TX state line near Shreveport.

-Jolly Rogers

Web based LightningCast for a DSS event

 My office’s internet went down hard for the entire day, so I had to utilize a mobile hot spot. AWIPS in the cloud was very sluggish and unusable on the mobile hotspot so I opted to only utilize the web based tools for today.

With a focus on the Brisket Appreciation Society Annual Bash in Beaumont, TX, storms started to emerge to the west and southwest of the event around 2 PM. I found the DSS dashboard useful when monitoring the specific location, but I wanted to use the LightningCast map as well for overall situational awareness. It was a little difficult for me to find exactly where the location was, so it would be useful for the map to have a dynamic layer for the DSS events.

I created a public graphic around the time lightning started near the to move closer to the DSS event. I generally utilized radar and LightningCast dashboard for the DSS event for the messaging. I did not include an image of the LightningCast for the graphic because it was already above 80% when I created the image. Because of this, there was very high confidence that lightning would occur, with the goal of the graphic to inform people of the approaching storms and the associated hazards.

LightningCast (both v1 and v2) stayed very high during the entirety of the event. When looking at the DSS dashboard, the probabilities within for the event increased to >80% 30 minutes before lightning was within a 10 mile radius of the event. There was an issue with the 1 minute data that caused that dip to 0. However, the 1 minute data is very noisy, and in this case, is not an improvement when compared to the 5 minute data.

- Golden Retriever Lover

Monday, May 5, 2025

LightningCast v1 vs LightningCast v2 5/5/25 21:26Z-22:21Z

 The cell I was observing was producing infrequent lightning for much of the period in the loop with probabilities in v2 staying consistently higher than v1 before and after the lightning strikes. v1 decreased to near 0% at 21:41Z right before a strike occurred at 21:56Z although the probability in v1 increased to 10% at 21:46Z. v2 probabilities remained relatively consistent during that time frame. It seemed that with the MRMS data, it had enough reason to continue the probabilities even though the lightning was infrequent. From a forecaster's perspective, this would give me more confidence that the storm was persisting and was continuously capable of producing lightning whereas v1, I might think that (if only relying on the LightningCast), the threat was diminishing.

4 panel comparing LightningCast v1 and Lightning Cast v2

-Golden Retriever Lover

LightningCast V1 & V2 Differences in ABQ

GOES-East LightningCast Version 1 seemed to pick up on lightning ahead of LightningCast Version 2 (MRMS-trained) for the cell in the southern portion of the ABQ domain (bottom-middle of screen), with higher probabilities (75% + for V1, 50%+ for V2) at 1916 UTC 05 May 2025. However, once the GLM FED detected lightning, LightningCast V2 saw a more expansive 75% contour. A theme I seemed to pick up on was that LxCast V1 would have higher lightning detection probabilities than V2 prior to initiation, but V2 would have a greater footprint of higher probabilities thereafter, more accurately capturing lightning once it was occurring. V1 probabilities seemed to fluctuate more often than V2 as well. 

LightningCast V1 and V2 output in the ABQ WFO area at 1916 UTC and 2006 UTC 05 May 2025.

-May052025

Comparison of GREMLIN, OCTANE, and Radar Products For Two Storms near KMAF

Something interesting was noted when looking at two nearby storms on 05/06 between 2146Z through about 2205Z. When looking at two thunderstorms which quickly fired up near the MAF radar, OCTANE STD data suggested the storm to the left had stronger divergence aloft. The OCTANE Speed Sandwich also showed these storms were relatively similar in strength with the right storm having slightly stronger shear, but decided to look at GREMLIN and dual-pol radar data for further analysis. It is worth noting that OCTANE data stopped coming in around 2146Z due to a power outage at CIRA. GREMLIN data clearly showed the left storm was weaker depicting much lower reflectivity. This overall aligned with MRMS data, but the GREMLIN data did smooth out higher Z values as expected. 88D radar data was then used to help investigate the two storms after seeing both OCTANE STD and GREMLIN data differ on which storm was more intense. When looking at radar data it became clear that the storm on the right was more intense with a BWER, higher cloud tops, more intense reflectivity core aloft, and stronger STD (wasn’t able to sample true STD because the storm was too close to the radar).

It was very odd to see the left storm had stronger divergence aloft in the OCTANE STD procedure yet all other data suggested the storm on the right was much more organized. There are no loops in this blog, but the weaker left storm was a left mover while the stronger thunderstorm was more of a right mover. Could this have played a role in the OCTANE STD data suggesting the left storm was more organized?


A severe thunderstorm warning was issued on the right storm before these comparisons were made as it was evident a supercell was developing. OCTANE/GREMLIN aided in quickly seeing where CI was occurring and which storms were intensifying quickly. However, using the satellite products alone to issue warnings would have been difficult. This could be due to not being familiar with what thresholds forecasters need to be looking for in OCTANE or GREMLIN in order to issue a warning. If I were in a forecast office with radar holes or beam blockage, these new satellite products would still be very helpful to interrogate storms. OCTANE/GREMLIN provided better confidence on what storms to focus on and paired well with 88D radar data for warning operations. It would be fascinating to see how this works in a location where there is beam blockage or radar holes.  

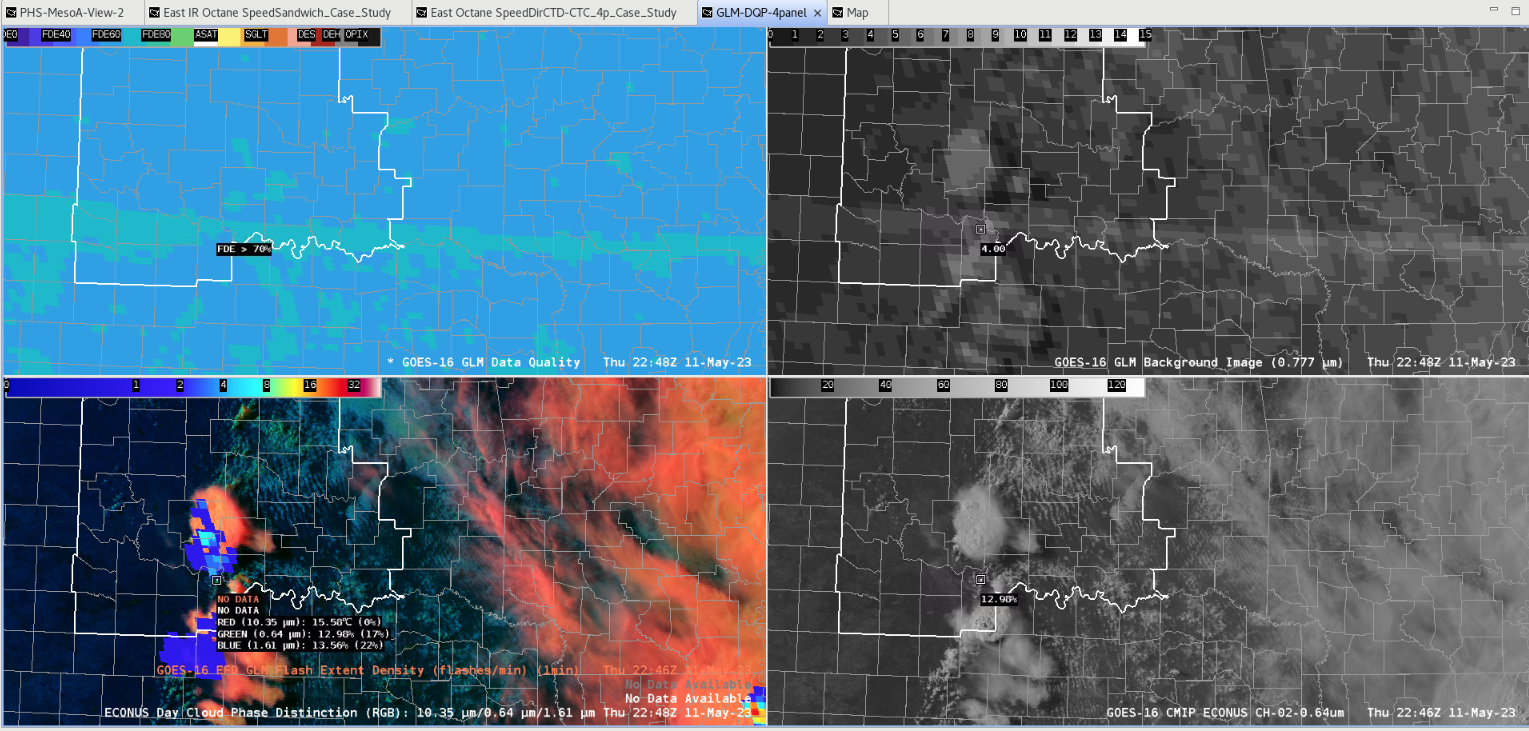
When looking at this 4 panel OCTANE STD suggests the cell on the left has stronger divergence aloft. The speed sandwich (top left) suggests the storms are relatively similar in intensity though slightly stronger shear was evident for the right storm.

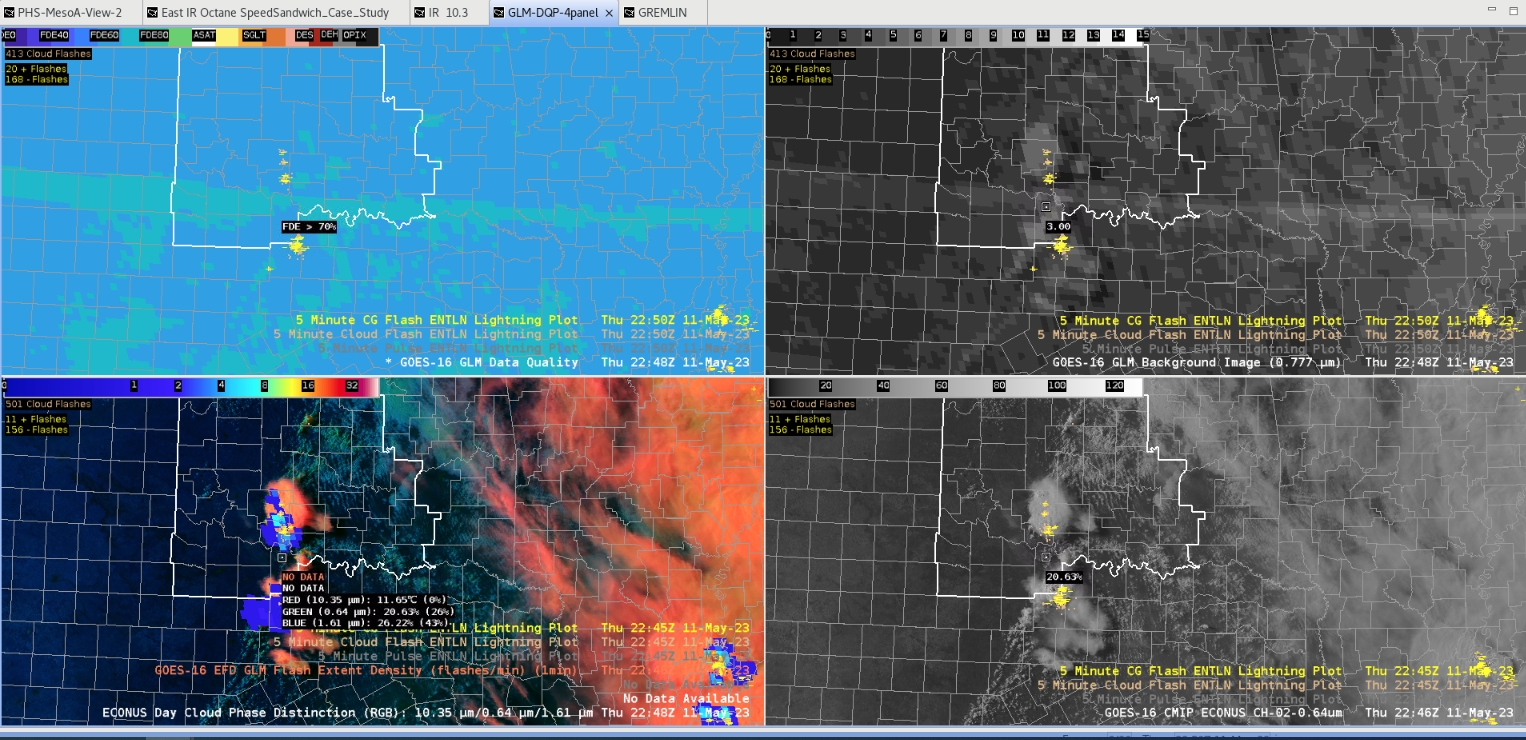
The two storms on the right are the ones of interest. Ignore the far left storm. GREMLIN data clearly shows that of the storms in question, the one on the right is more intense as reflectivity values are much higher. OCTANE data went out at 2146Z so timing between products is off slightly. GREMLIN data compare to MRMS data as both showed the storm on left being less organized. MRMS was a lot easier to read though due to less smoothing.

88D Radar data clearly shows the storm on the right is more organized with a BWER, higher cloud tops, much stronger reflectivity core aloft, and stronger STD (true STD could not be sampled as the storm was very close to the radar).

- Ricky Bobby 

First Use of GREMLIN in Warning Scenario

 My first time experimenting with GREMLIN, I was able to utilize it briefly during a warning scenario.  Using the 4-panel (Figure 1) below in conjunction with radar data (KFDX), I issued a Severe Thunderstorm Warning for 60 mph winds (Figure 2).  Other than the fact this storm previously had warnings, the velocity/SRM signature was decent (certainly no slam dunk) for straight-line winds, but the uptick in GREMLIN Meso-1 combined with the increase in cloud top cooling south of Fort Sumner. Figure 3 shows a 3 minute difference showing the rapid uptick in the GREMLIN radar emulation. The CONUS radar emulation did show it, but in a warning scenario was a bit too delayed to use with any confidence to issue a warning based on its data.  It certainly helped solidify the decision after issuing the warning.

Figure 1: East Meso Sector GREMLIN and Channel 13 (left side), MRMS composite reflectivity and East CONUS GREMLIN (right side).

Figure 2: Severe Thunderstorm Warning in southeast portion of ABQ CWA.

Figure 3: The radar emulation from East Meso-sector 1 (top left) shows a nice uptick within 3 minutes with the storm south of Fort Sumner and from the previous loop from Figure 1, it continues for several more minutes. Thus, added confidence to issue a warning by 21:21z.


- Podium

Subtle LightningCast Differences

 After the first day of using the new LightningCast, I was able to notice some subtle differences between the old version (LC1) and new version (LC2).  However, I don’t have enough information to say it will impact my operations one way or the other with the new version.  It does seem the new version is a bit more detailed and possibly slightly faster with convective initiation. For instance in Figure 1,  there was an isolated storm in west-central NM where the new LC has the 75% outlining the storm by the end of the loop and the older version does not. Also, the cluster across the northern portions of NM (or ABQ CWA), the older version seems to be too quick to end the lightning as it just has a small 75% line near the border of Colorado. The new version keeps that higher probability going much further south.  In this case, LC2 might provide slightly more lead time in IDSS as well as a bit more detail in the cessation of convection.

For the last figure, I wanted to provide a snapshot of the convection and compare the two LC versions. Northern NM again was a noticeable difference between the probabilities. For the farthest northern cell, LC2 has a much larger 75% prob area while the 25/50 probs are fairly similar to LC1. LC2 suggests there might be lightning between the two areas of storms in northern NM as it has the 10% prob contour completely connected while the LC1 does not.  

LC1 suggests there might be a storm developing further east with a small 25% area near the CO border, while LC2 does not have anything and verifying with radar, appears there were only a few showers in that location. It is interesting to note the two 50% areas on the two separate storms in the southeast suggested by LC1 while LC2 keeps the contours together. And judging by the FED data, LC1 is probably more correct in this snapshot.   There are a couple other differences within that snapshot, but not entirely sure these differences would make much of an impact on a warning/IDSS scenario.

Figure 1: LightningCast and Flash Extent Density at the beginning of convection on May 5, 2025.


Figure 2: Captured a few hours in the southeast section of ABQ county warning area. A few subtle differences, but nothing notable that would change operational thinking.


Figure 3: At 20:26z, the most notable difference between the two versions is with the storm across northern NM and a minor difference with the storms in the southeast portion of ABQ county warning area.  


- Podium

Thursday, April 24, 2025

Lightning cessation

Lightning cessation typically occurs when a storm decays to the point of no longer producing lightning. It is indicative of a weakened updraft. This is an important event for forecasters to predict well, as event managers and other users need good guidance on when they can expect a lightning threat to be over.

LightningCast predicts the probability of lightning in the next hour, including before first-flash events in storms, and for lightning cessation. LightningCast v1 uses solely ABI inputs. This sometimes makes it difficult to discern lightning cessation, particularly when the reflective bands are not present (or strongly illuminated) and when there is thick ice present with a "smooth" look at cloud-top, which often is the case when storms decay, leaving an anvil cloud.

The animation below demonstrates LightningCast v2 (on the left) vs. LightningCast v1 (on the right). LightningCast v2 incorporates the MRMS Reflectivity -10C as a predictor at 1-km resolution. This helps the LCv2 to "see" the diminishing lightning signal sooner than in LCv1, due to a collapsing updraft and reflectivity core, which often precedes warming cloud tops in satellite imagery.

LCv2 (left) reduces lightning probabilities for the storm on the Oklahoma/Kansas border much more rapidly than LCv1 (right).


Toggling of LCv1 vs. LCv2 at 11:46 UTC helps us see the false-alarm-area reduction in south-central Kansas for LCv2. Predicting lightning cessation is one important scenario where we feel that LCv2 improves upon LCv1.


Tuesday, April 1, 2025

LightningCast v1 vs v2

ProbSevere LightningCast v2 adds a new predictor---MRMS Reflectivity -10C. This predictor has been well documented to correspond to electrification in storms, as it observes water particles in the mixed-phase region, where charge separation begins. We use it in LightningCast v2 at approximately 1-km resolution, along with the GOES-R ABI 0.64 µm reflectance (C02, 0.5 km), 1.6 µm reflectance (C05, 1 km), 10.3 µm brightness temperature (C13, 2 km), and 12.3 µm brightness temperature (C15, 2 km).

In the example below, LCv2 is on the bottom left, LCv1 is on the bottom right, and the MRMS Ref. -10C is on top. You can see that there is lightning (as detected from GLM) in a mid-level cloud deck, but obscured by some high-level ice. LCv1 drops probabilities < 10% at numerous times in the animation, due to the uncertain signal from the relatively smooth but not overly cold cloud tops. On the other hand, LCv2 picks up on the re-developing convective cores, as shown in the Ref. -10C pockets of ≥ 35 dBZ (yellow-orange), and correctly maintains a higher probability of lightning throughout the animation.

This is one way in which LCv2 is an improvement over LCv1---in convection that is obscured by moderate-to-thick ice. We've also seen improvement for lightning cessation situations and more "marginal" situations such as for lightning in low-topped convection.


Thursday, June 6, 2024

USING THE GLM BACKGROUND & DATA QUALITY PRODUCT (DQP)

Here is an inspection of the GLM Background and DQP to get a feel for the reliability of the GLM flash extent density (FED) data.  Below you will notice a four panel display with GLM quality on the upper left, the GLM background image on the upper right, the GLM flash extent density on the bottom left, and the 0.64 visible satellite imagery on the bottom right.

You should be able to make out a sub-array boundary going horizontally (upper left panel) AND also in the GLM background image (upper right panel). In the top right and both bottom panels you can make out strong convection taking place with two cells (one in the southern portion of the CWA, and one just to the south and along the CWA border). I did my best to put my AWIPS cursor along the sub array boundary.  You will notice in the bottom right corner that the cursor is actually between the two convective cells.  However, you can make out some weaker GLM FED signals along the sub array boundary where you are in-between the two cells.  This demonstrates uncertainty around the validity of the GLM data just to the south of the northern convective cell.  They are weaker GLM FED returns with only a minute or so of lag among the various elements being shown. And with these returns being upshear of the northern cell it is likely that this is not related to anvil lightning activity.  In this example with the relatively close proximity of the two cells one cannot be sure that the GLM data is incorrect, but with the GLM returns showing up on the sub array boundary this does increase uncertainty around this portion of the GLM flash extent density data.

Below is the same four panel, but with the ground based earth lightning detection network showing as verification for lightning.

Notice how there is a weaker return with the GLM flash extent density on the southern portion of the northern cell, but the detection (lower right panel displays best) shows the lightning verification within the convective cloud shield and not past the southern portion of the northern cell like in the GLM FED (bottom left panel).  This demonstrates that one should question a portion of the GLM flash extent density output. By using the GLM data quality and background products one can get a better feel for where the GLM FED data may not be reliable.  If something doesn’t make sense with regard to GLM output then this product can verify that suspicion.

- 5454wx