Tuesday, May 21, 2024

Getting ramped up

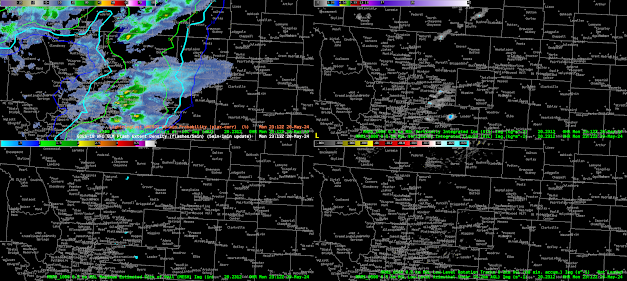
Our forecasters are working in Kansas City and Des Moines today. Storms are already rolling in eastern Nebraska, with ProbSevere LightningCast is picking up on the southward development of storms to the Kansas border.


Forecasters are evaluating the utility of lightning dashboards, available at static locations (airports, stadiums) and on-demand locations, for decision-support services. The on-demand capability is automated via a google form.

Below shows an example panel of the lightning dashboard for an airport in St. Joseph, Missouri. The lines are time series of LightningCast probabilities for the CONUS (5-min) and mesoscale (1-min) sectors, and the blue points are GLM flash centroid observations.


Tracking Convective Development With OCTANE storm top divergence and LightningCast


Developing convection along a surface front in eastern Kansas was producing signals in the OCTANE storm top divergence product, signs of glaciation, in the day cloud phase product, and increasing LightningCast probabilities. Along northern areas of the surface boundary, the divergence product and visible characteristics were stronger, while updrafts further south still struggled to sustain themselves. This may be due to residual convective inhibition evident on MCI ACARS soundings. Even about 20 minutes after these screen shots were taken, the GLM activity was fairly weak, while the storm top divergence only really showed showed up on storms near and north of the KC metro. While severe convection is still likely downstream, the OCTANE divergence product definitely highlights where better synoptic forcing is overcoming any convective inhibition. 


-Joaq

Using OCTANE to diagnose three convective environments along the Missouri border

Currently monitoring OCTANE data in the vicinity of the Missouri border at about 1850Z on Tuesday, May 24.

North of the border (far southwest Iowa) there is mature convection, with a clear signal for changes in direction and speed on the anvil (top two panes). The mature convection shows cloud top divergence, with new convection on the southern flank showing a sharp signal for cloud top cooling (bottom left).

There is an area of banded cirrus moving through the region just south of this. This cirrus shows up on day cloud phase imagery (bottom right) but also in the OCTANE speed product. Looking at satellite data qualitatively, it's clear the cumulus field is much less impressive in this area. Convection is not yet initiating here. Surface observations don't show a clear signal for a less favorable air mass, so it's possible the mid-level conditions are not as favorable.

South of all of this, we are looking at a new area of updraft initiation occurring just on the Kansas side of the border. On conventional satellite imagery we can see updrafts reaching upper levels and shearing off (orphaned anvils) indicating true convective initiation is still a little ways off, but we are getting very close. There is a consistent signal on OCTANE cloud top cooling for some of these spotty updrafts. Comparing with conventional imagery, the OCTANE cloud top cooling signals provided 5-10 minutes of lead time on the orphaned anvils. This is useful information, as once these storms begin maturing, they may provide a little more lead time on the initiation of lightning in addition to just the initiation of mature updrafts.


--Insolation

Monday, May 20, 2024

End of Day 1 Thoughts

Thoughts at the end of Day 1...

The LightningCast product I think would be VERY useful for DSS. Overall, when seeing it perform in real-time, the increasing LC probabilities seem to eventually correlate well with GLM flash density. I look forward to using the DSS form this week and seeing how that works for specific sites. 

The GREMLIN product seems to be a great way to see the overall picture of precipitation (say, for a region). I think it struggles with precipitation intensity a bit (>45 dbZ) both for storm cells and for heavy stratiform precipitation. At the "storm" level, I have seen instances of the model not following the evolution well (either too intense or not enough). 

For OCTANE, it was easier to pick out an example of CI and divergence with the IR versus the Visible products. I could use the direction product on its own in operations, but I really like having the speed, direction, and cloud top divergence all together in a 3 panel to identify convection.

PHS did a great job today identifying convective initiation when overlayed on visible satellite imagery. I look forward to seeing how this performs in other areas of the country this week.

Still learning how best to utilize the GLM DQP; but, when looking over Cuba, I was able to better understand how it locates areas where the data might not be the best. I hope to learn more about this product through the week and see more examples of its application.


Forecaster Cumulus

Waiting For Convection To Go

While looking for thunderstorm initiation, my eyes are turned towards anything that informs me whether convection will develop further or decay. There have been several things to note while waiting for instability to move into the region.

The main forecast challenge is the favorable ingredients to produce severe convection has to be advected into the region. The WRF with PHS data demonstrates that initial convection intensifies later in the day as better instability arrives across the region on the bottom right panel. This also corresponds with better dynamics noted across the others entering eastern Colorado. Model reflectivity on the bottom right increases as a result of better forcing over time. Until then, it's monitoring at what point things actually start turning the corner and using the new tools available to find that point.


And so far, the things found have been what it's not. So here are some things being observed in this period of waiting. At the beginning of the day, one of the things I noticed was related to the OCTANE detecting warming and cooling. As clouds moved off snowy foothills, it was apparent on the viewer where water clouds appeared warmer than the snow surface, and caused a pocket of cooling to appear on the eastern foothills once satellite could see the frozen snow, and warming whenever a cloud layer shifted overhead obscuring the snow. In the middle of convection, this would probably be irrelevant, but just a thing to note while we wait.


I like the idea of mashing together several products that we're testing at once. So, I've applied the LightningCast, WRF with PHS CAPE, and GLM. The idea will be to monitor how the storm is pulsing compared to with what information is provided from PHS. It'll also help track in what area LightningCast is lighting up and whether it is heading towards a favorable or unfavorable environment. With LightningCast aiming for detection within an hour, it began highlight a cell that corresponded with favorable instability. The combination of these two helped me hone in on this cell as being more likely to produce lightning than a similar LightningCast to the northwest. The 10% contour formed just before 20z, and steadily increased leading up to the first flashes on GLM roughly 30-40 minutes later. Nicely done!


While waiting, a small cell caught my eye. The area was almost completely clear, and showed very dark on visible imagery, to being cloud covered near Palmer. This made it appear this was about to blow up, but then you can see the OCTANE tool quickly reverse course once it becomes clear it will not develop and it begins to come down on visible.


Off to our west, there were a couple cells. Analyzing the tool on GREMLIN, the southern cell was less intense on GREMLIN compared to MRMS, and reversed for the storm to the north. However, neither are particularly intense, but it does indicate to keep a watchful eye and use other products like GLM to assess intensity.


As we move past 22Z and how the WRF with PHS data, it has done an excellent job forming the convection near the Denver Airport, but by Shamrock/Leader/Adena, that cell has not formed. This is creating a region of spurious data due to convective feedback. Some of the model appears to drive convection by the cold pool from this storm meeting instability advecting in from the east. It then focuses on this cell over the others, but this appears unlikely to verify at this point given how it is performing so far. By 00z, the 0-3km SRH bullseye creeps above 1600 m2/s2 moving towards Fremont. I won't put the image of the new cycle that just came in, but the bullseye got more dramatic over 2000 m2/s2. Not sure if how much those magnitudes are in the realm of possibility.


One of the interesting behaviors lately has been a few storms forming in the cold pool as we approach 23Z. There has been convection developing on the western side of decaying cells. This has me thinking about how this would look for backbuilding precipitation. Would it have this look of the cool purples remain anchored in place while reds for new convection continuously appear to upstream that rides atop the areas of divergence? The signals may not appear robust, since there may not be fast storm motions.


Looking back at LightningCast, I have noted the known limitation of the forecast trying to bridge separate pieces of convection. The gap seems quite large though, and I wonder if there may be other means to QC the LightningCast with existing radar without making it slow to process. Or we can trust that the human eye is capable of noting that radar will confirm the lack of reflectivity at -10 C or higher.


That's all I have today!

Kadic


GLM Probabilities of 10 Flashes Followed By More Intense Convection


While more intense convection has been slow to develop in southeastern, the LightningCast probability for >10fl started to increase as synoptic forcing improved. About 13 minutes later (image below), the GLM flash extent density increased to around 30 flashes per 5 minutes, which was well signaled by LightningCast. While the probability depicted by LightningCast wasn't terribly high (to around 15 percent initially), the upward trend in probability did signal the potential. 


-Joaq

PHS Forecast For Supercell in Northeast Colorado

Have been looking at PHS data and forecasts in northeastern Colorado. In simulated composite reflectivity (bottom right), there is an indication of a supercell (perhaps right-moving) tracking eastward toward the CO/NE/KS triple point. PHS indicates that this supercell will be tracking into an increasingly favorable environment, and by 02Z, it will be entering an area with much larger CAPE and a nearby local maxima in STP.


Using more traditional mesoscale analysis (such as SPC) there are indications that this forecast is sound. For example, the 6hr SPC mesoanalysis forecast (valid 04Z) shows a supercell riding the northern gradient of an STP bullseye. Knowing that it's often not the bullseye of a parameter to be concerned about, but rather the northern gradient, this has raised my interest as a forecaster.


To me, the PHS data provides additional confidence in the potential for this storm to become quite strong a few hours from now. Based on mesoanalysis, this storm could be capable of producing all hazards, with hodographs (SPC meso) and STP (both SPC meso and PHS) suggesting a tornado threat is absolutely there. I would probably use this information to start adjusting messaging, in sort of that in-between watch-and-warning paradigm.

--Insolation

LightningCast and DSS

Viewing CI and LightningCast (LC). LC probabilities on the SW portion of the storm (in the center) at 1958Z ranged between 70-75%. Just before GLM signatures pop up at 2007Z, LC probabilities jump up to around 82%. Not included in the animation, but at 1951Z, LC probabilities were around 50%. The overall trend upward would give me confidence that I can use this product to tell an emergency manager the potential for lightning is medium to high within the next 10-20 minutes (using this case, hypothetically starting at 1951Z). 

Lightning Cast product overlaid on Cloud Phase Distinction on the left and radar reflectivity on the right. 20 May 2024

Forecaster Cumulus

GREMLIN versus Radar

Overall, GREMLIN performs fairly well with the zoomed out shape of the precipitation returns compared to radar, but perhaps a bit larger extent. Picks up on a few heavier cells moreso versus heavier stratiform rain. Since the overall radar mosaic of GREMLIN looks so close to current radar, it would increase my confidence in using it for the big picture (especially if the radar data were to go out for some reason).

GREMLIN vs radar reflectivity 2010Z through 2058Z 20 May 2024

Focusing on the two cells in the west... it's interesting because it looks like GREMLIN resolves both cells fairly well initially but follows the evolution of the southern cell for a time a bit better than the northern cell. In this instance, I couldn't say much about confidence (sort of cancels out). But, it would be important to make sure to take into account the environment and also maybe use multiple tools in addition to GREMLIN to help with confidence.

Zoomed in GREMLIN vs radar reflectivity 2010Z through 2058Z 20 May 2024

Forecaster Cumulus


OCTANE Speed Assignments in Montana

An area of thunderstorms over southern Montana was examined using OCTANE and other satellite imagery.

Of interest in particular is the storm over western Big Horn County. The day cloud phase loop (bottom right) shows that this is a slow-moving thunderstorm, but there is also a bunch of patchy/streaky high cirrus moving much faster over top of it. Looking at the OCTANE speed sandwich (top left), it appears that the convective updraft was assigned the speed of the faster cirrus (yellow/orange, ~80kts). In reality, this updraft is moving much slower. For the sake of comparison and verification, notice the two updrafts over Stillwater County. These updrafts appear similar in nature based on the day cloud phase imagery, but the Stillwater County storms do not have any high cirrus contaminating the signal. As such, they are assigned a proper velocity on the OCTANE speed sandwich (green, ~30kts). There are also some artifacts in the divergence (bottom left) with the Big Horn County storm.

--Insolation