Monday, May 20, 2024

OCTANE Speed Assignments in Montana

An area of thunderstorms over southern Montana was examined using OCTANE and other satellite imagery.

Of interest in particular is the storm over western Big Horn County. The day cloud phase loop (bottom right) shows that this is a slow-moving thunderstorm, but there is also a bunch of patchy/streaky high cirrus moving much faster over top of it. Looking at the OCTANE speed sandwich (top left), it appears that the convective updraft was assigned the speed of the faster cirrus (yellow/orange, ~80kts). In reality, this updraft is moving much slower. For the sake of comparison and verification, notice the two updrafts over Stillwater County. These updrafts appear similar in nature based on the day cloud phase imagery, but the Stillwater County storms do not have any high cirrus contaminating the signal. As such, they are assigned a proper velocity on the OCTANE speed sandwich (green, ~30kts). There are also some artifacts in the divergence (bottom left) with the Big Horn County storm.

--Insolation

Using PHS to analyze an area of surface based convective potential


The potential for surface based convection will be important for the severe weather coverage in the CYS CWA this afternoon/evening. The 19Z PHS model is forecasting a northwesterly push of instability which is depicted above in the left panel moving into the far southwest counties of the CWA. To the north of that instability axis the PHS is depicting still elevated convection that is going on this afternoon. Additionally it is depicting surface based convection in northern Colorado, which may impact the moisture feed further north into the CYS CWA. I would highlight the far southeastern portion of the CYS CWA for a severe thunderstorm potential in my DSS/public messaging, with more uncertainty further north. 


-Joaq

OCTANE - IR Example of CI and Divergence

Found an example showing the application of OCTANE using IR - convective initiation and eventually divergence. Can see this in the color differences in the speed (NE) and direction (NW/SE) IR panels in the top left and top right in the image below, but also the cloud top divergence panel (bottom left). Could use the products alone (especially the direction panel), but I like seeing all three together to have the whole picture.

OCTANE (from AWIPS) using IR showing CI and divergence (20 May 2024)

Forecaster Cumulus

Identifying potentially stronger thunderstorms with IR OCTANE divergence and LightningCast


Displayed here are OCTANE products built from both visible (right panel) and IR (left panel). What caught my eye is the characteristic of the OCTANE direction in the IR panel, where directional divergence is showing up much more clearly than in the visible OCTANE product. This is especially showing up in the northern set of storms, where LightningCast is also highlighting for a probability of >10 flashes in the next 60 minutes (shown below). These both highlight an area with a higher probability for more intense convection in the near-term.  

-Joaq

Learning the Ropes - GLM DQP Applications!

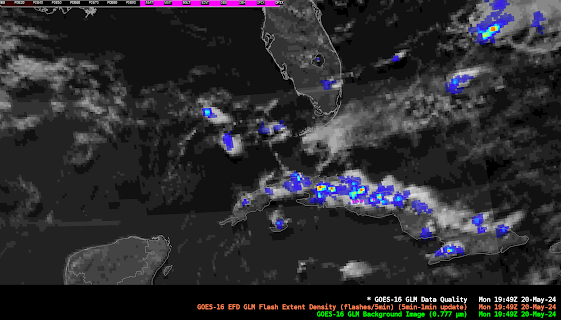
GLM DQP: learning about its application - where data might be suspect or questionable. Where convection/GLM is along the line/boundaries could be such areas. Although not in Cheyenne's CWA, saw an example over Cuba of pink pixels (at or near saturation), but could see lightning detection around it. This was an area near one of the boundaries (pink pixels were right along the line). 

GLM DQP 1949Z over Cuba 20 May 2024 - pink (at or near saturation) pixels along boundary line

Forecaster Cumulus

GLM Glint in South America / Panama

A glint was observed on various data sources tracking westward across northern South America and Panama between about 1630Z and 2000Z on May 24.

The glint is plainly evident on visible imagery (bottom right) and GLM Background (top right). On the GLM Data Quality, you can witness pixels that reach saturation over South America (directly related to the glint) -- but there is also an area of convection that gets to near saturation over Panama. It appears that the most direct sun angle roughly coincides with the mature phase of these thunderstorms over Panama, leading to a period of near-saturation that eventually fades as the convection weakens. Convection can be confirmed by the presence of GLM flashes, but there does appear to be a relative min in GLM flash detections coincident with the near-saturation area.


--Insolation

IntenseStormNet in Kansas and Oklahoma

ProbSevere IntenseStormNet is not being evaluated at HWT this week, but it is a unique application of satellite data for severe weather. On the eve of the 2nd week of the 2024 HWT, severe storms were ravaging the Plains.

IntenseStormNet is an AI model that uses patterns in ABI and GLM image data to predict a probability of "intense" convection. The strongest probabilities are often correlated with strong overshooting tops, bubbly texture in the visible band, storm-top divergence, and lightning cores.


In the movie above, you can see several MCSs traversing the state, producing severe hail, wind, and tornado reports. One the convection becomes cold-pool driven, the probabilities often diminish, sometimes significantly (see eastern Kansas at the end of the period).


Meanwhile in Oklahoma, a monster supercell progressed steadily through the western half of the state, dropping tornadoes, hail, and producing severe wind gusts. One interesting aspect about the product was the drop in probabilities from about 01:40 - 02:10 UTC. This drop corresponded to a short gap in severe weather reports produced by the supercell. Visually, the main overshooting top appeared to diminish.

IntenseStormNet is used in ProbSevere v3, feeding in satellite information at the mature stage to the severe-weather models.

Terraced SBCIN PHS Product in SW Kansas

At 22Z (5hr forecast) the PHS SBCIN product was showing a terraced appearance in SW Kansas. Maximum values were above 350, dropping to around 100 (blue/purple) a couple counties to the north. Between the two, there is the appearance that SBCIN decreases then increases again. Wanted to document this to see if there is a known cause for this appearance in the PHS data.


--Insolation


PHS and Convective Initiation versus Visible Satellite Imagery

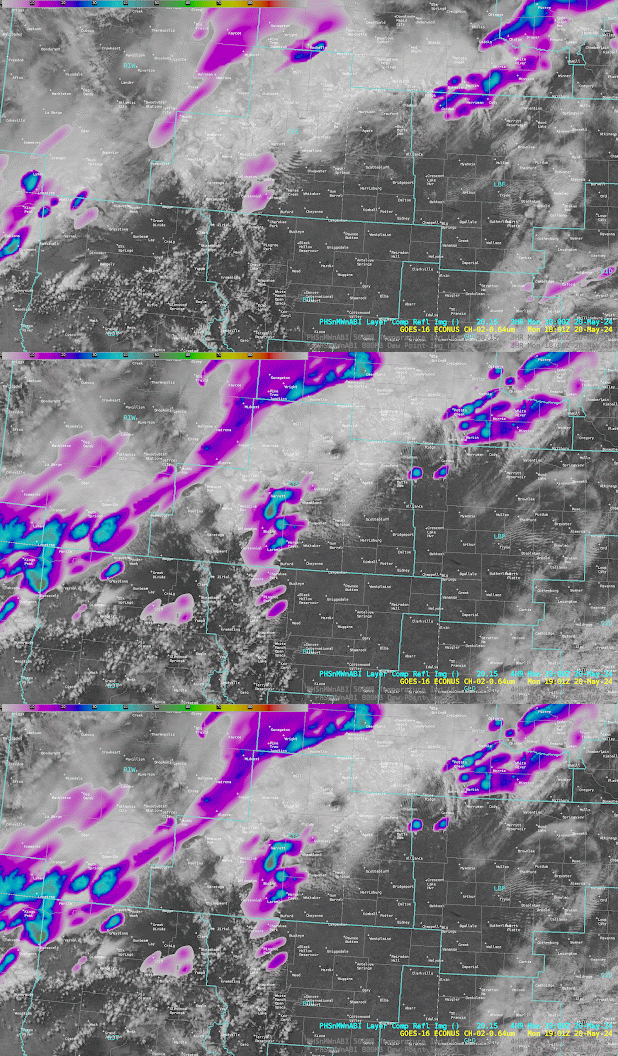
Looking at PHS overlayed on the visible satellite imagery with regards to convective initiation - PHS lines up with satellite from Garrett (CYS) to Pingree Park (BOU) especially by 19Z, but does show the beginnings of CI at 18Z as well. 


GOES Visible and PHS Composite Reflectivity 18-19Z 20 May 2024

Forecaster Cumulus

OCTANE Signal With New Convection Near Chicago

At 1910Z on May 20, OCTANE picked up a good signal on convection developing just northwest of Chicago, IL. On the Speed Direction product, there was a well-defined difference in direction vector on the southeast flank of the anvil (250deg) versus the western flank of the anvil (200deg).


There is also a subtle signal on the OCTANE speed sandwich product, though not as pronounced. Regardless, for a fresh storm just reaching severe levels, it was worth noting.


--Insolation