Wednesday, June 14, 2023

SHV Feedback for 6/14 and some feedback from LZK CWA


NUCAPS

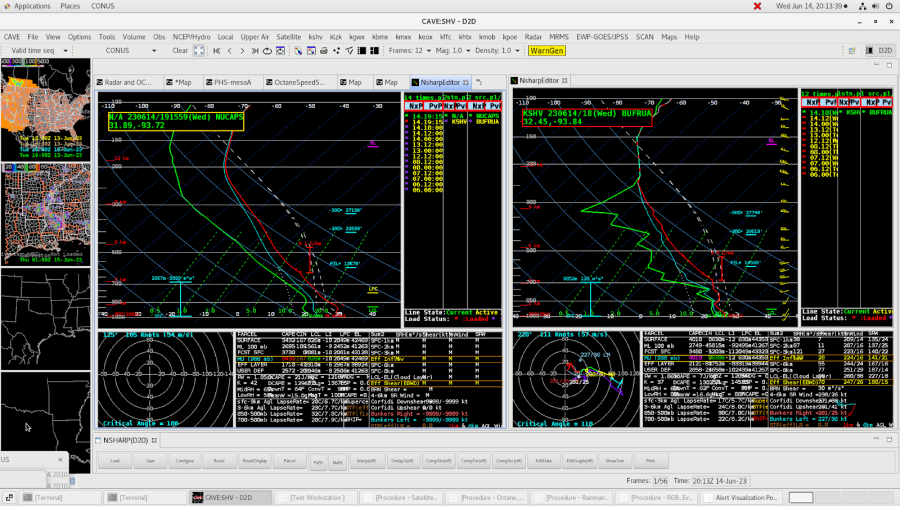
Noticed the SHV special sounding was very similar to the NUCAPS sounding done an hour later.  NUCAPS on the left and SHV on the right.  The surface and near surface environment did not match as well.

OCTANE

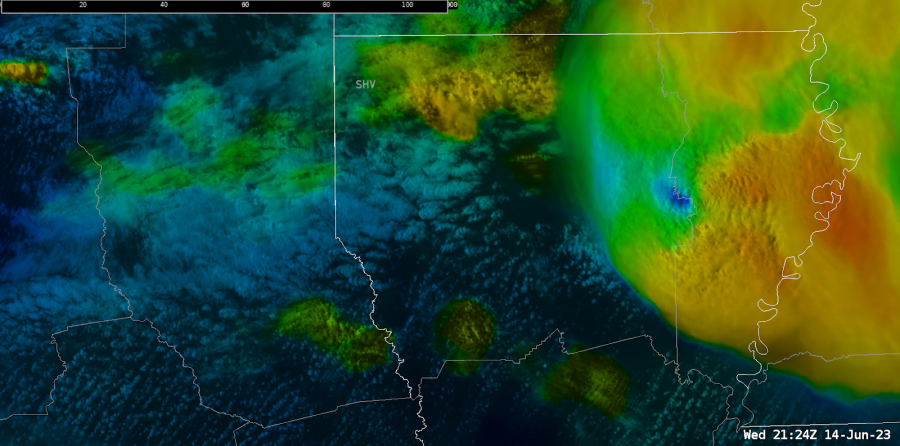
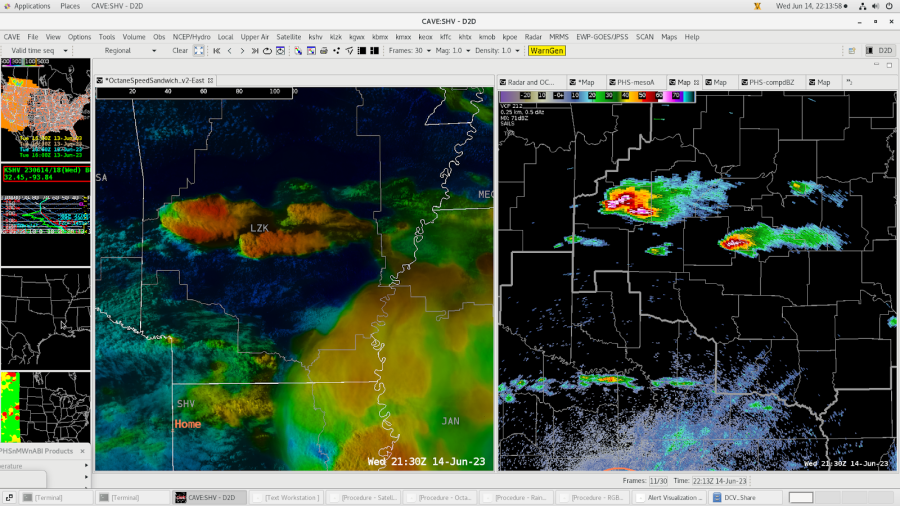
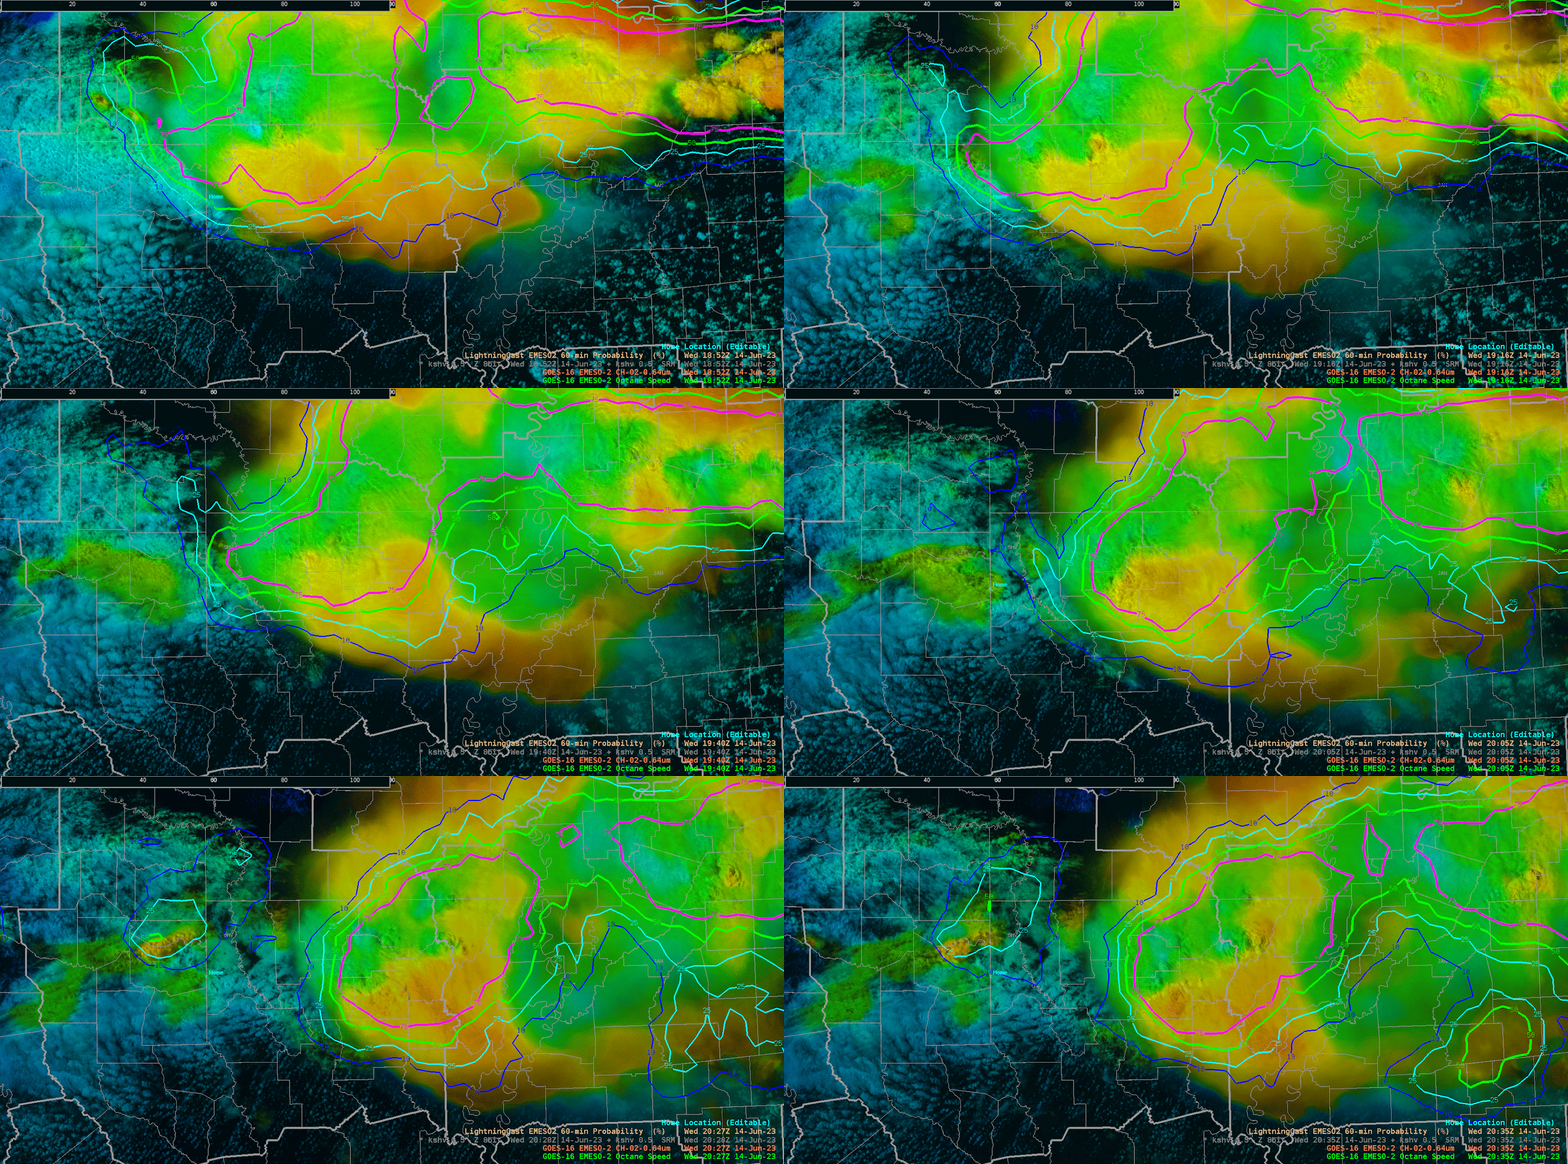
Neat to see OCTANE highlight the taller clouds that are developing behind the main storm activity over the western CWA.  Lightning Cast started highlighting this area too for a lightning threat.

Very nice divergent signature on the updraft.  However, the 80 kts of divergence seems underdone given the MESH of 1.51”.  I know the speeds are dependent on the environmental winds, but just seemed odd given the hail potential.  Calibration would be helpful to help determine the hail size potential based on updraft divergence.

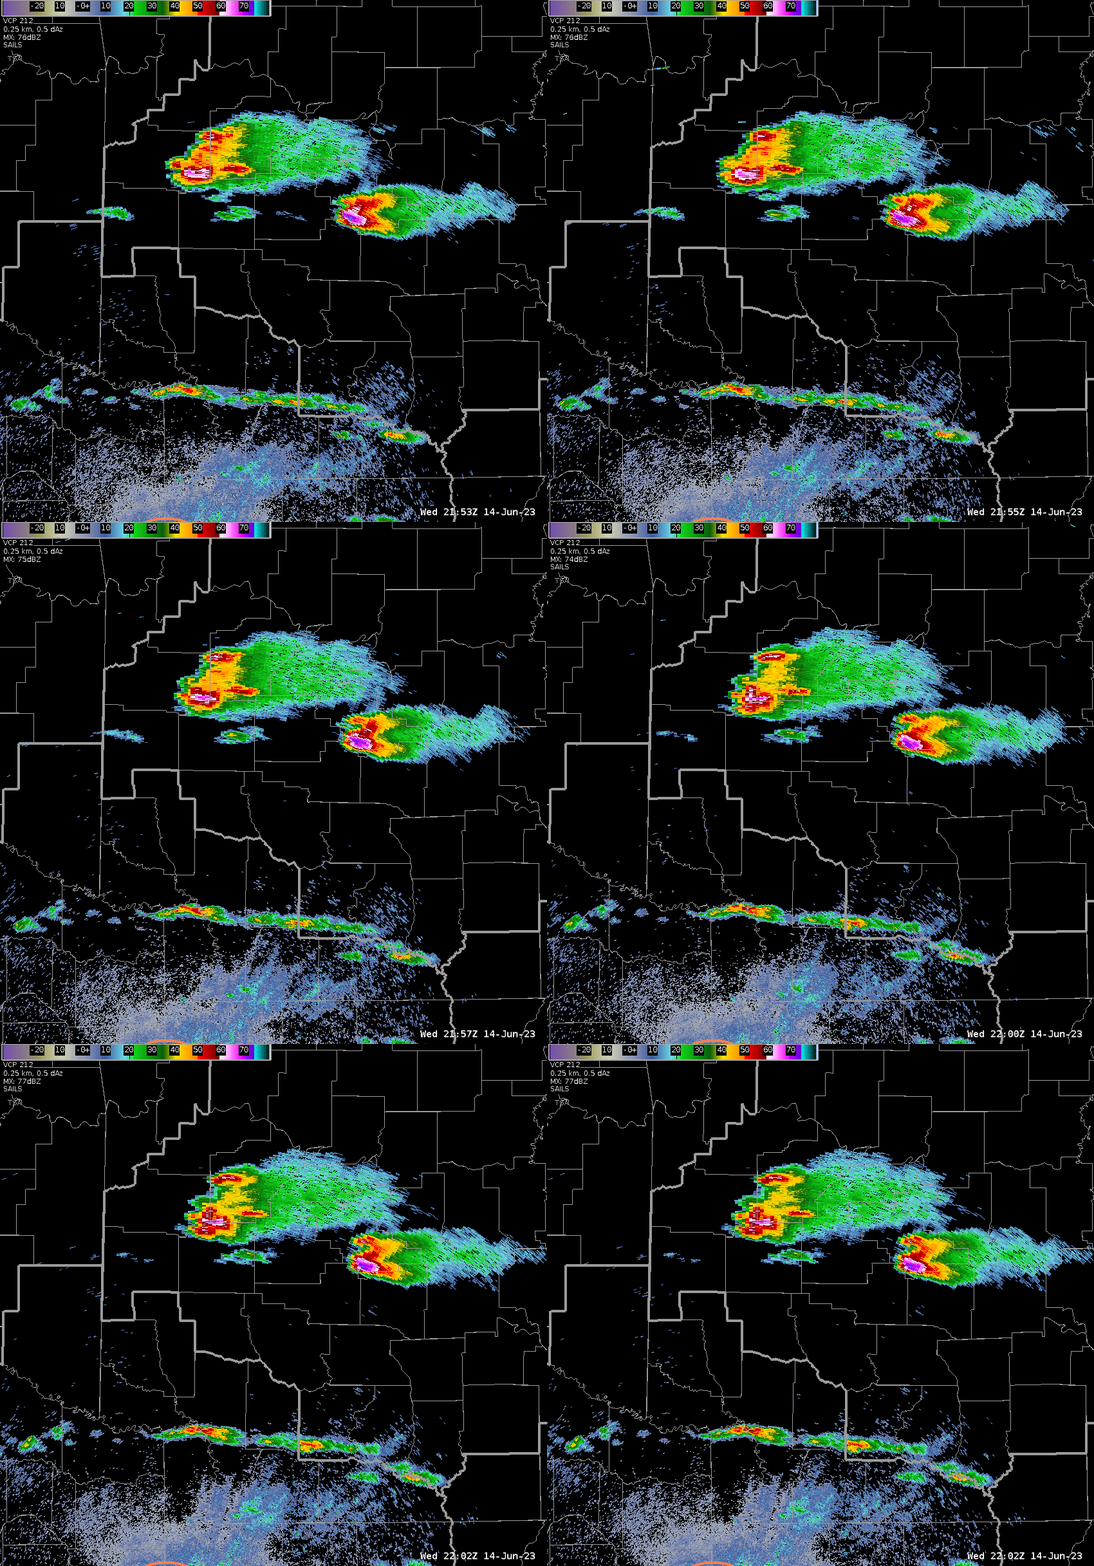
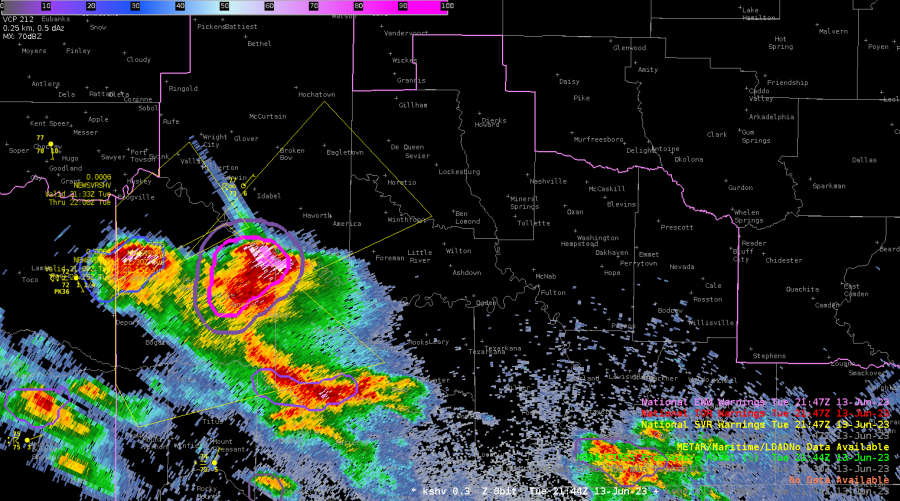
OCTANE captured two updrafts from a splitting storm over LZK’s CWA.  This helped to see the potential split earlier than when viewable on Radar.

Here is when OCTANE first denoted the split vs. what radar had at the same time.

PHS

Handled the storm location and timing rather well at the start of the exercise for SHV.

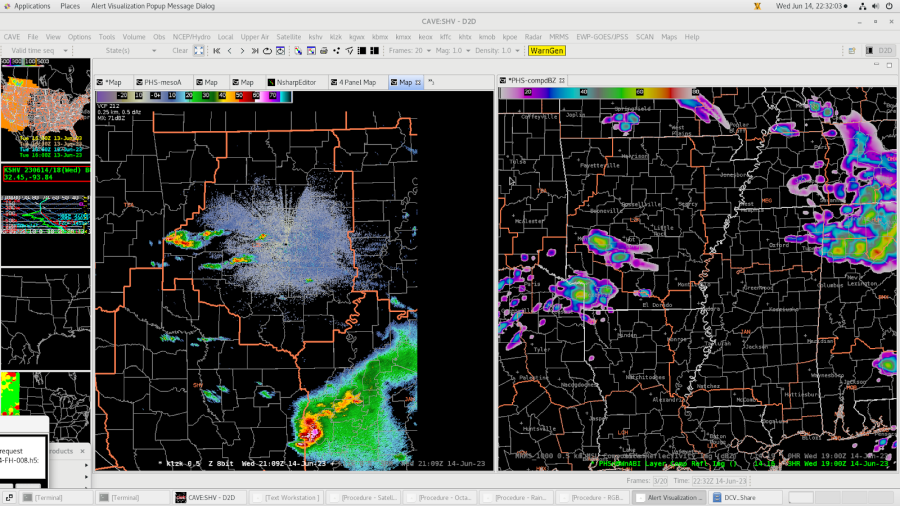
Noticed for the LZK CWA PHS was about 2-3 hours early with the storm activity, but had the location correct.  Radar image at 21z, PHS image at 19z

- Rainman

Convection filling in

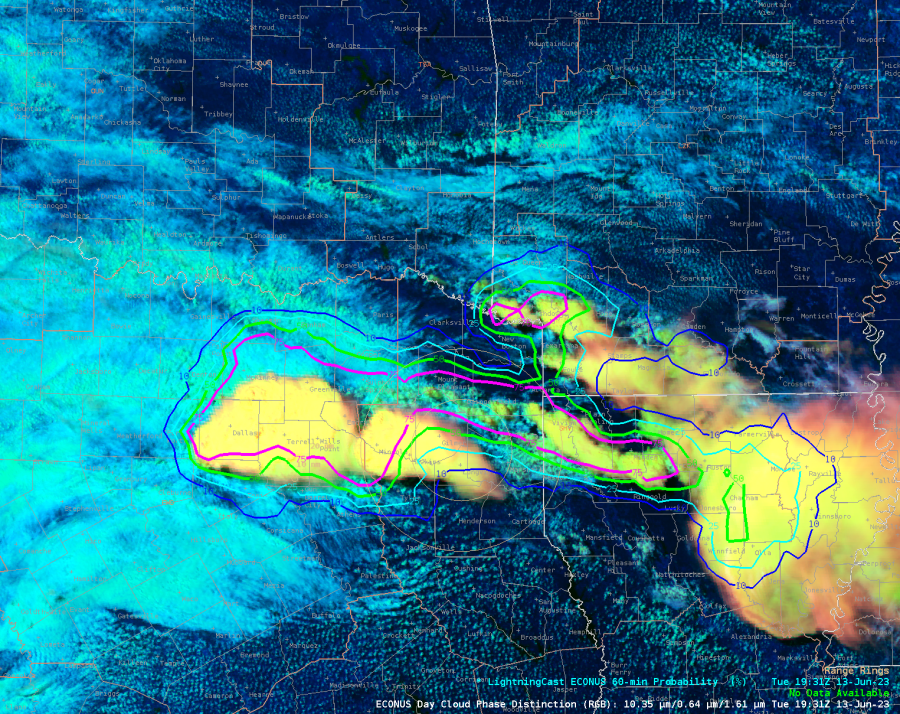
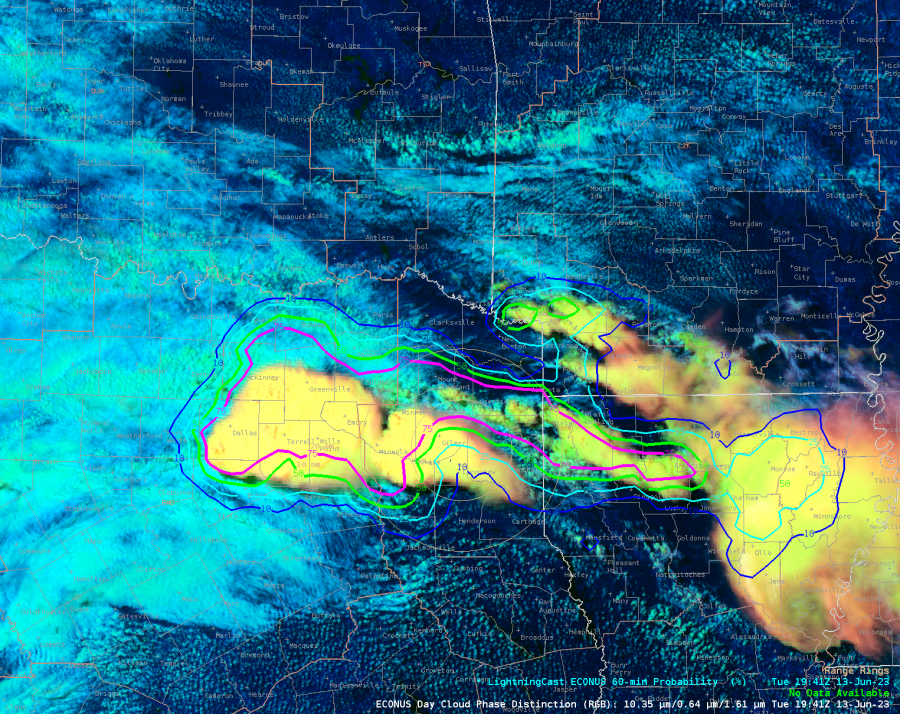
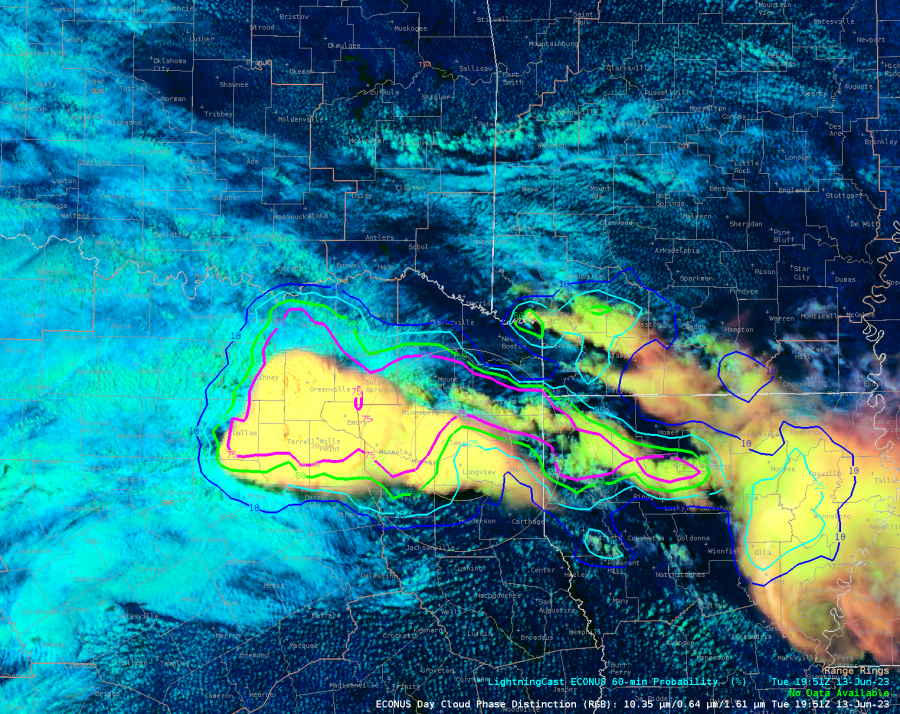
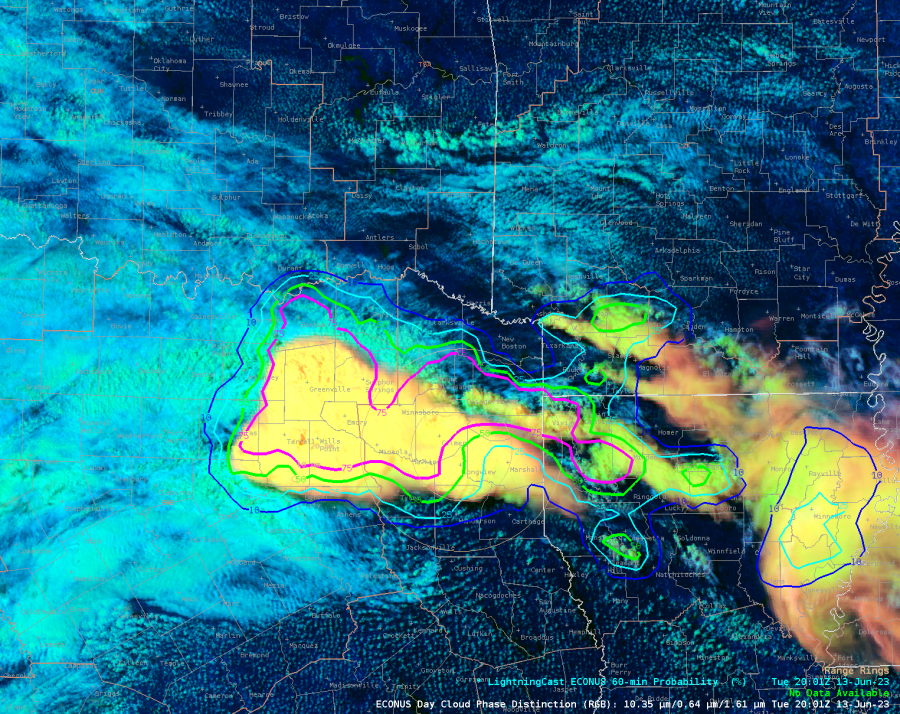
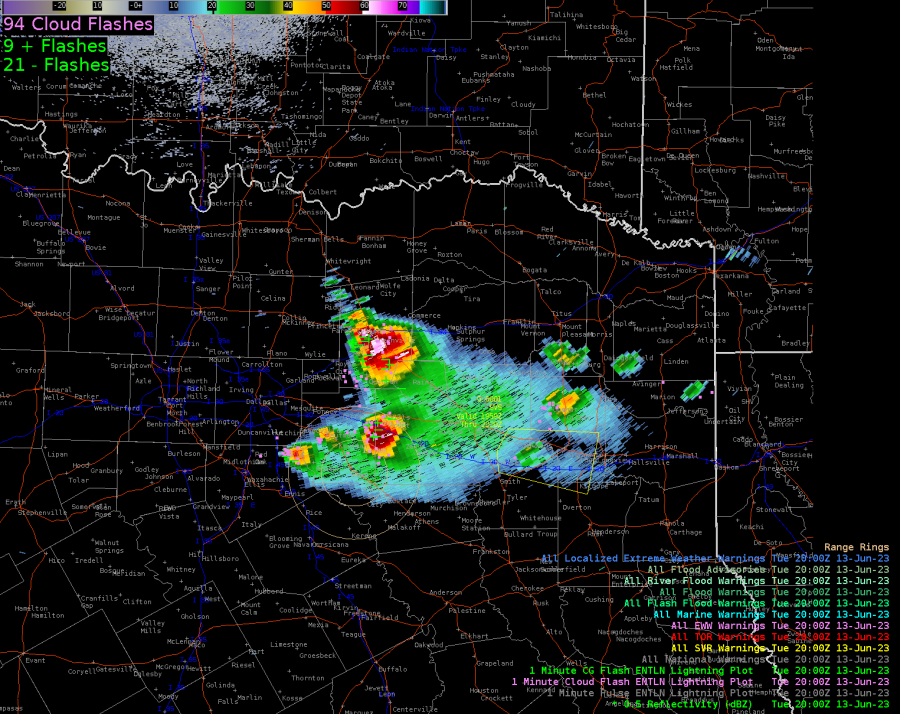
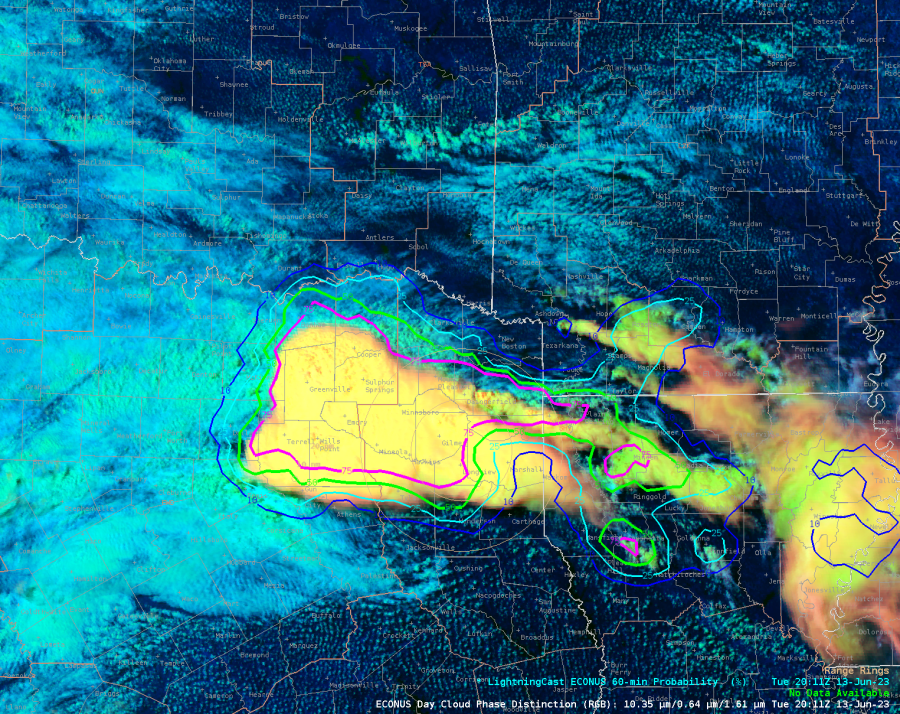
Our forecasters have begun the day in Shreveport, LA, Jackson, MS, and Birmingham, AL. A PDS-severe watch has been issued for Jackson's entire CWA. In Figure 1, you can see ProbSevere LightningCast capture the developing convection as it "fills in" between more mature storms. With forecasters concerned with severe, tornadic, and lightning threats (for DSS), LightningCast can help forecasters quickly discern new areas of concern.

Figure 1: LightningCast contours, GOES-16 ABI daytime cloud phase distinction RGB (background) and GOES-16 GLM flash-extent density (orange-yellow foreground).

Tornadic Panhandle storm emblematic of the differences between ProbTor v3 and v2

A powerful storm that saw it's genesis in northeast New Mexico and it's demise in south-central Oklahoma, spanned nearly 11 hours. It produced tornado reports near the Oklahoma-Texas border in the Panhandle region, as well as numerous gigantic hail (5" diameter) and wind reports (up to 75 mph) (Figure 1).

Figure 1: ProbSevere v3 contours (outer contour is colored by ProbTor v3), MRMS MergedReflectivity, and NWS severe weather warnings for a supercell in the OK/TX Panhandles.

This storm clearly demonstrates some important differences between ProbTor version 3 (PTv3) and version 2 (PTv2). Early on in the storm's lifecycle, PTv3 was much greater than PTv2. At 21:24 UTC (see Figure 2), PTv3 = 34%, vs. PTv2 = 1%. The first tornado report was at 21:51 UTC, when PTv2 finally increased to 14% (PTv2 later increased to about 70%). Looking into this further, we found several things contributing to the elevated PTv3 and much diminished PTv2:
  • In PTv2, which uses RAP, the SRH 0-1 km AGL was only 50 m2/s2, vs. 100 m2/s2 in the HRRR, which PTv3 utilizes.
  • Similarly, PTv2 strongly relies on the mean wind in the 1-3 km AGL layer, which was only 16 kt. This also was dampening the PTv3 probability.
  • The 0-2 km azimuthal shear (i.e., low-level storm rotation) was modest. This was not enough to overcome the poor low-level kinematics in PTv2 (until much later), while at the same time, it was not too harsh on PTv3.
  • The top contributing predictors for PTv3 were the 0-2 km azimuthal shear, the effective bulk shear (~ 65 kt), the very high MESH (3.43") and surprisingly, a strong low-level laspe rate (8.8 C/km). 

Figure 2: ProbSevere v3 contours (outer contour is colored by ProbTor v3), MRMS MergedReflectivity, and NWS severe weather warnings for the tornadic supercell. Note that PTv3 is 34% here, while PTv2 was only 1%. 

Later on, as the azimuthal shear went off the charts (see Figure 3), PTv2 was much higher than PTv3, but also much more erratic. PTv3 consistently remained in the 30-40% range for awhile, despite very high azshear. This indicates that the PTv3 model has learned that azshear can be quite noisy (due to things such as radar sidelobe contamination), and it learned not to overemphasize the radar-based rotation predictors.

The PTv3 model correctly ramped up probabilities to 30-35% when rotation increased in a decent environment (from about 20:20 to 21:00 UTC), but hedged when rotation (as observed by MRMS azshear) was very high, as evidenced by probabilities below 40%. As of now, there were no other tornado reports after 22 UTC, so this seems like a sensible hedge (the storm was tornado-warned until 02:15 UTC).

In practice, we hope that forecasters find value in earlier ramp-ups in the probability of tornado, while understanding the uncertainty of using scalar-based predictors leads to lower probabilities overall, compared to PTv2 (and fewer erratic swings). We hope that using image-based methods will improve the guidance even further. 

Interactive version of the plots in Figure 3. 

Figure 3: Time series of PSv2 and PSv3 probabilities and certain predictors for this storm.


Tuesday, June 13, 2023

OCTANE's Ability to Assess Areas of Lift In Strongly Sheared Environments


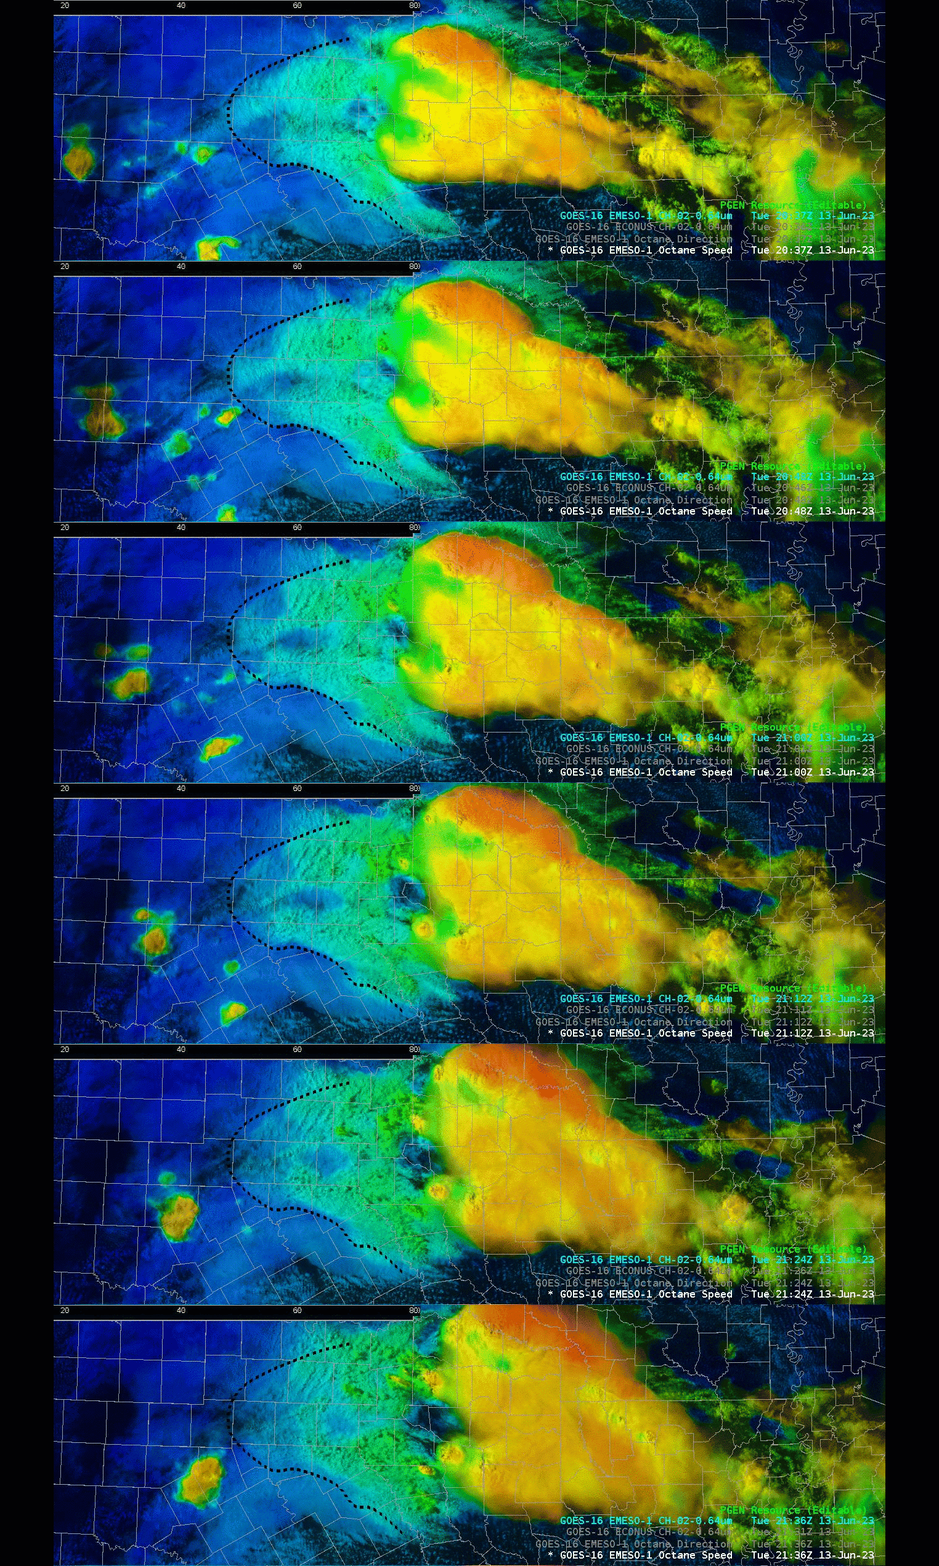
Over northeastern Texas during the afternoon of June 13, 2023, an area of isentropic lift was contributing in the development of robust, severe convection over the ArkLaTex region within a highly sheared environment.

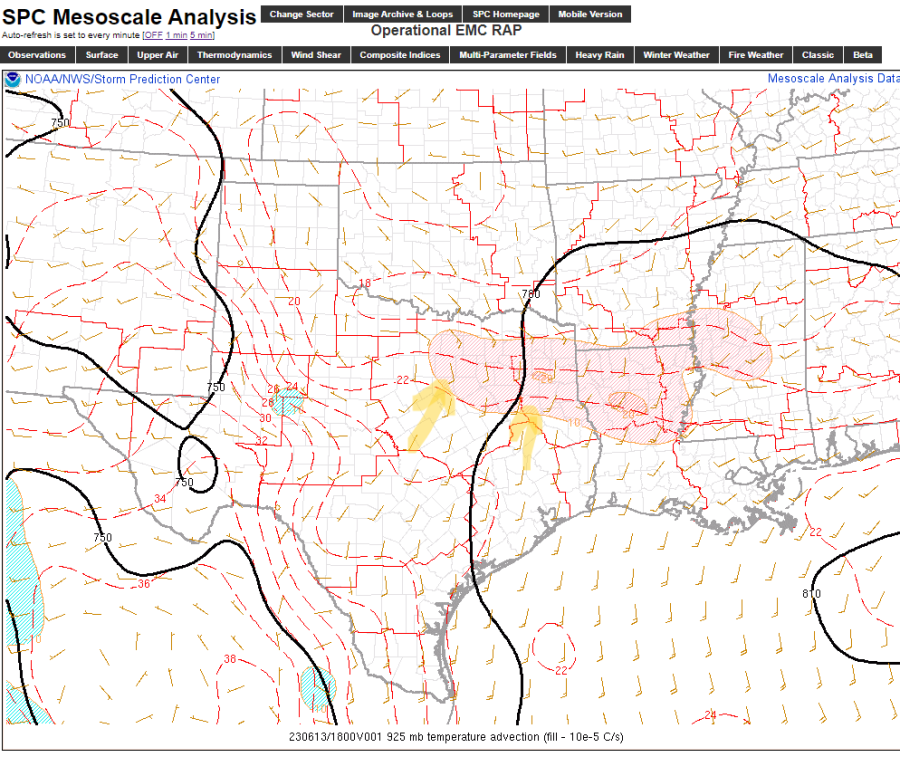
When Looking at the OCTANE Speed Sandwich, a notable gradient in color between darker blue and cyan/green can be seen within widespread stratus over northeasternl TX. This  delineated agitated stratoCu in cyan/green from flatter, more uniform stratoCu darker blue. The color change acquired by the agitated stratoCu was thought to be a result of the satellite product’s ability to detect relatively faster cloud motions of the agitated stratoCu as it grew vertically into a faster wind regime. This made it easy to find where lift was locally higher (in this case isentropic lift via low level WAA overrunning a surface boundary).

Identifying and tracking the area of lift was helpful in assessing the potential for additional convection to blossom downstream, sparking the seeds for eventual robust convection in a highly sheared environment.

Animating a loop of images, one could even see how this area of lift was propagating. Notice the subtle trend area of relatively warmer colors (cyan to green) propagating slowly to the north and east of the annotated line. Tracking the delineating line as well as the overall zone of lift itself as it moves over time could help increase a forecaster’s confidence on whether additional convection associated with this forcing mechanism would remain possible or become unlikely, proving OCTANE can be a useful tool in the Mesoanalyst’s tool belt.

Comparing OCTANE Speed Sandwich to the popular Day Cloud Phase RGB, OCTANE appeared to highlight the area of lift more easily than Day Cloud Phase RGB, and to a relatively high degree of spatial detail.

-OSMBLSN

6/13/23 EWP Blog Post - SHV

 Active CWA assignment today. Warning issuance followed by the log form entry was somewhat cumbersome and time consuming but I understand the reasoning. 

Great interaction with the subject matter experts and their insight and comments were much appreciated. 

Good discussion on the potential uses of the OCTANE data. My CWA partner mentioned constructing real time hodographs that could be sampled. This is a good idea. The mental exercise to visualize the wind profiles from the height / direction/ and magnitude data is taxing to me and I think would be too time consuming in operations. 

Developer stepped through the awips imaging method to highlight specific layer winds and I found this very helpful. A layered wind four panel procedure would be helpful. Also good discussion on reaching for storm scale signals in the wind fields and whether wind speed data bins could be higher resolution than radar at high elevations and distance from radar. An intense left moving storm during this exercise window across NW LA into far SE OK showed strong anvil level divergence that persisted for an extended period.

Screen capture of the ice machine and intense three body scatter spike that persisted for close to an hour at least. Probsevere was very good especially once the tracking element was assigned to just the primary updraft. I issued several warnings during the exercise window and utilized probsevere on each one. The time trend window is great and I hope it gets to the operational version soon.

The PHS idea of better utilizing sampled profiles seems good to me. I would prefer it not be solely validated by WRF model output. I like the idea of showing where the fusion data senses departure from model initial conditions similar to shown on  this website:   cas.hamptonu.edu/~adinorscia/InteractiveMap/FusionMap.html

NUCAPS data today  was from the previous run with the 10-12 hour forecast near the exercise valid time. I compared the 11 hour NUCAPS forecast to the zero hour RAP analysis for MUCIN across the exercise domain. There was a large discrepancy between the two. Due to convection that had spread across this region earlier in the day I discounted the NUCAPS data. In this instance the NUCAPS forecast would have been viewed as suspect and likely would not have been used.

- jbm

DFW and TAE HWT Feedback for 6/13

 General question overall, can the units be displayed in fraction form instead of with a (-1 or -2)?  Such as m/s instead of m*s-1?

PHS

Can temperature units be in F or even C instead of K?

Is 0-1 KM bulk shear AGL?

Could the bulk shear be in knots instead of m/s?

Can the bulk shear vectors and mean cloud wind vector (or 850-300mb wind) also be plotted?  This can help with determining storm mode. 

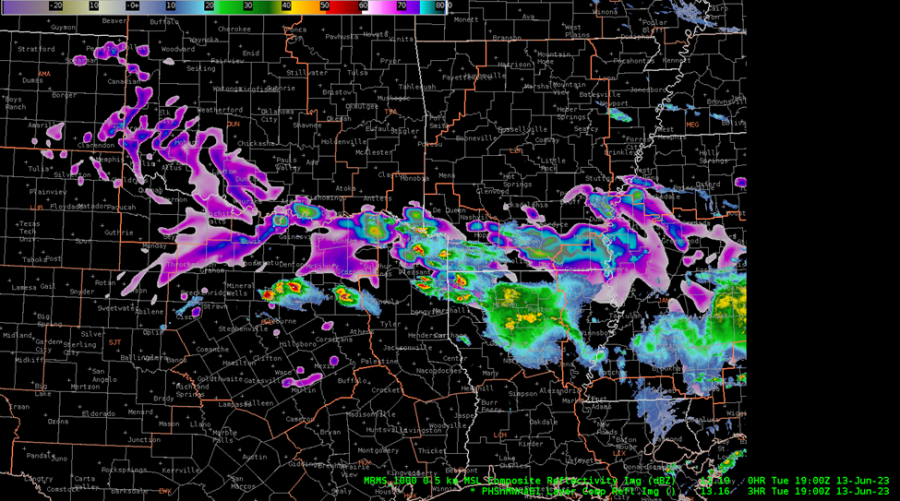
The PHS had storm coverage well matched with radar when simulation started.  However it was about 3 rows of counties too far north than what actually was happening.  This led me to believe that all the other data with PHS was also shifted north for what was actually happening.
Could mixed layer CAPE/CINH be added to the stability menu?  I think SPC’s mesoanalysis page defaults mixed layer to 100mb.  We use mixed layer CAPE quite frequently at our office.

Having DCAPE as a viewable product would be very helpful to diagnose a severe wind threat from supercells.

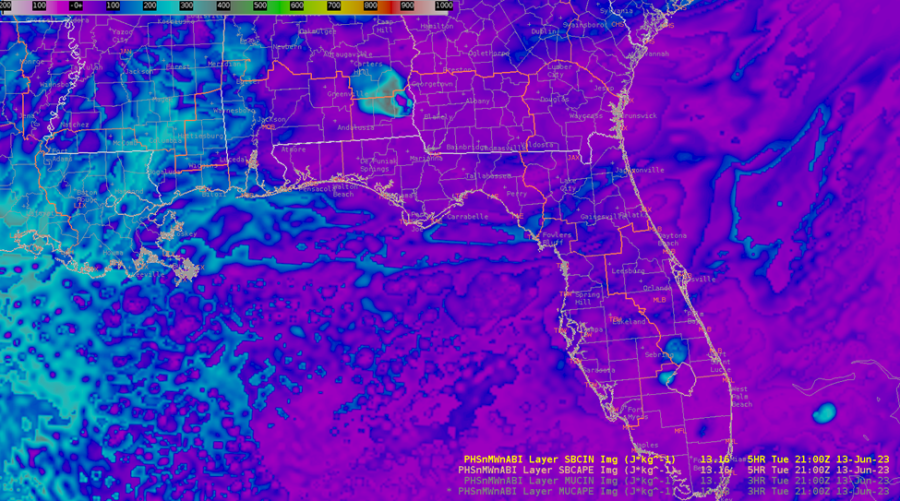
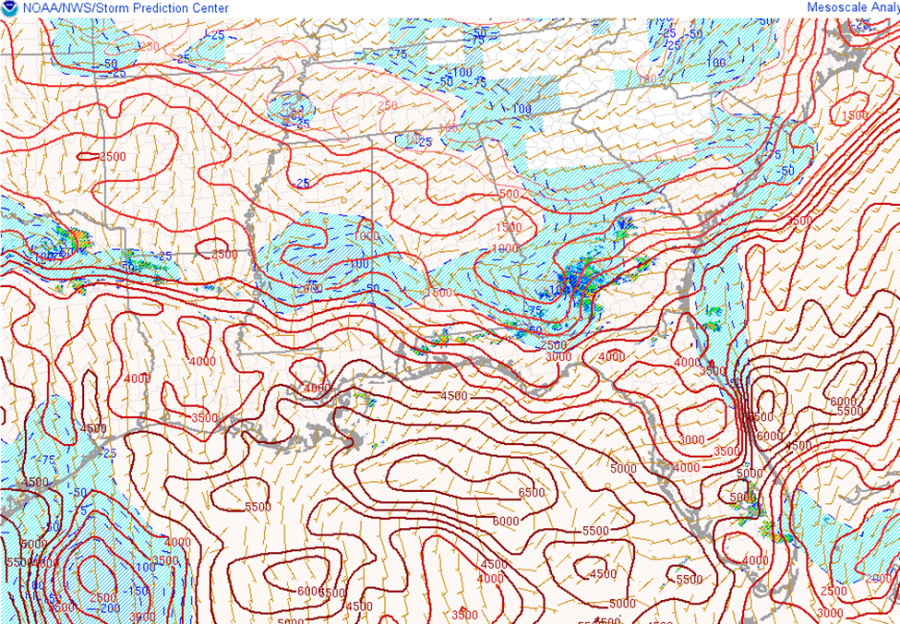
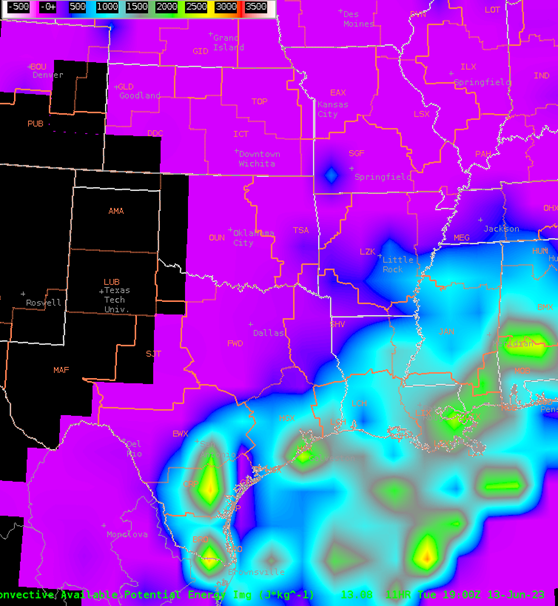
Noticed the PHS surfaced based CAPE/CINH matched quite well with mesoanalysis except for the CAPE/CINH just north of FL.  Both images are from 21z.
LightningCast

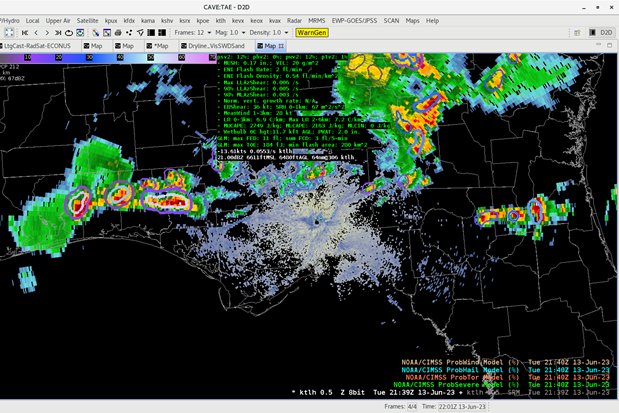
Helped maintain awareness about the overall threat for lightning, especially on the outskirts of the storm.

NUCAPS

Noticed the ML CAPE was much further east than what happened.  Of course this was from the morning overpass, not the afternoon one.
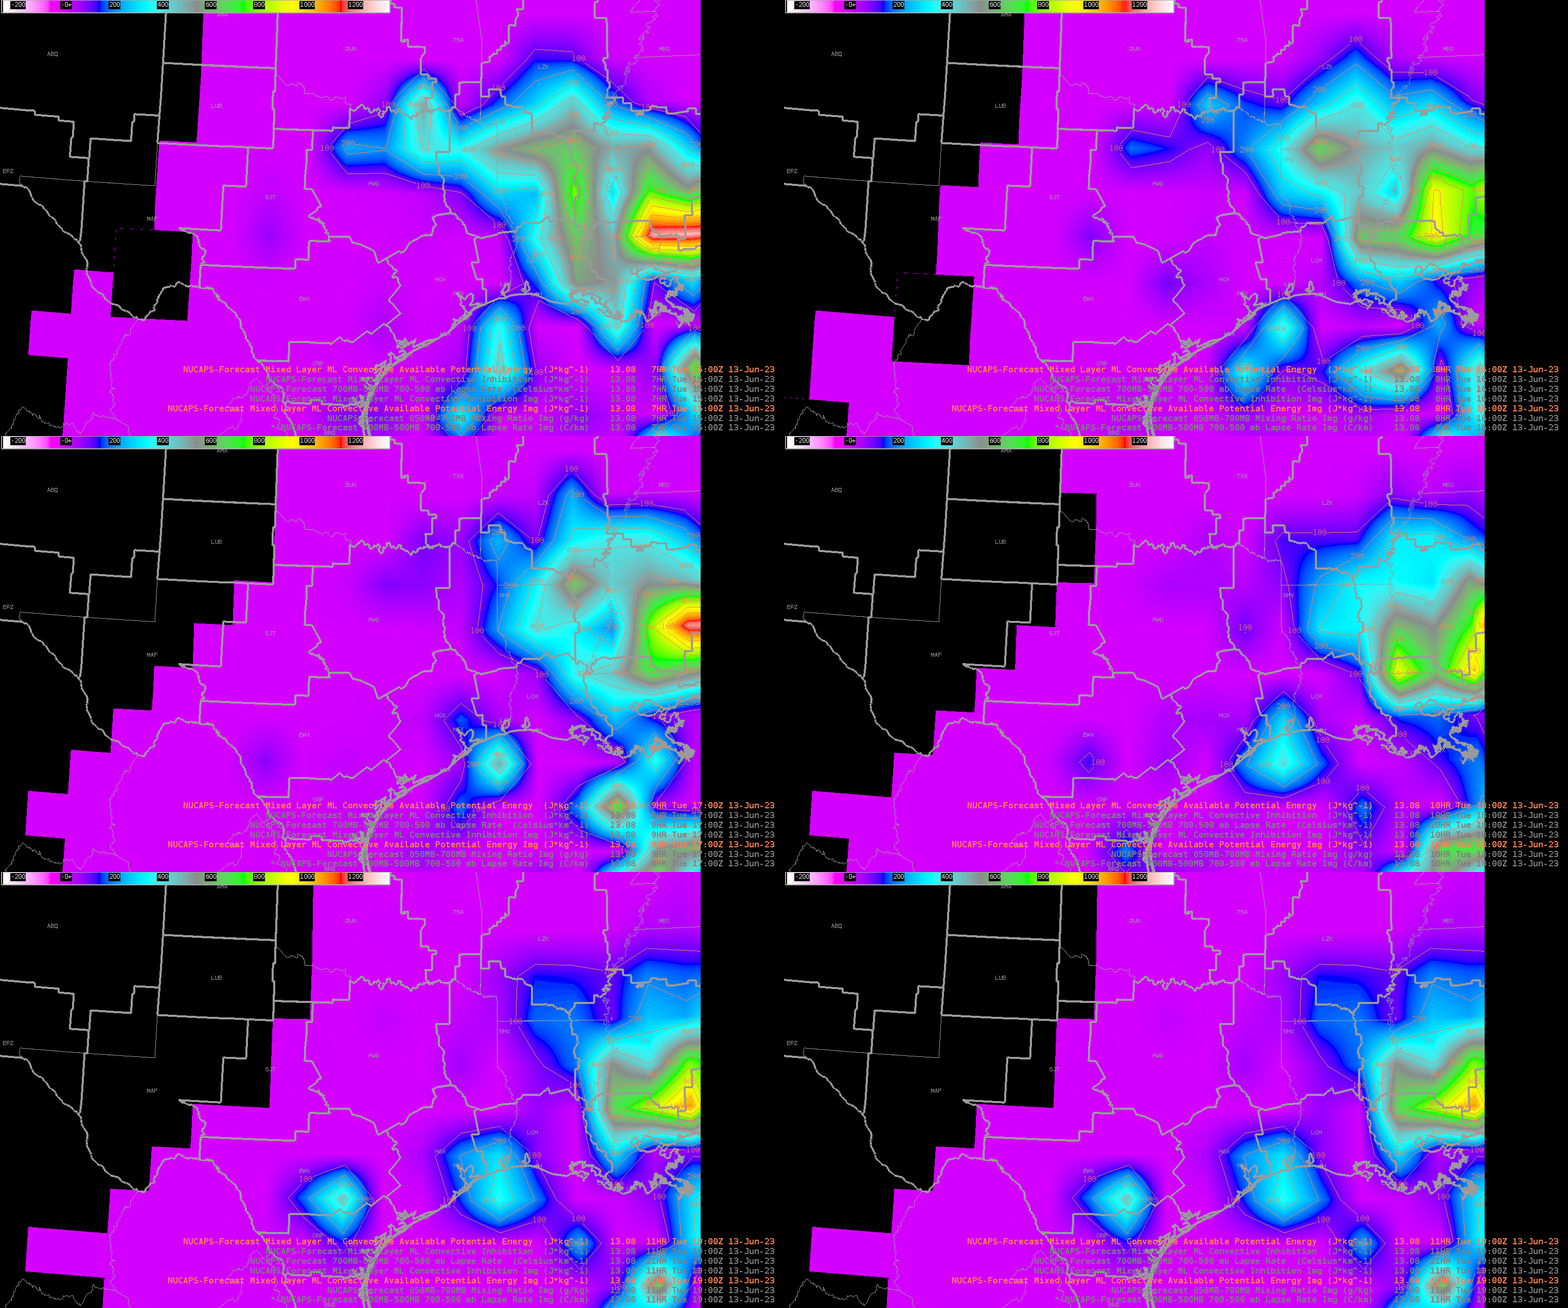
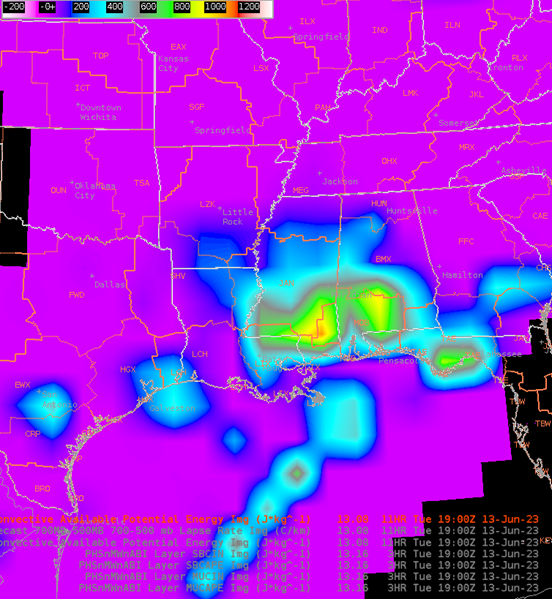
Did notice that the ML CAPE was lower than the surface based and MU CAPE.  Was going to look at a NUCAPS sounding to determine why that may have been the case.  However was not able to do that due to no data aside from the morning run. ML CAPE is on the left, MU CAPE is on the right below.
Prob Severe

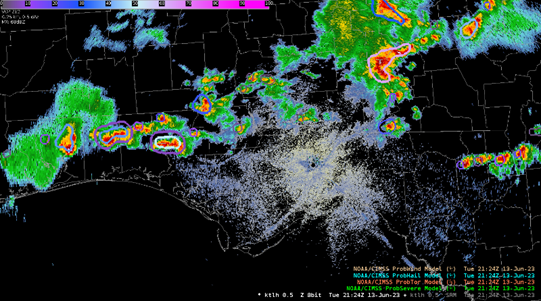
Is there a way to highlight which storm Prob Severe is showing the trends for?  When I am looping the radar with multiple storms on it (example image below), I quickly lose track of which storm I had the trend graph displayed for.  Really like the ability to look at the trends graphically through AWIPS instead of having to go to the webpage to do so.
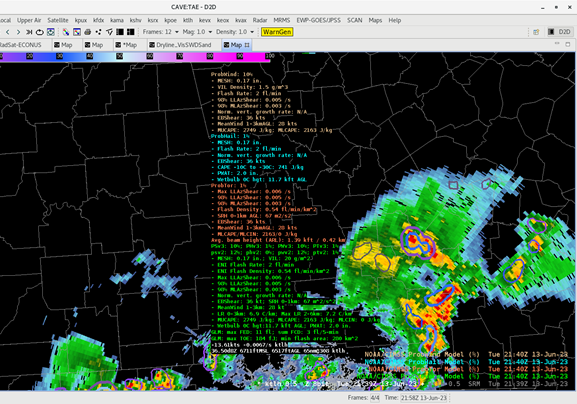
Noticed the readout only displayed above the pointer, not below.  The right image is what happened when I tried to sample the Prob Severe data.
Could there be an option to select the different fields we want Prob Severe/Hail/Tor/Wind to show?  There is a lot of data there, good data, but at the same time too much to look at during storm interrogation.

Does ProbTor calculate QLCS tornado probability?  This would help build confidence for issuing these kind of tornado warnings because the environment can change so rapidly from one radar scan to the next.

OCTANE

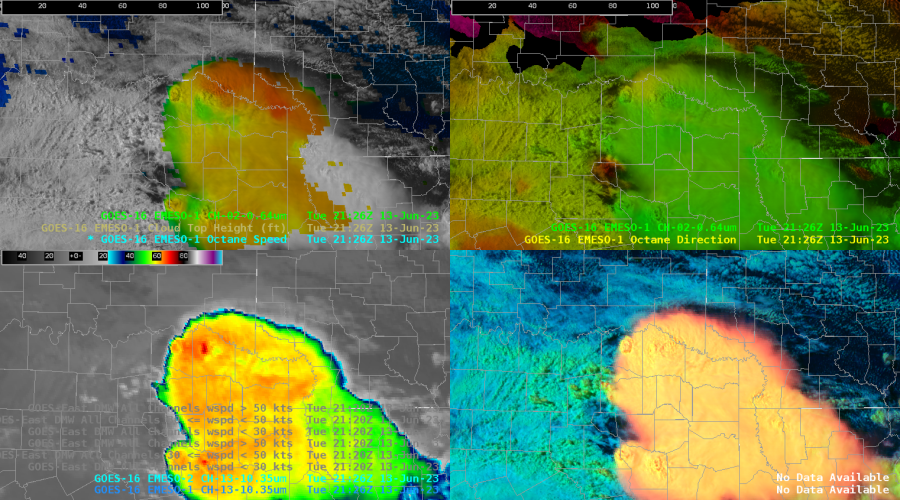
This helped me really see the updraft divergence of the cells.  This was in deep layer shear environment of 20 kts.  Neat to see the divergence weakening on the middle bottom cell in the upper left pane weaken as the cloud top temperatures warmed for that cell, confirming that the updraft was weakening.
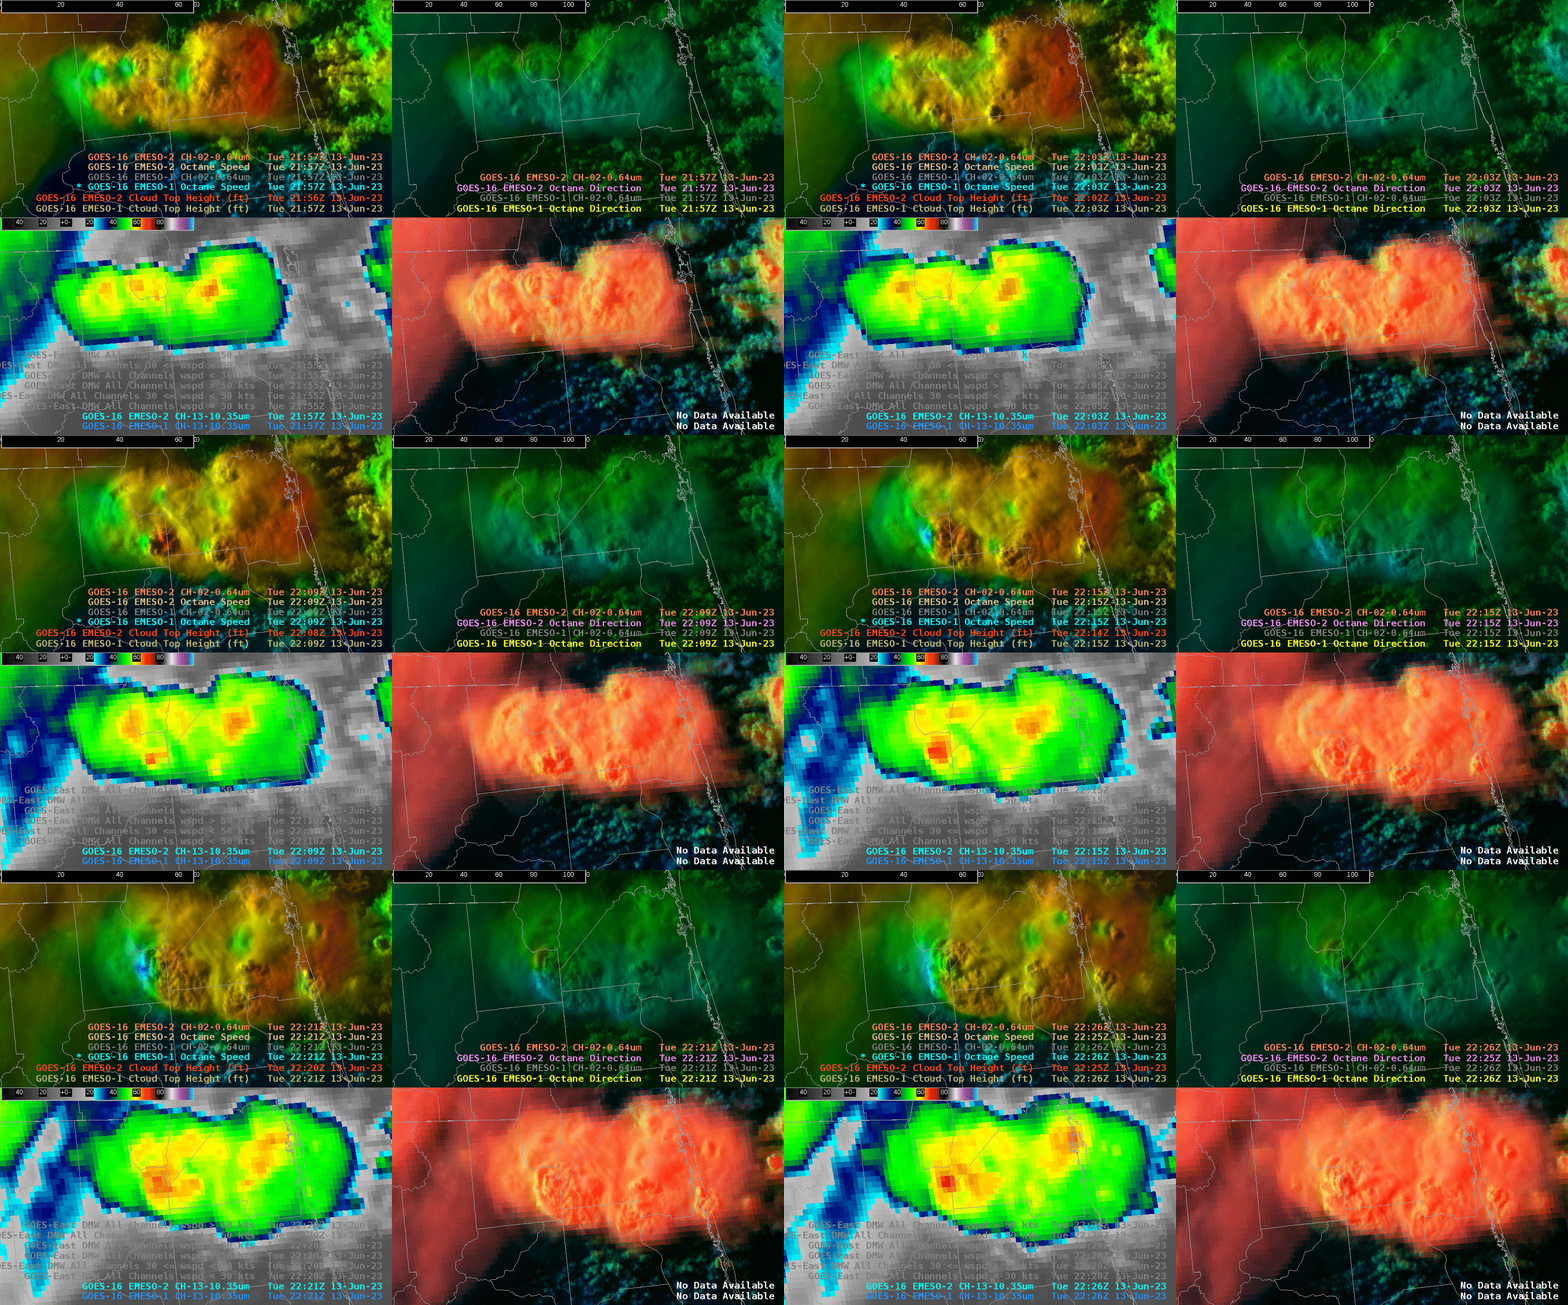
- Rainman
Day 2 Review of Products & Operational Applications

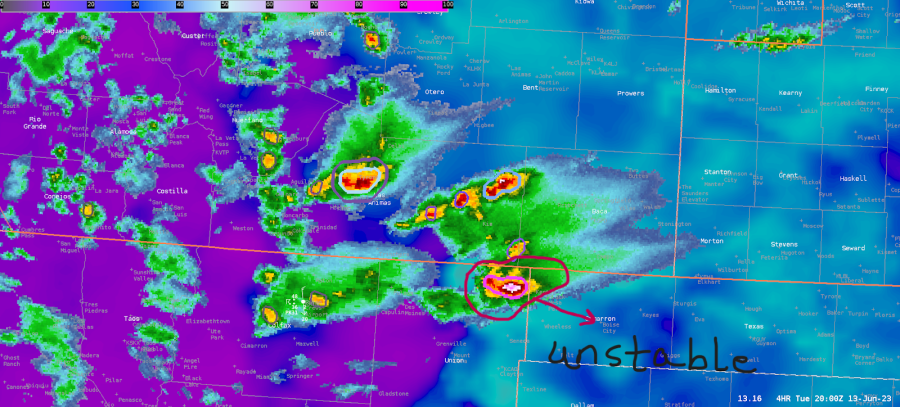
 I took on the DSS role during today’s operational period. There were no afternoon NUCAPS-Forecast runs and the morning runs provided minimal coverage over the AMA CWA. So, I opted for PHS data today (namely SBCAPE) with MRMS 0.5 km Composite Reflectivity and ProbSevere overlaid (Figure 1) to diagnose the environment. Much of AMA was socked in by stratocumulus at the start of the operational period, but severe storms just to the west posed a concern as they tracked eastward into a gradually destabilizing environment.

Figure 1

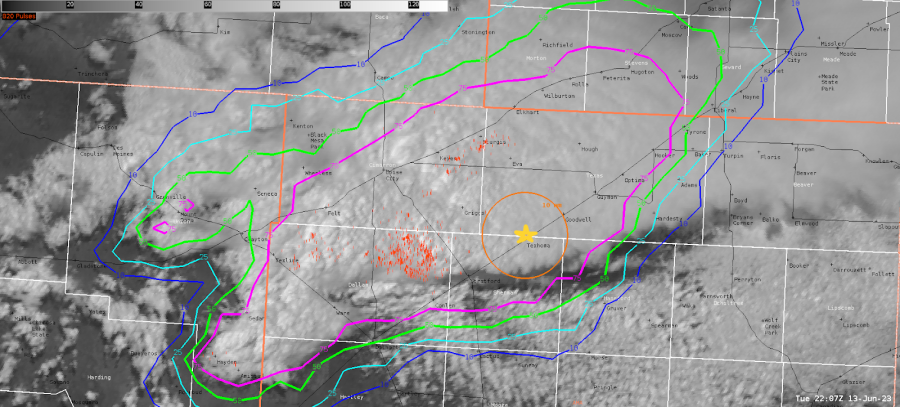
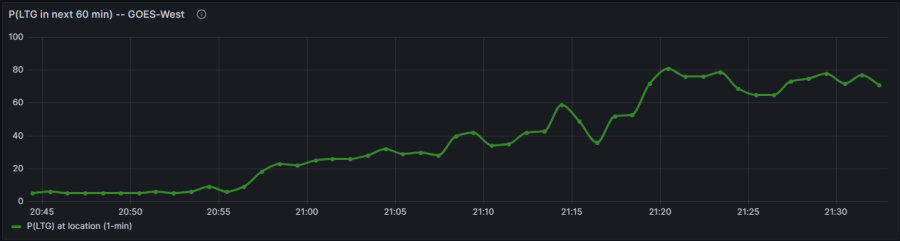
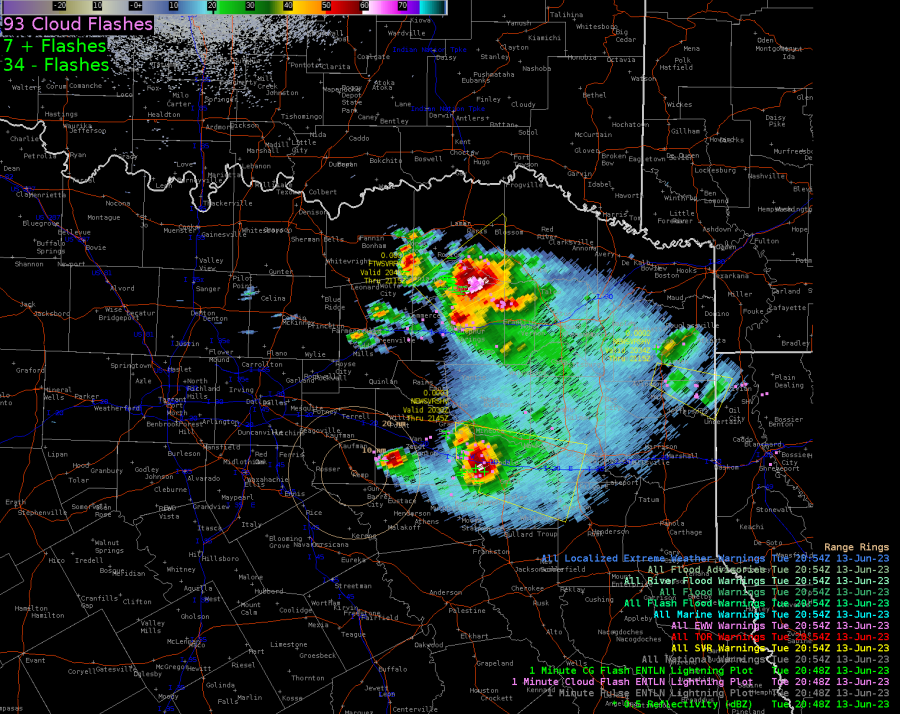
The assigned DSS event was a hypothetical RC plane show at Texoma Municipal Airport (denoted by a yellow star in Figure 2). I was instructed to alert the hypothetical POC for the event when either of the following hazards were expected within 20 minutes: winds or gusts of 15 kts at the airport OR lightning within 10 miles. I used LightningCast probability contours along with ENI 5-minute pulse lightning plots (reddish orange tick marks) to monitor the proximity of lightning to the event range ring (Figure 2). I issued a DSS update with “lightning likely” wording after the LightningCast meteogram depicted a steadily increasing likelihood of lightning at the airport within an hour (Figure 3).

Figure 2

Figure 3

A LightningCast observation: the footprint of the 75% probability contour was much larger than the actual area in which lightning strikes occurred (at least according to ENI 5-minute pulse lightning) mainly in the anvil region. That said, GLM Flash Extent Density did indicate low-value pixels in the anvil region, so perhaps I missed some anvil lightning strikes by looking at just ENI 5-minute pulse lightning.

- Vort Max  

PHS Blog Post AMA 6/13

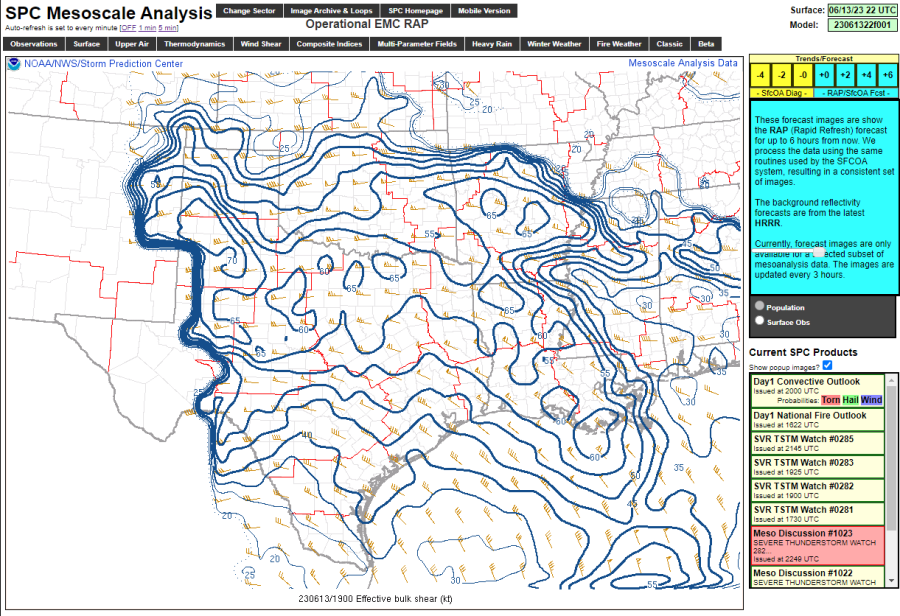
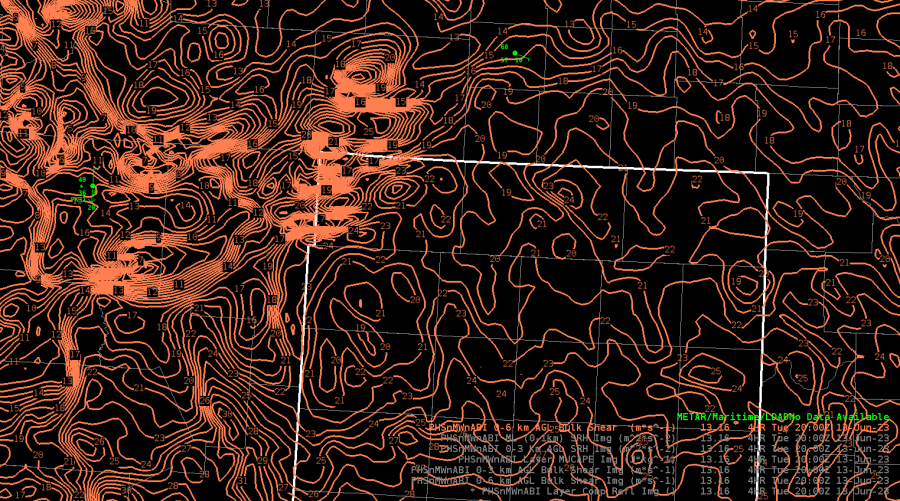
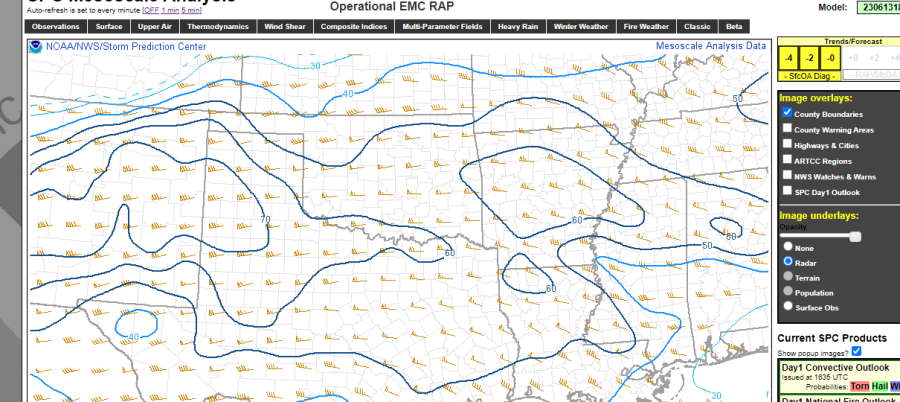
 PHS today was interesting given some of the local convective parameters. The main one that caught my attention was the lesser 0-6km bulk shear that it was giving just ahead of an incoming storm in the Oklahoma Panhandle. The PHS was around 20-30 knots whereas other guidance and SPC Mesoanalysis was showing 50+ knots. I did look at other parameters such as MUCAPE and SBCAPE for example and they were in the ballpark of other guidance including SPC Mesoanalysis.  If the PHS was correct then the storm mode would feature more multicell with some organization vs more of a discrete supercell mode so it was going to be interesting to see what would occur. 

What wound up occurring was a persistent long track supercell along with other convection which was anticipated given the PHS wind shear.  Overall, I was impressed with the PHS wind shear forecast as that tailored away any thinking that there may be additional supercells as additional updrafts would interfere with the intensification of other cells. The PHS however was around 1-2 hours slow with convection moving into the AMA CWA, however the composite reflectivity forecast did show more of a cluster of storms developing. The PHS was also showing a corridor of stronger 0-3 and 0-1 SRH which in reality the intense cell did move through and actually wound up producing a few tornadoes. The ProbTor was also showing tornado potential as high as 40% as it was moving through this corridor.  Overall, I was impressed with the PHS today and think that it could create good DSS messaging opportunities along with being skillful in Mesoanalysis.

PHS showing the lesser values of 0-6 bulk shear in contoured form

SPC Mesoanalysis depicting the 0-6km bulk shear at the same time

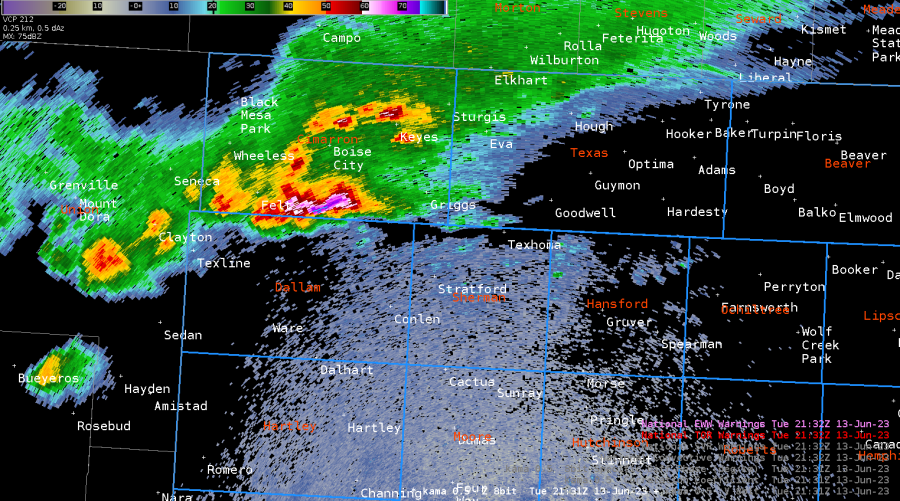
How the radar wound up turning out at 2130Z with the multiple cells

- Tor Nader  

LtgCast Precursor to Storms Diverging

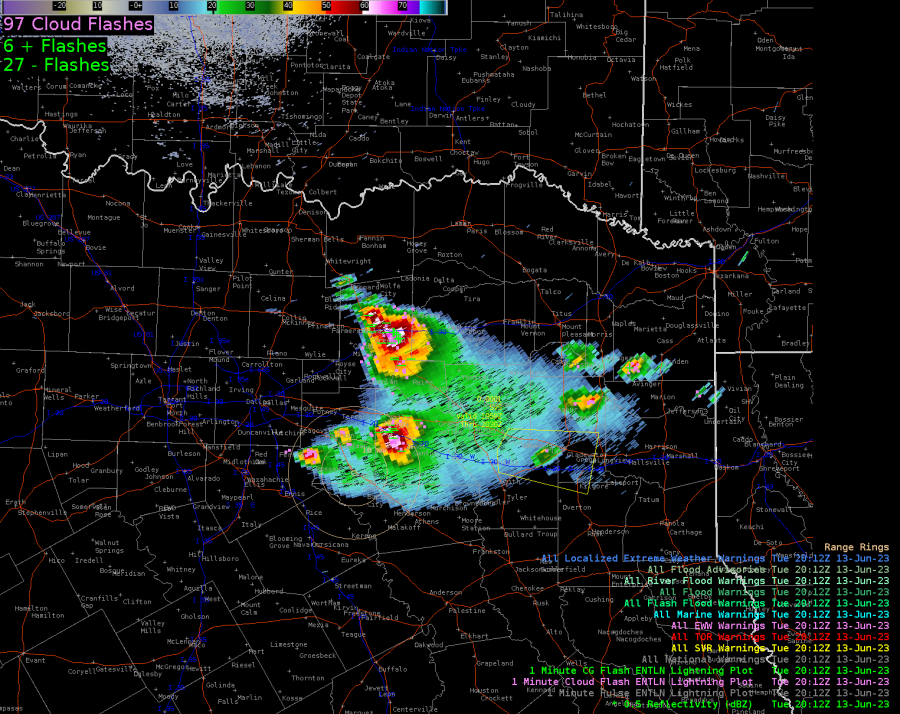
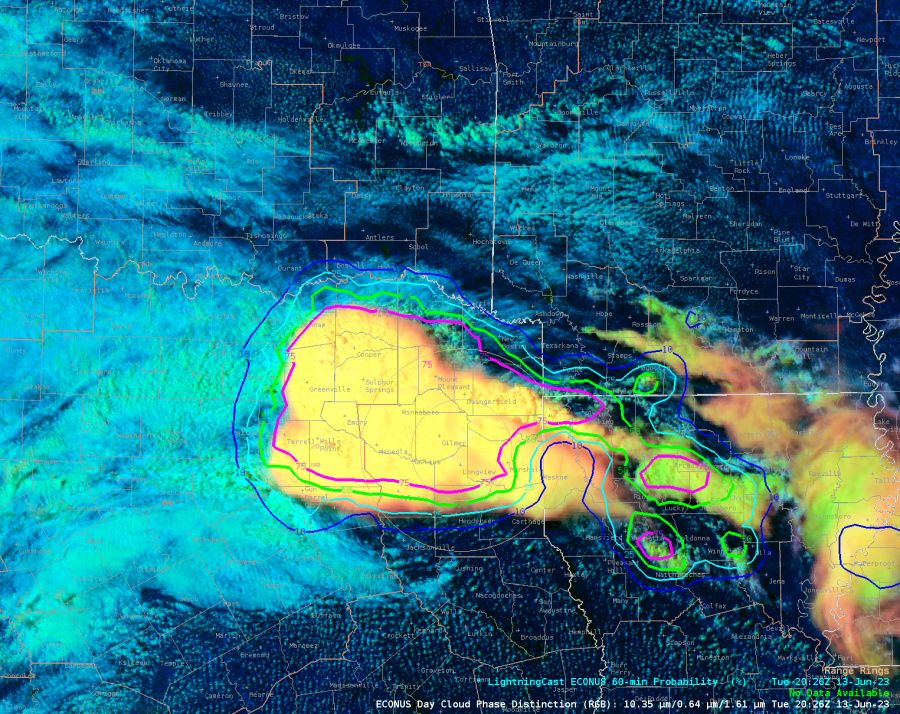
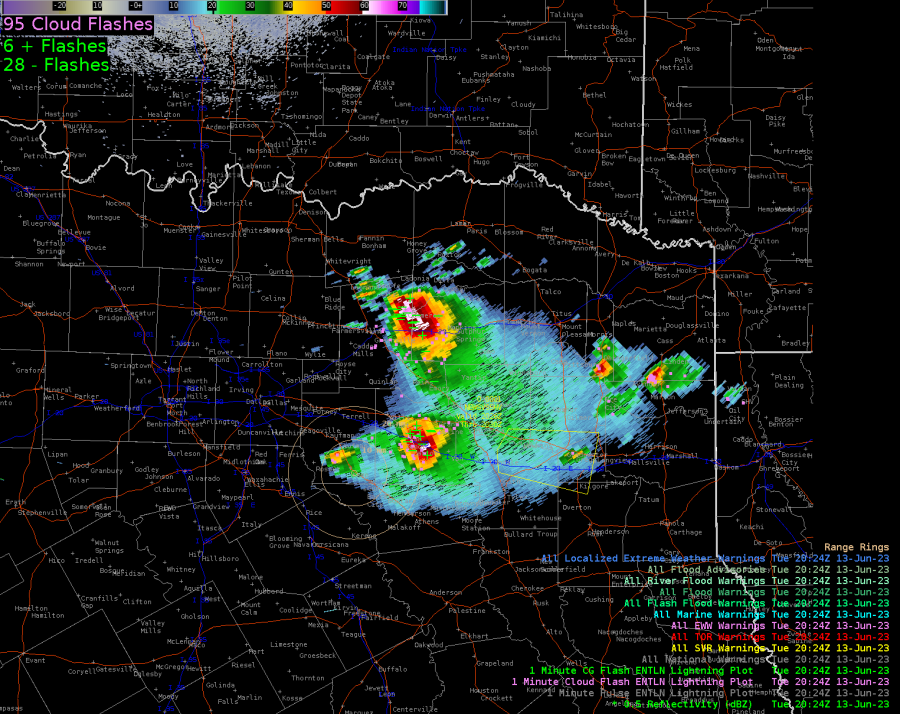
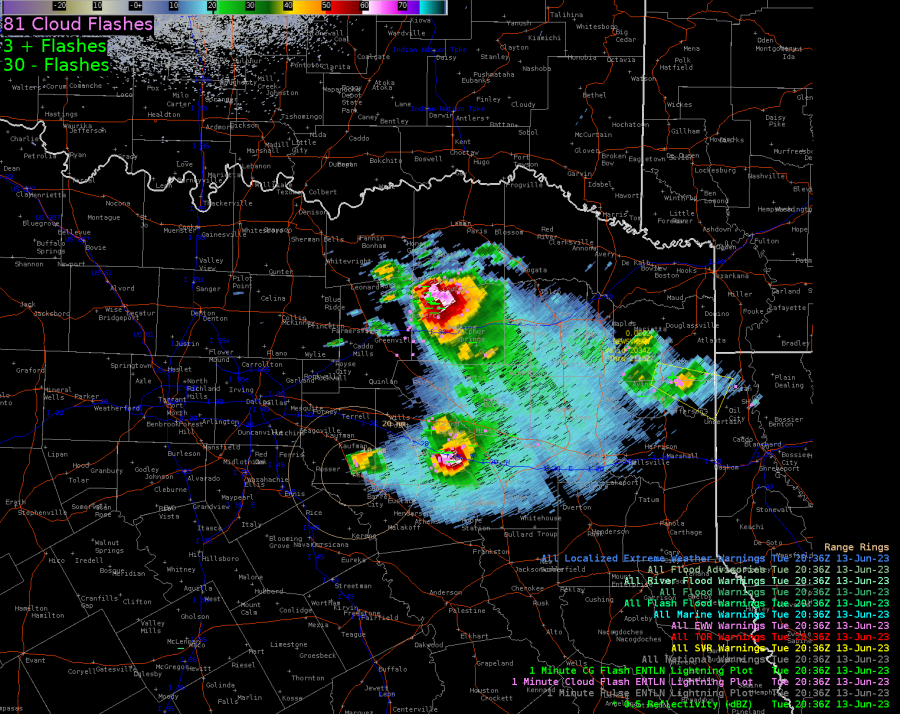
 LtgCast gave advanced indication (about an hour) in the FWD region that the northern storms were diverging to the north away from the original track that was more easterly. Below you can see the LtgCast extending to the north into clear skies in the first two images. The next four pairs of images are the LtgCast paired with the radar at about the same time. The last two images are the next 20 minutes of radar.

In the TAE area, the LtgCast wasn’t as effective. Behind the storms, LtgCast kept >75% probs for lightning in clear air as seen in satellite imagery, possibly as much as 50 miles or more. This was odd in that it usually quick to pull in the probs behind the storms. It wasn’t that the storms were slow moving or inconsistent in their motions; they were moving uniformly to the southeast at a constant rate (didn’t measure the speed, but would estimate the line speed 20 kts or more).

- Super Bolt

Strong to Severe Thunderstorms This Evening

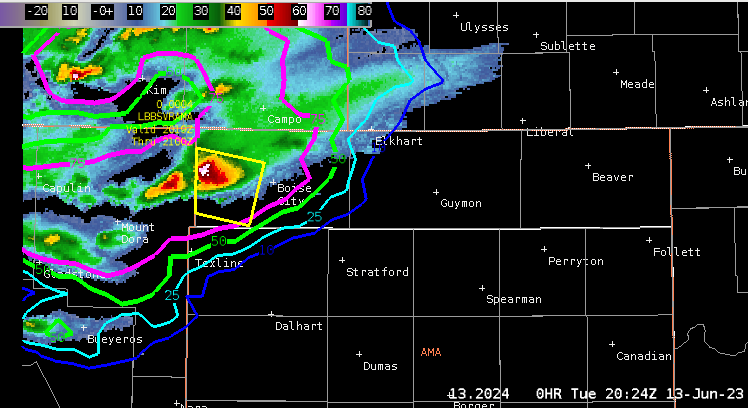
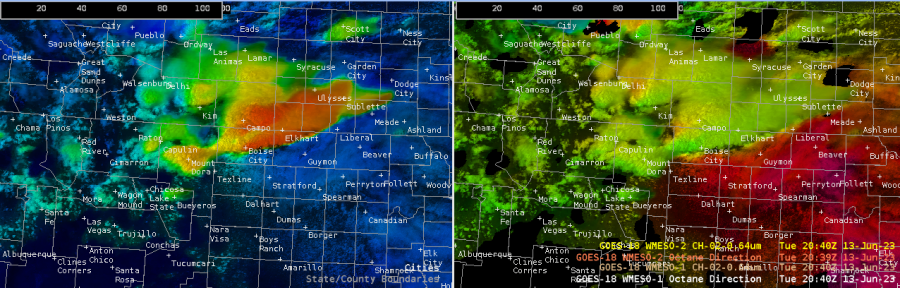
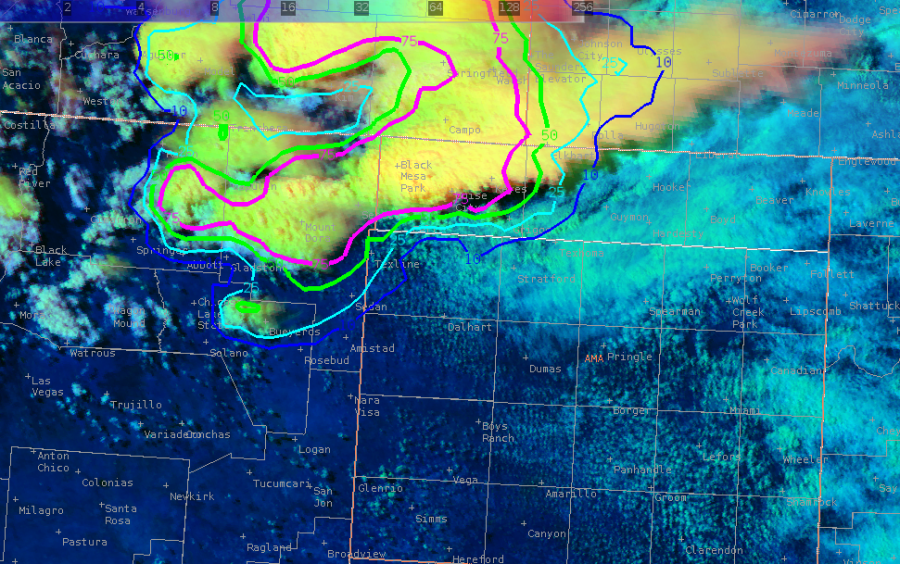
 Based on the latest satellite and radar data, a supercell thunderstorm has moved into the very northwestern corner of our cwa (northwest of Boise City). A Severe Thunderstorm Warning has been issued for the Boise City area with the greatest threat being large hail, damaging winds, and maybe an isolated tornado. Echo (cloud) tops are ranging between 40-50 kft. LightningCast data is showing lightning activity increasing over that area as CAPE values have increased to 2,000 J/kg.Based off the OCTANE Motion and Speed Sandwich product, storm top divergence is evident near Boise City with the tight color gradient with winds to the north of Boise City at 234 degrees vs 188 degrees south of Boise City. This activity is being driven by a surface low near the TX/OK state line. As this feature continues to shift to the east-northeast there is the potential for this storm to strengthen and/or for additional showers and thunderstorms to develop across the area.

-SATGLM_84