Monday, June 12, 2023

Day 1 Observations

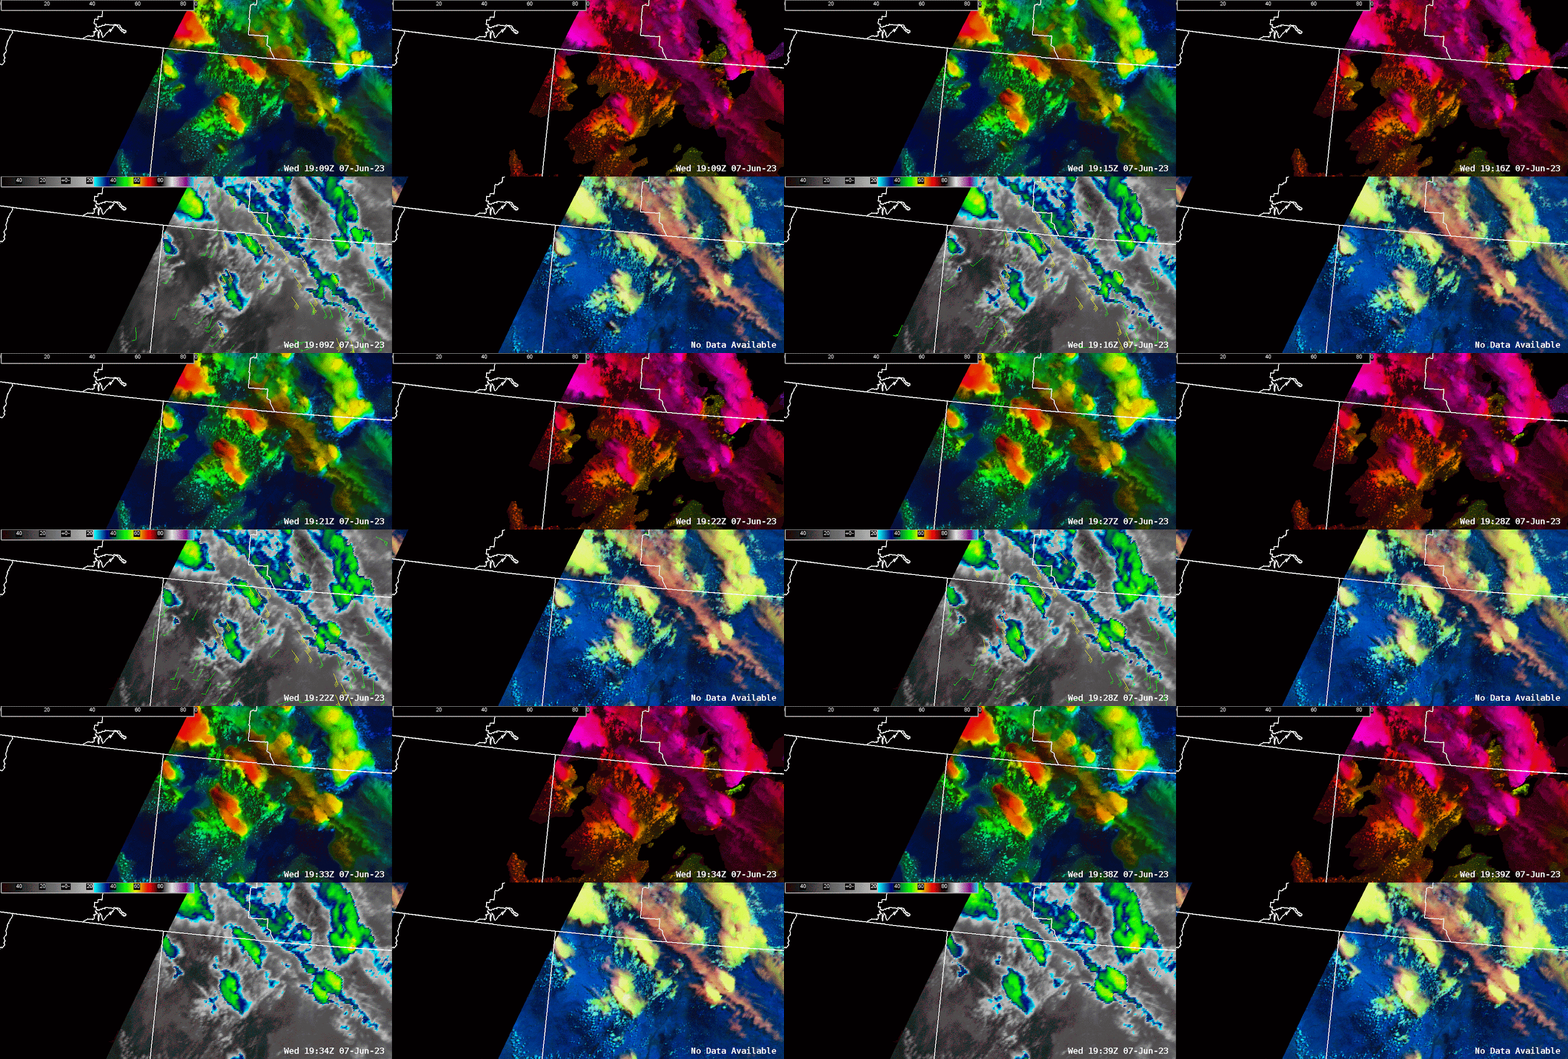
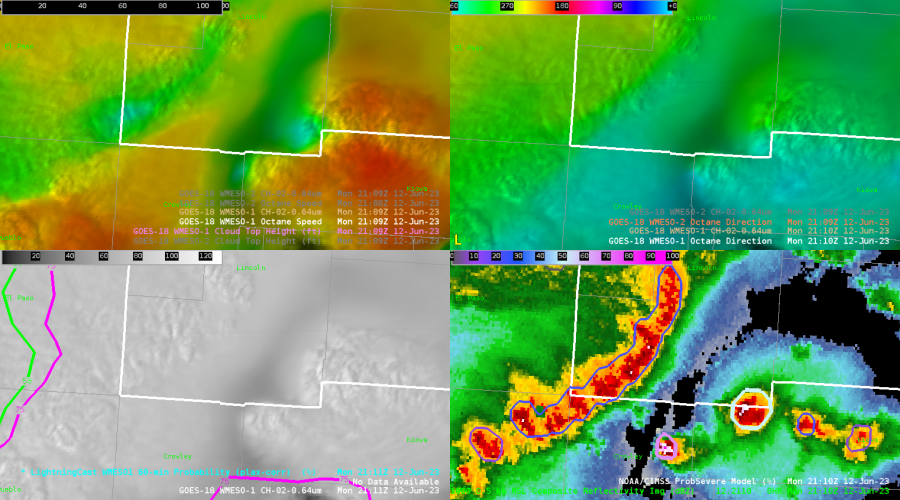
 The one thing I found today from looking at PUB CWA, was that the Octane satellite image may have been picking up on areas of intensification before it was radar indicated. The areas of interest lie on the Lincoln, Cheyenne, Kiowa county lines and Lincoln, Kiowa lines as seen in the upper left image below. There is a gradient between the yellow and blue which identifies areas of divergence.  The bottom right image is the radar showing that there are cells in the area.

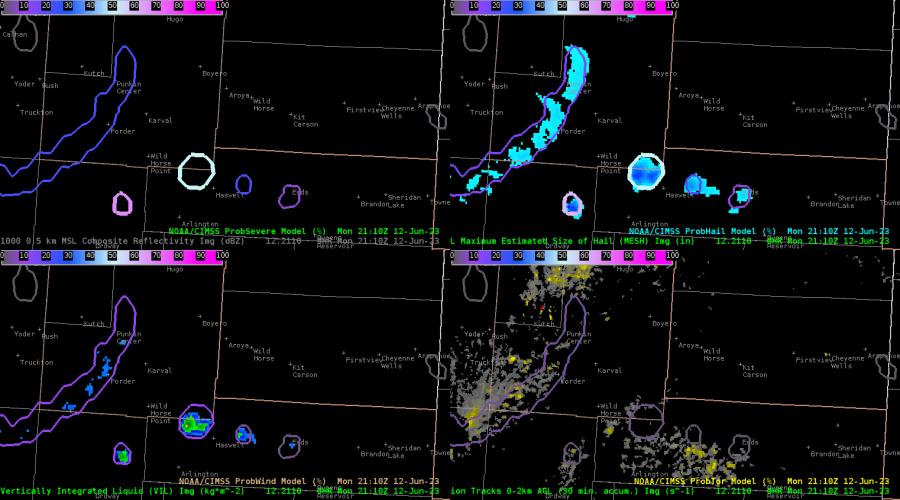
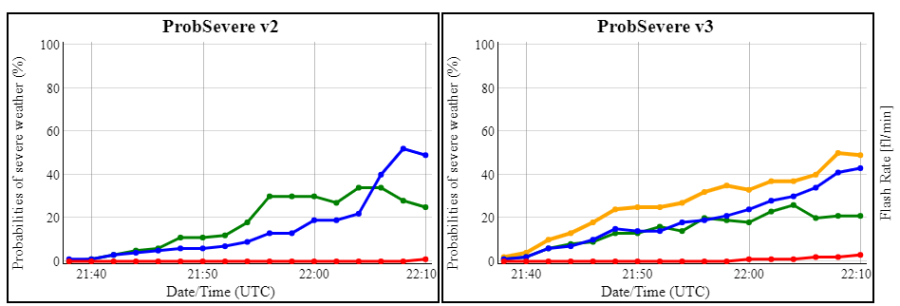
This next image shows the probsevere predictability at the time of the above image. Note the values, especially on the prob hail (upper right)

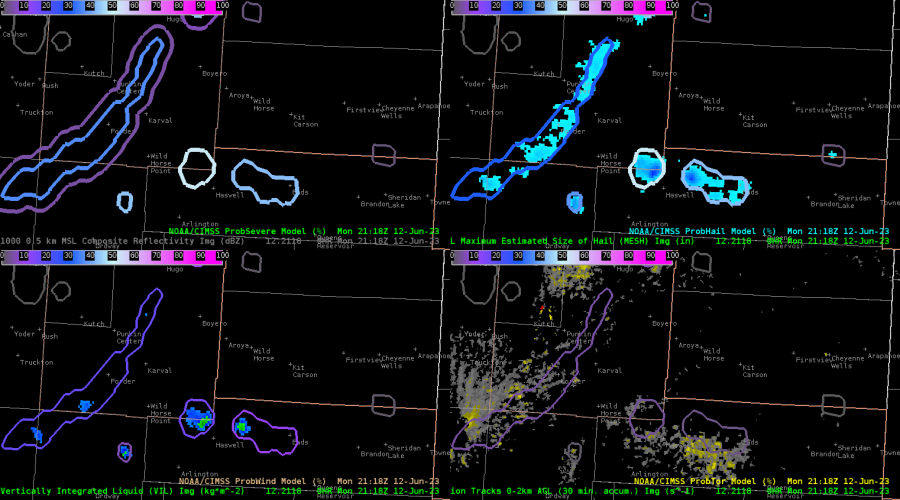
The next image below shows that the probsevere values actually did increase in under 10 minutes on ProbSevere (Top Left and Prob Hail Top Right) The intensification could be from locally enhanced wind shear as Octane shows convection developing locations of strong shear in the localized areas of divergence aloft. It will be interesting to see if this trend continues throughout the week.

-Tornader

Assessing Potential for Additional Severe Convection in ABQ June 12, 2023

 Our group role played as ABQ on June 12, 2023, where severe convection was already underway in the northern third of the CWA during the early to mid afternoon. Rather than interrogating ongoing storm strength and hazards, we were curious as to whether or not additional severe convection was possible south of the current convection. In essence, we were performing tasks of a mesoanalyst.
The synoptic environment was composed of upper troughing over the Great Basin region, with a stout, unseasonably strong mid to upper level jet at its base overspreading New Mexico, and a shortwave trough pushing out of the Four Corners into southeastern Colorado as well as northern New Mexico. GOES-16 mid level water vapor imagery showed the location of the bulk of synoptic forcing through steadily cooling brightness temperatures (not associated with deep convection). Overlaying NAM 500mb geopotential heights helped illustrate where strongest height falls associated with the shortwave trough were located. In this case, strongest height falls/cooling brightness temperatures were located within southern Colorado into far northern New Mexico, and was driving the ongoing severe convection in northern ABQ. However looking south and upstream within central New Mexico, there were still cooling brightness temperatures within water vapor imagery, just not as robust relative to the north. This implied there was still some synoptic forcing for ascent to overspread areas like San Miguel, Guadalupe and De Baca counties, the counties we were most interested in for additional initiation.
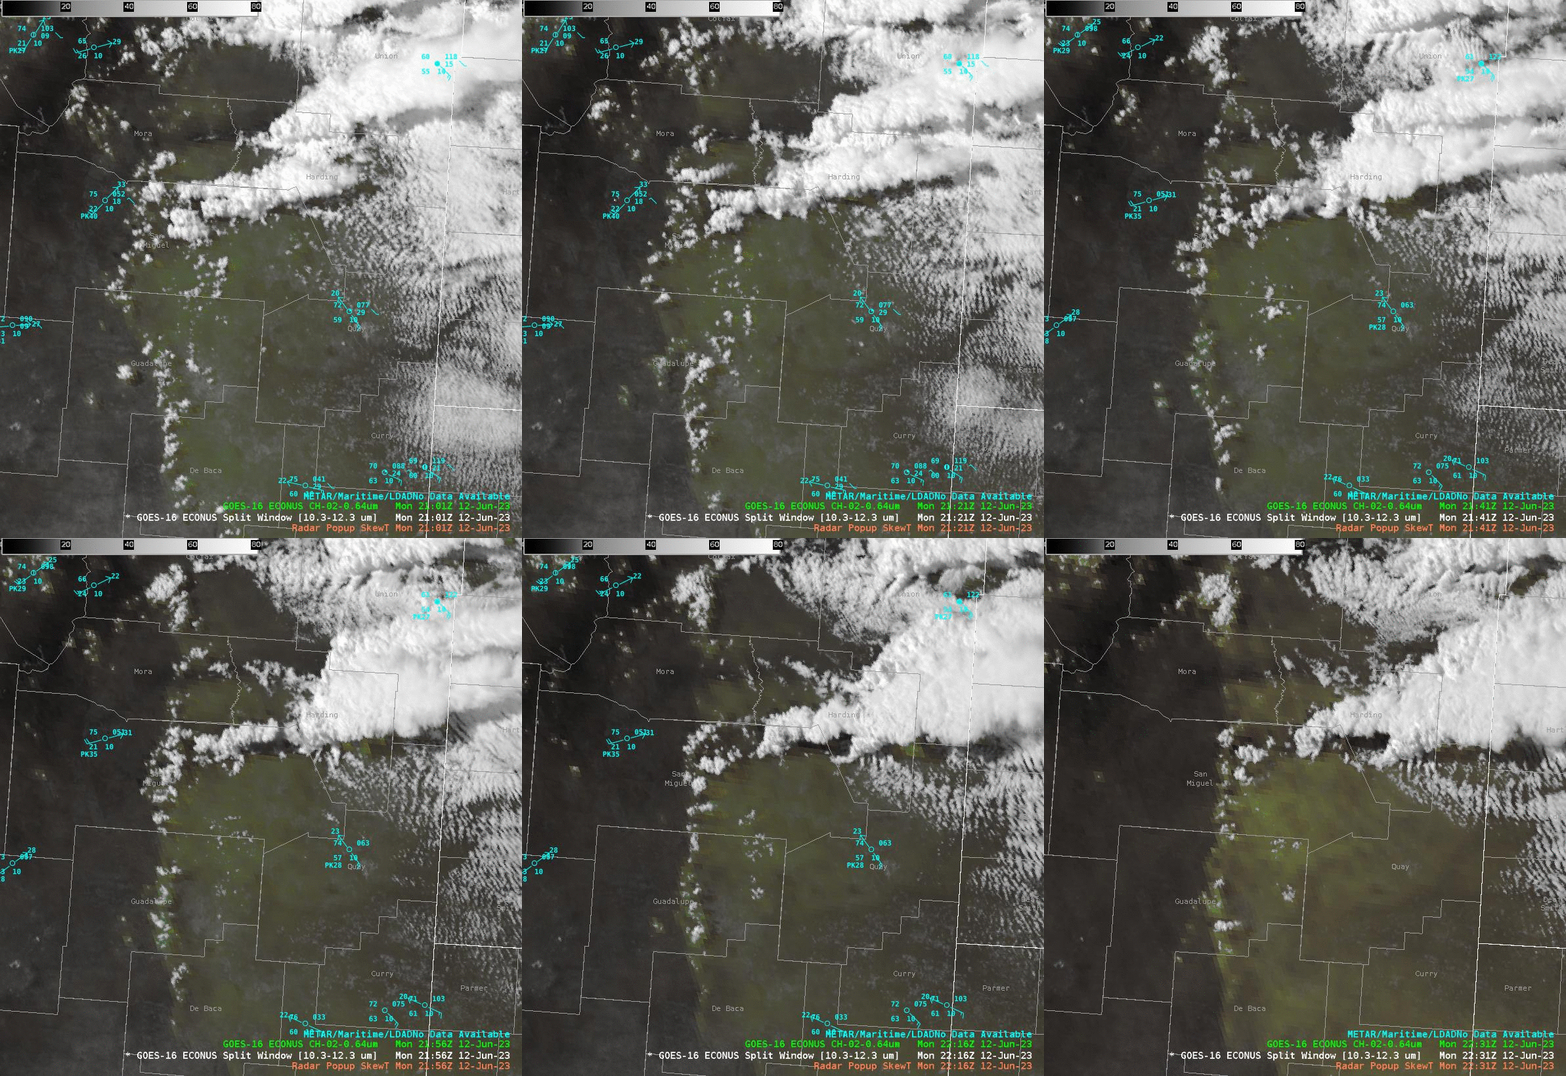
Another display we referenced to assess low level moisture content was GOES “Clean LWIR 10.3um - Dirty LWIR 12.3um” Split Window Difference sandwiched with visible imagery to show current areas of Cu development/maintenance. This showed low level moisture pooling up nicely along higher elevation of the Sangre de Christo Mountains southward to the higher elevations along the western flanks of the southern High Plains, along with agitated Cu at the terminus of these moisture gradients. Additionally, local areas where there were easterly pushes of the moisture gradients suggested dryline dynamics were at play, potentially providing additional forcing for ascent.

After assessing the current state of the environment, we referred to PHS Layer Composite Reflectivity, which is simply just simulated reflectivity offered by the WRF that runs within PHS environment that incorporates latest hyperspectral sounder information on thermodynamics via polar orbiting satellites while merging it with the motion and high spatiotemporal resolution of GOES ABI . The 18Z model run indeed sparked additional convection off of the higher terrain within Guadalupe County.
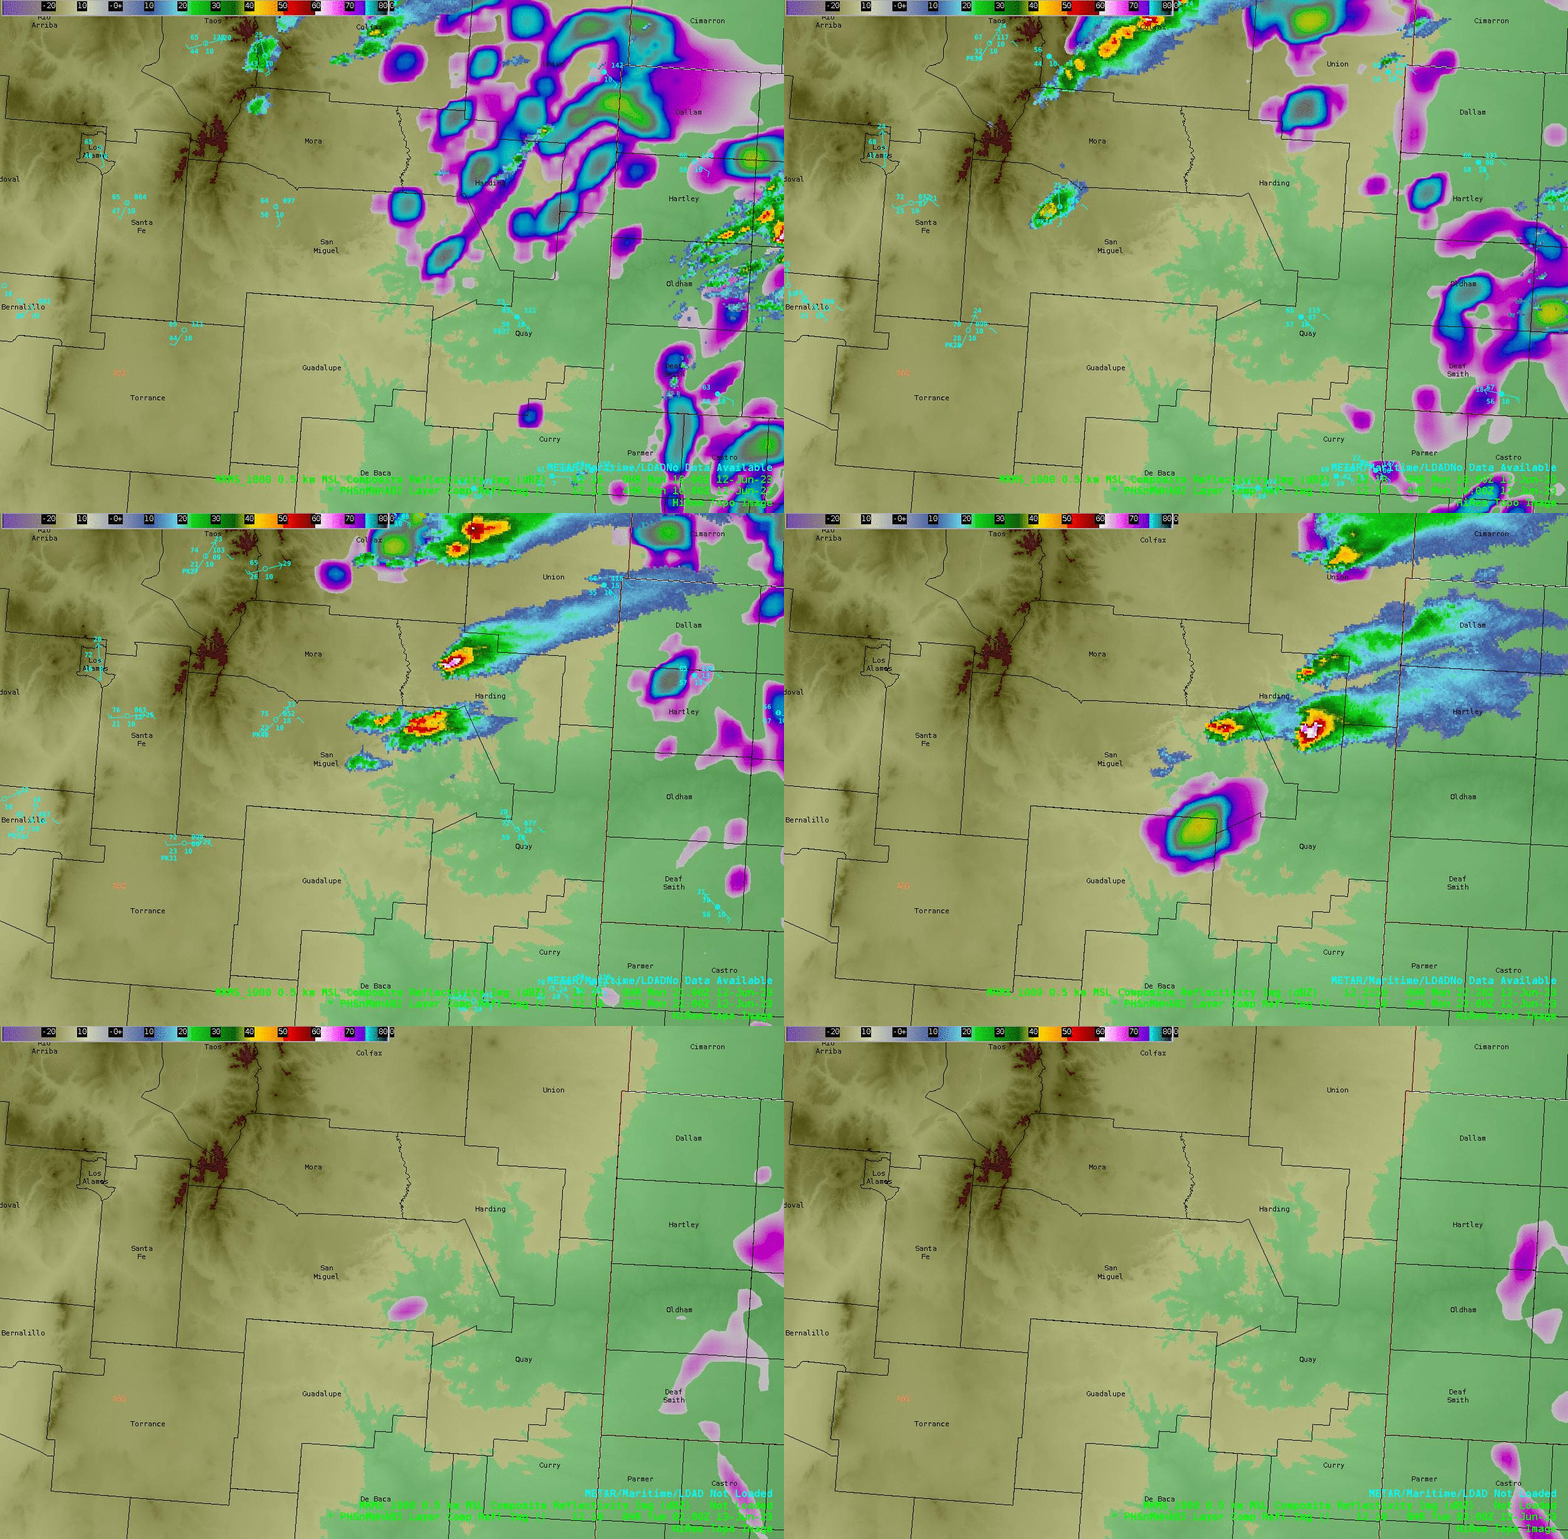
So in the eyes of this model, the potential was still there. It was also nice to compare current radar (in this case MRMS Composite Reflectivity) in the same display as PHS reflectivity to see how the model was performing in this aspect thus far.

But let’s not take this for face value as this is modeled convection. We desired other datasets to help provide insights on the thermodynamic environment that may play a role in allowing additional convection, or lack thereof. With this, we referenced other datasets within PHS:
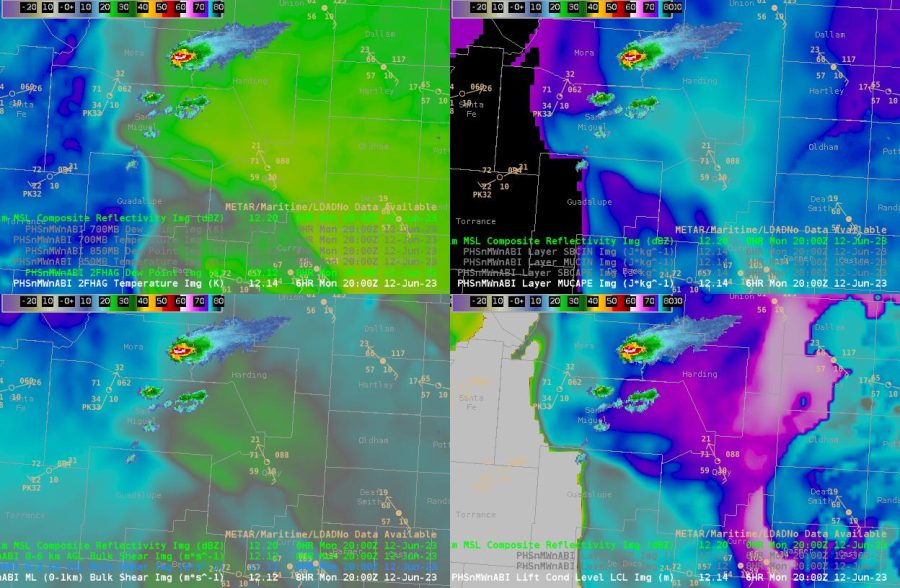
This display shows MRMS Composite Reflectivity and surface observations overlaid with PHS thermodynamic parameters in the top and right halves, and shear parameters in the lower left. Focusing on the two right panels, PHS suggested moderate instability (~1500 - 2500 J/kg) lee of the southern Sangre de Christo Mountains into the southern High Plains of northeastern New Mexico, with perhaps slightly lower instability within Guadalupe and De Baca counties. More interestingly was the stark increase in LCL heights within these counties compared to the environment just to its north. This raised a yellow flag, leading us to to think thermodynamics may not be as favorable as the area with current convection. Perhaps relatively drier air may be located in this area of interest compared to that currently driving convection? We referred to other satellite-derived datasets like NUCAPS soundings, Gridded NUCAPS and NUCAPS-Forecast (not shown) to assess upstream mid level moisture (namely 700 mb RH) advecting into the area, of which reveals a well developed and strong EML with notably strong inversion nested around 700 mb. We also referenced PHS CIN (not shown) which exposed a relatively higher area of capping in this same area where LCLs were higher.

It was nice having the high spatial and temporal resolution offered by PHS when performing mesoanalysis, and in my opinion had an advantage over objective analysis (e.g. SPC Mesoanalysis), with its higher resolution and ability to step forward in time on an hourly basis.

Here is the full loop of this PHS display between 18 UTC to 23 UTC:
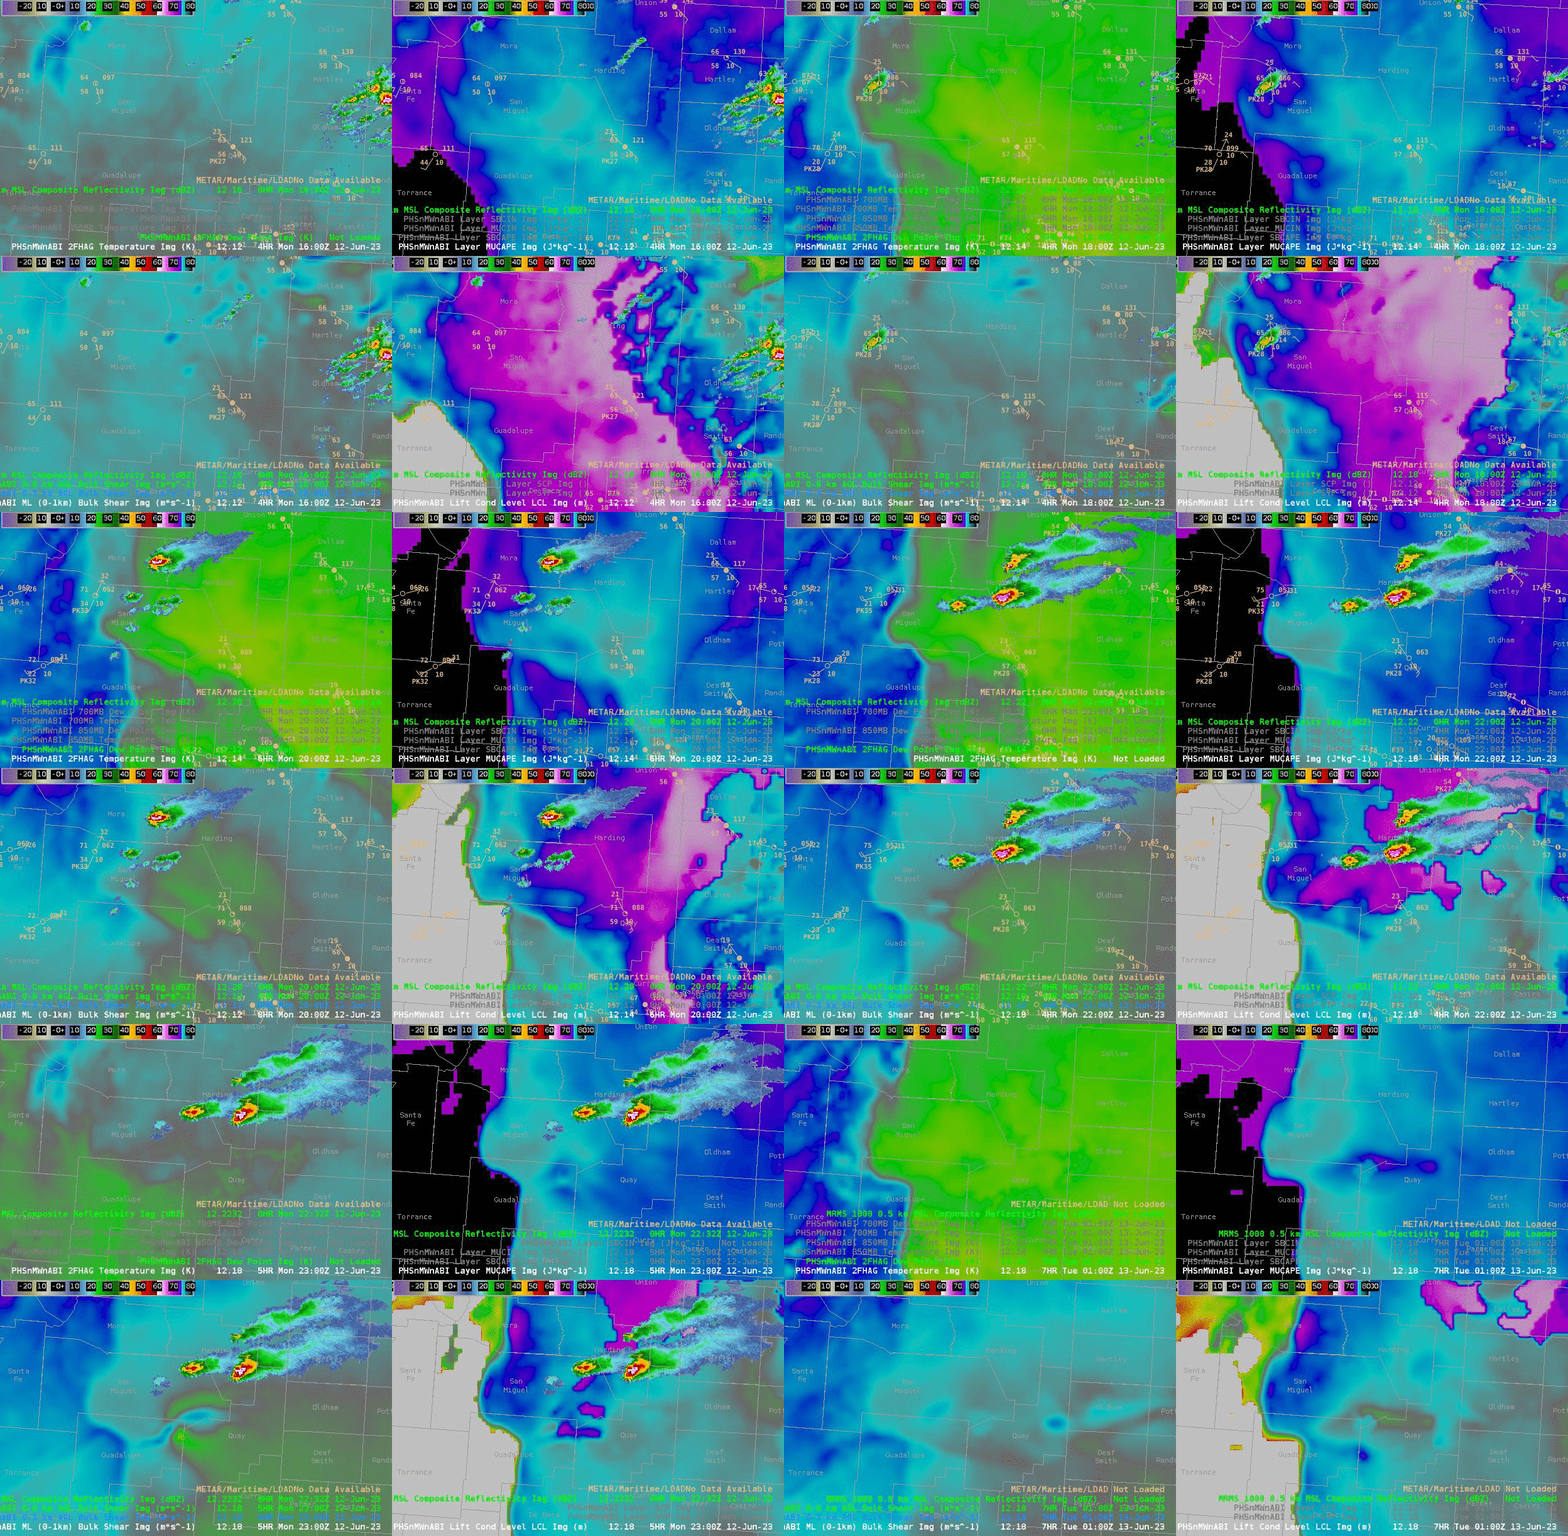
Within our area of interest, the considerations of relatively higher CIN, strong EML advecting over this area, relatively weaker forcing compared to points north, we had some concerns that sustained convection would develop, but we still didn’t discount the possibility should enough subtle forcing via synoptic (DCVA/height falls) and mesoscale (dryline) lift contribute together to overcome locally higher capping likely in place. Ultimately, we gave around a 20-30% chance of additional severe convection within Guadalupe and De Baca counties in the next 1-3 hours starting at 21Z.
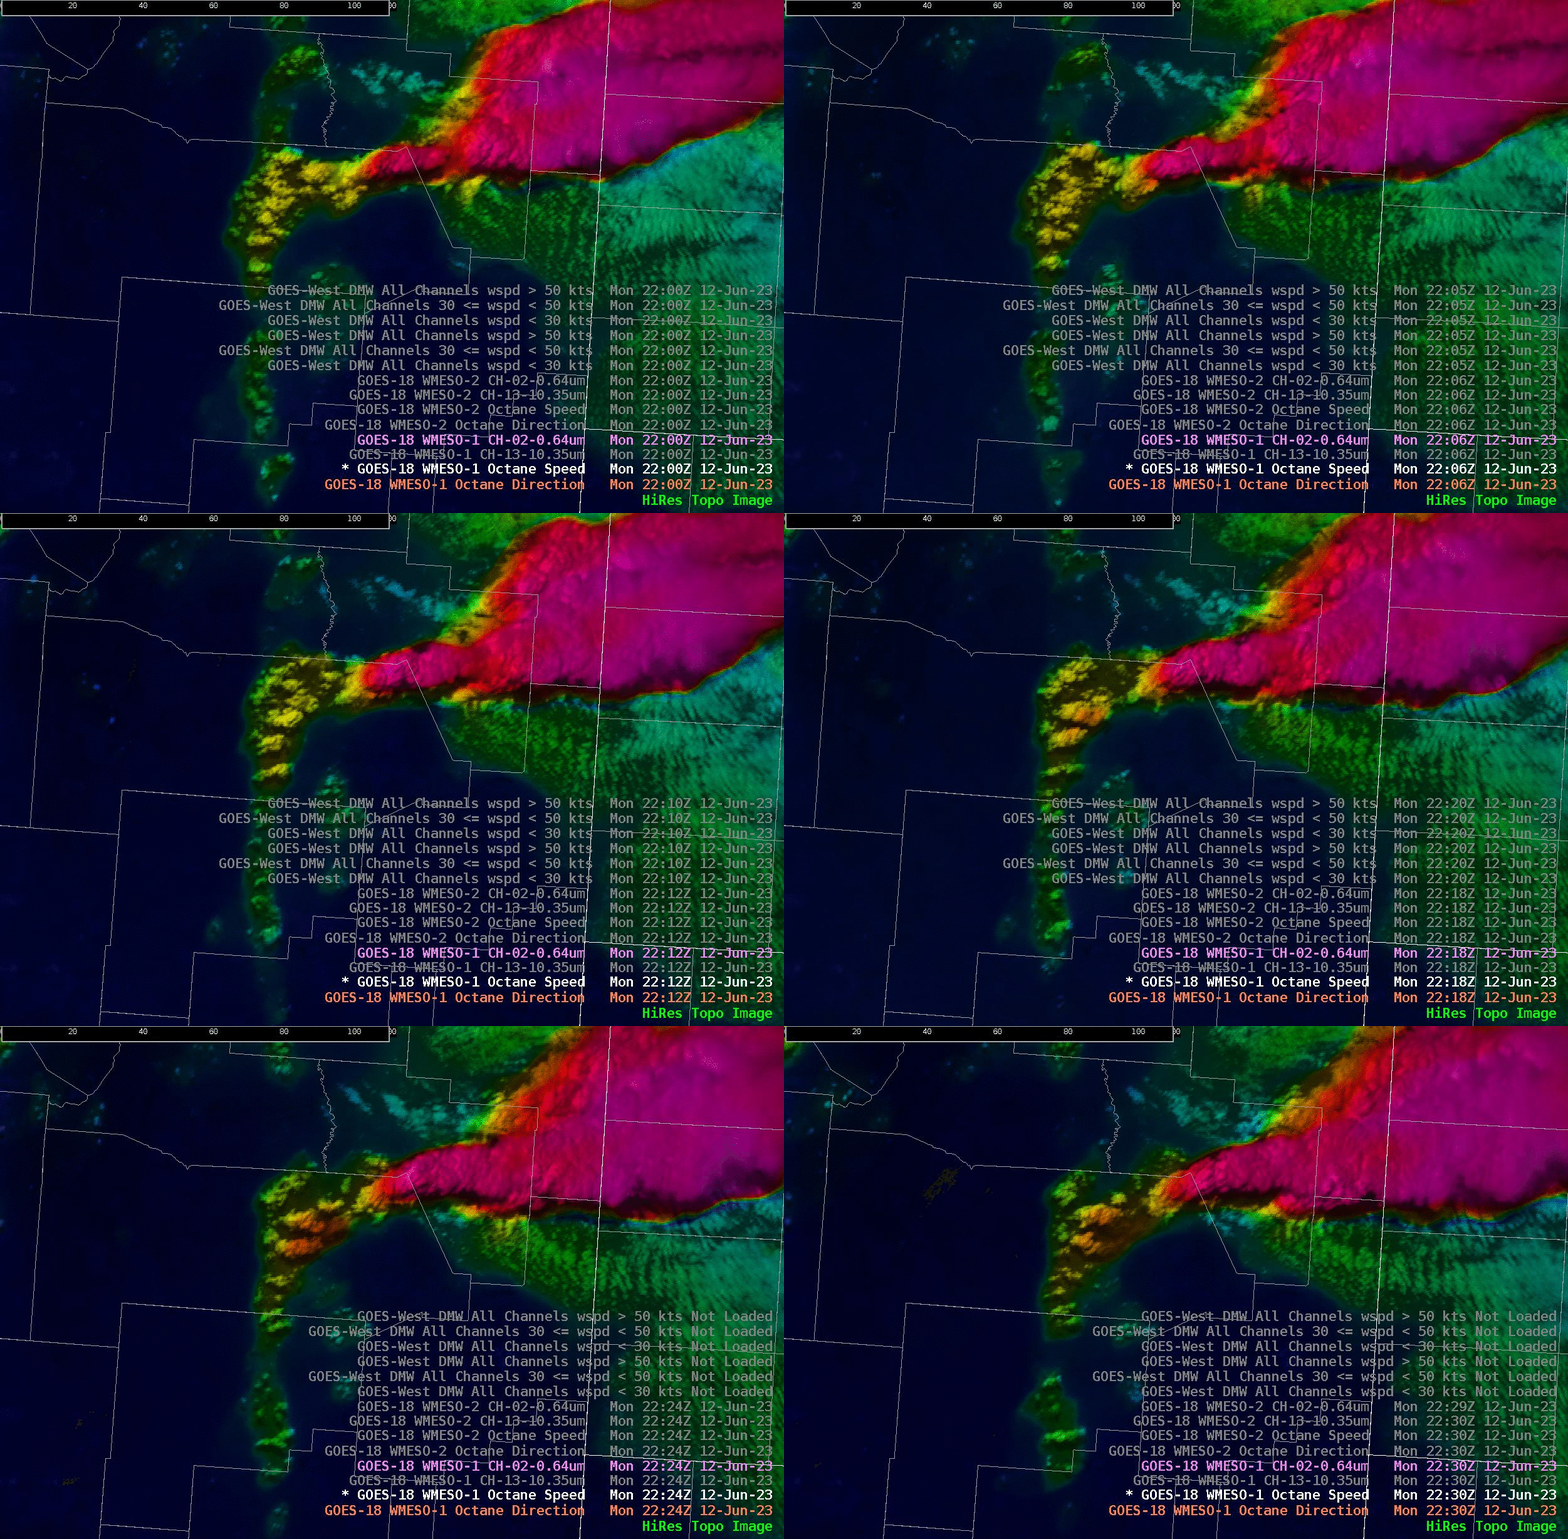
Just before today’s HWT window closed, OCTANE hinted at attempts of deep convection within central San Miguel County via the warming colors collocated with agitated Cu turned orphaned anvils behind exiting deep convection. This was advantageous as it caught our eye perhaps faster than Day Cloud Phase Distinction RGB indicated for attempts at deep convection.

Ultimately, deep convection did not occur within Guadalupe and De Baca counties.

- OSMBLSN     
Thursday, June 8, 2023

CHS OCTANE Orphan Anvils

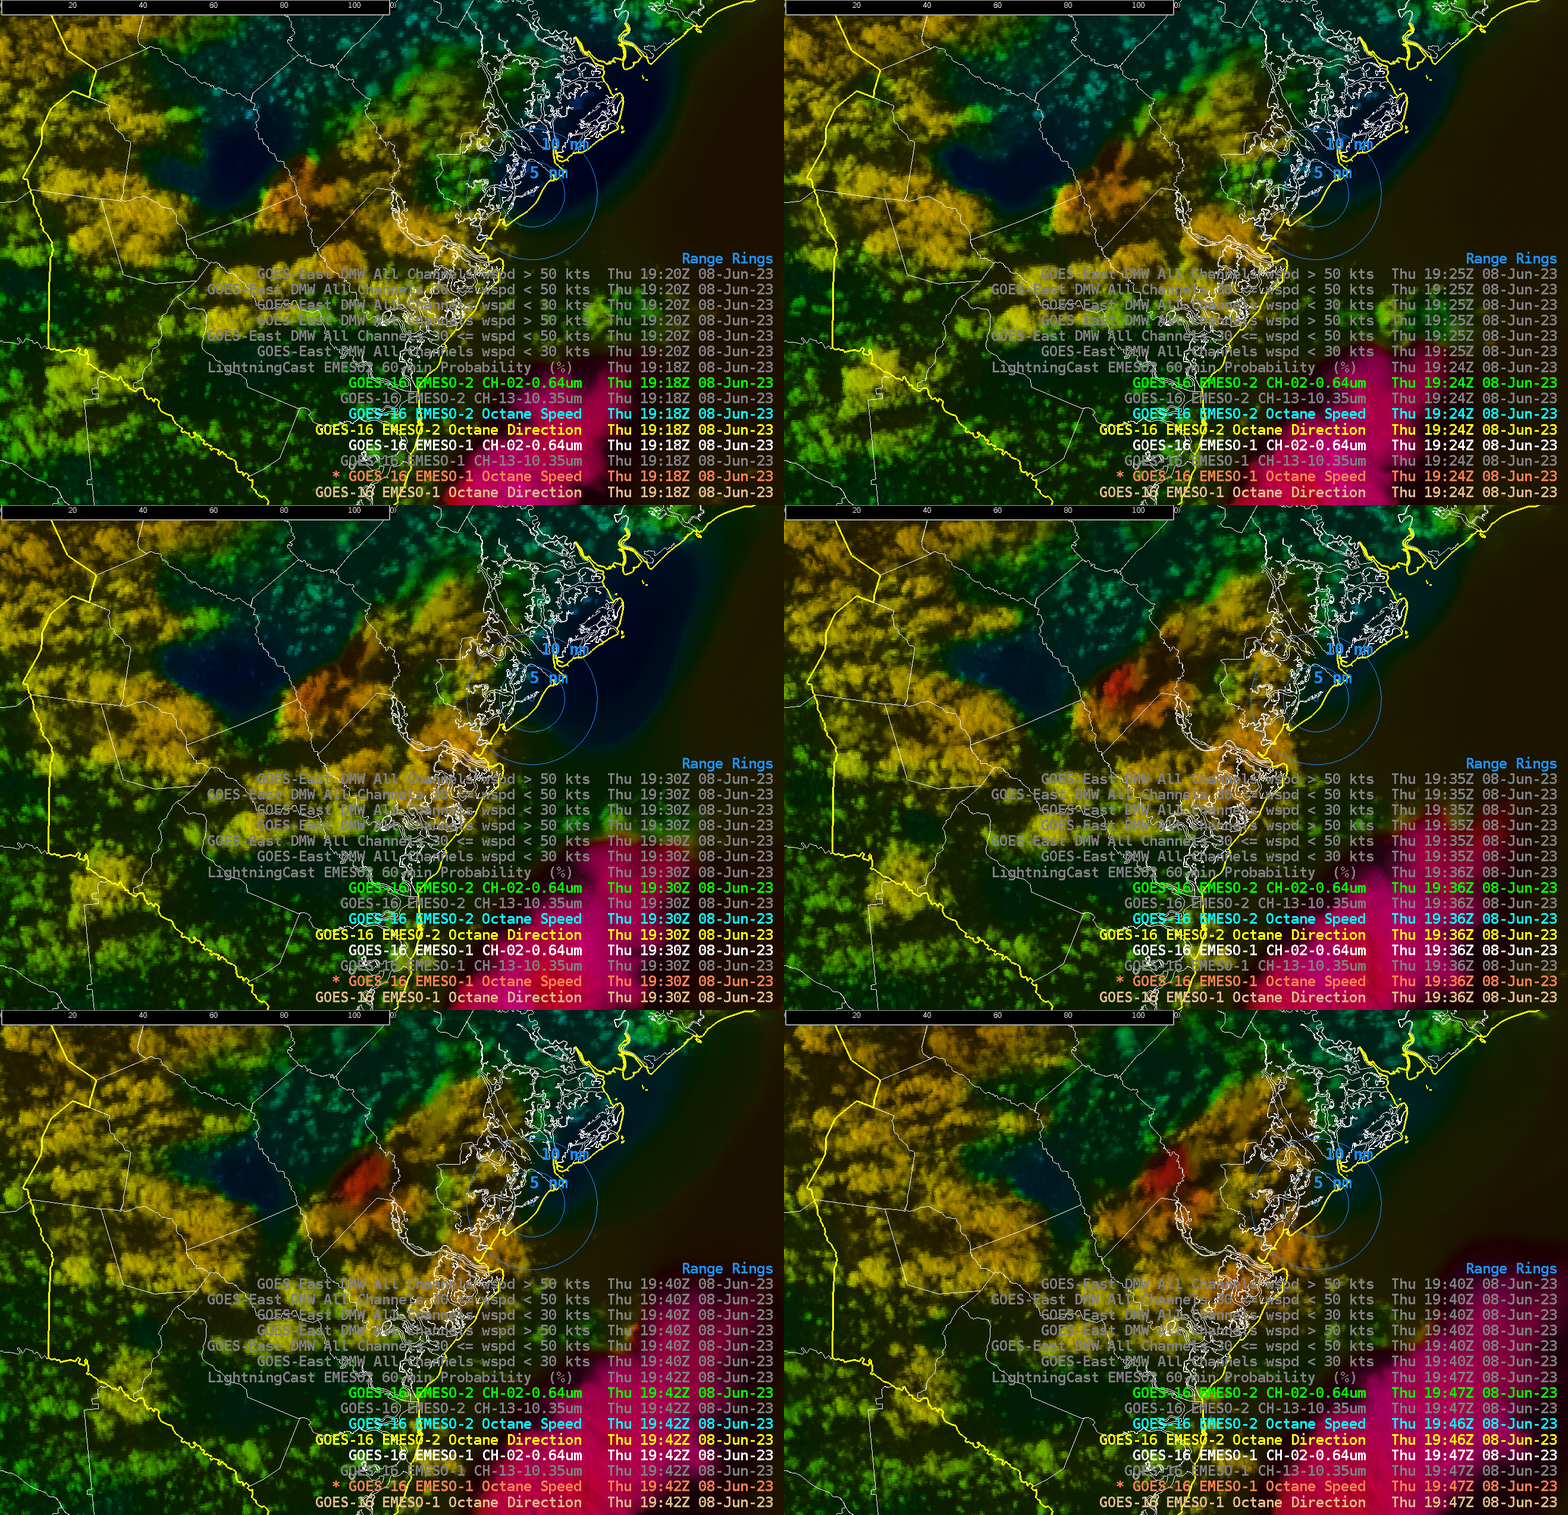
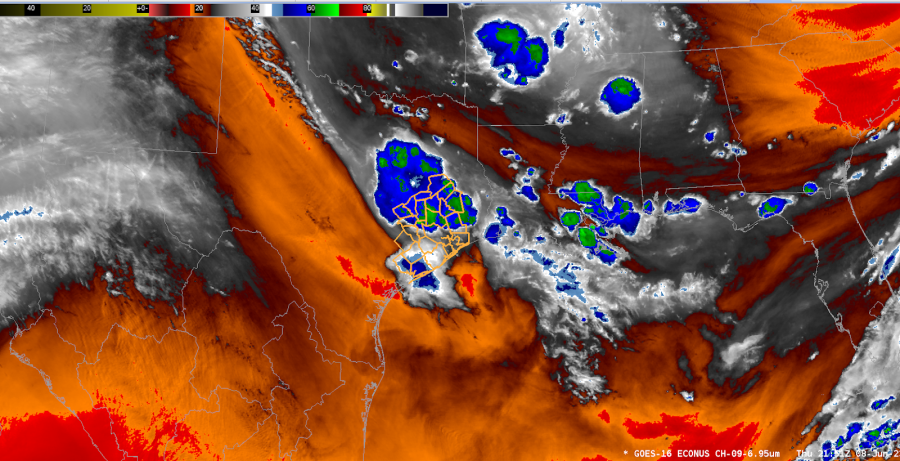
 While watching for convective initiation over the Charleston CWA, we noticed that the deepest convection over land started to produce orphan anvils; two of them during this loop. It made us curious if we could see any precursor in the OCTANE Speed Sandwich RGB to a developing orphan anvil. At the typical color bar range of 0-200, it was minimally visible, but as we shrunk the range, a precursor became more evident. The example here has a range of 0-75. Note the cell in the center of the screen. At the beginning of the loop an orangish reddish color can be seen just before the orphan anvil develops, then a more noticeable color enhancement can be seen as another anvil is about to be orphaned. From a forecaster standpoint, knowing anvils are about to be orphaned can be helpful to know that a particular cell is not likely to intensify and will probably diminish. Although orphan anvils can be seen with the OCTANE Speed Sandwich, orphan anvils still may be better seen in day cloud phase or day cloud type RGBs.

OCTANE Speed Sandwich loop of two orphan anvils developing.

- Burton Guster & Displar

Severe Storms over Central Texas.

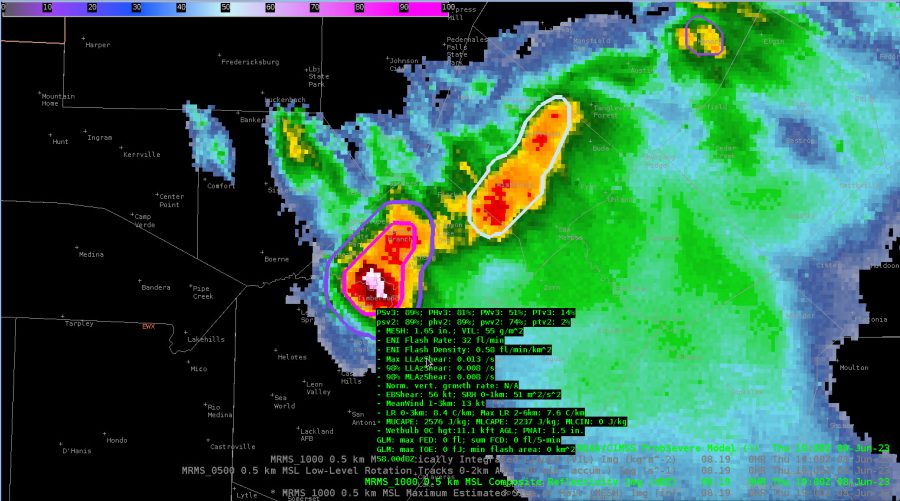
 Storms over northern Bexar and southern Comal have had hail up to golfball size reported. This is in good agreement with the MESH signature. Additionally, Prob hail for both v3 and v2 are up over 80%, so in good agreement with the algorithm.

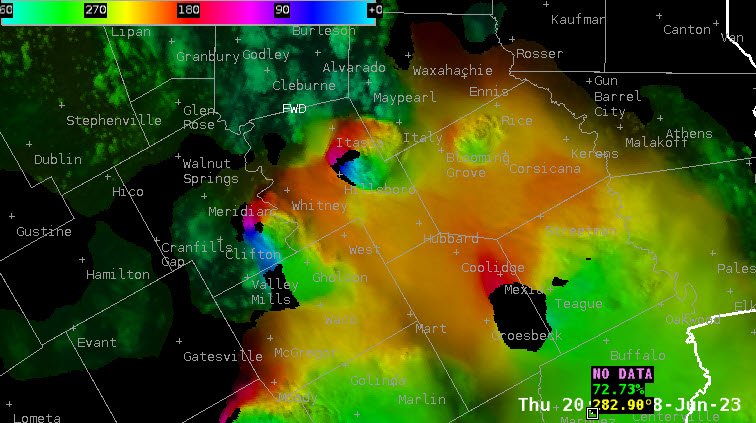
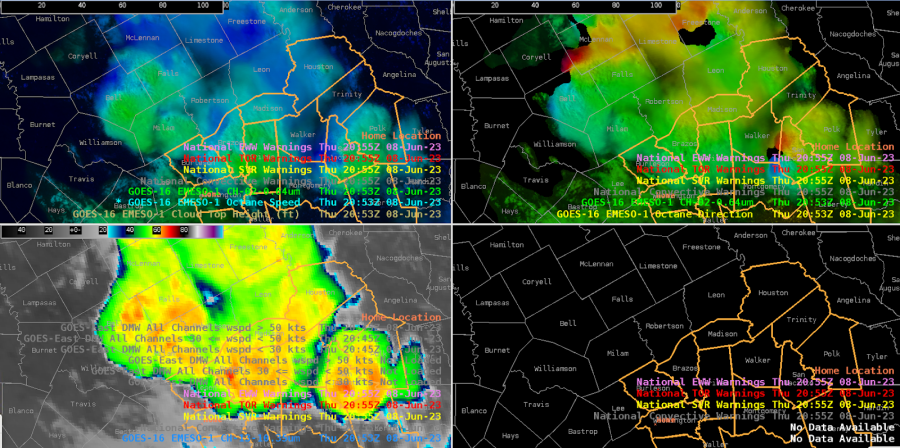
Animation of storms with the latest OCTANE. Looks like storm top divergence can be inferred from 70 kt anvil level winds to the south and 30 knot winds to the northwest. Would equate to strong divergence aloft and indicative of a severe storm.

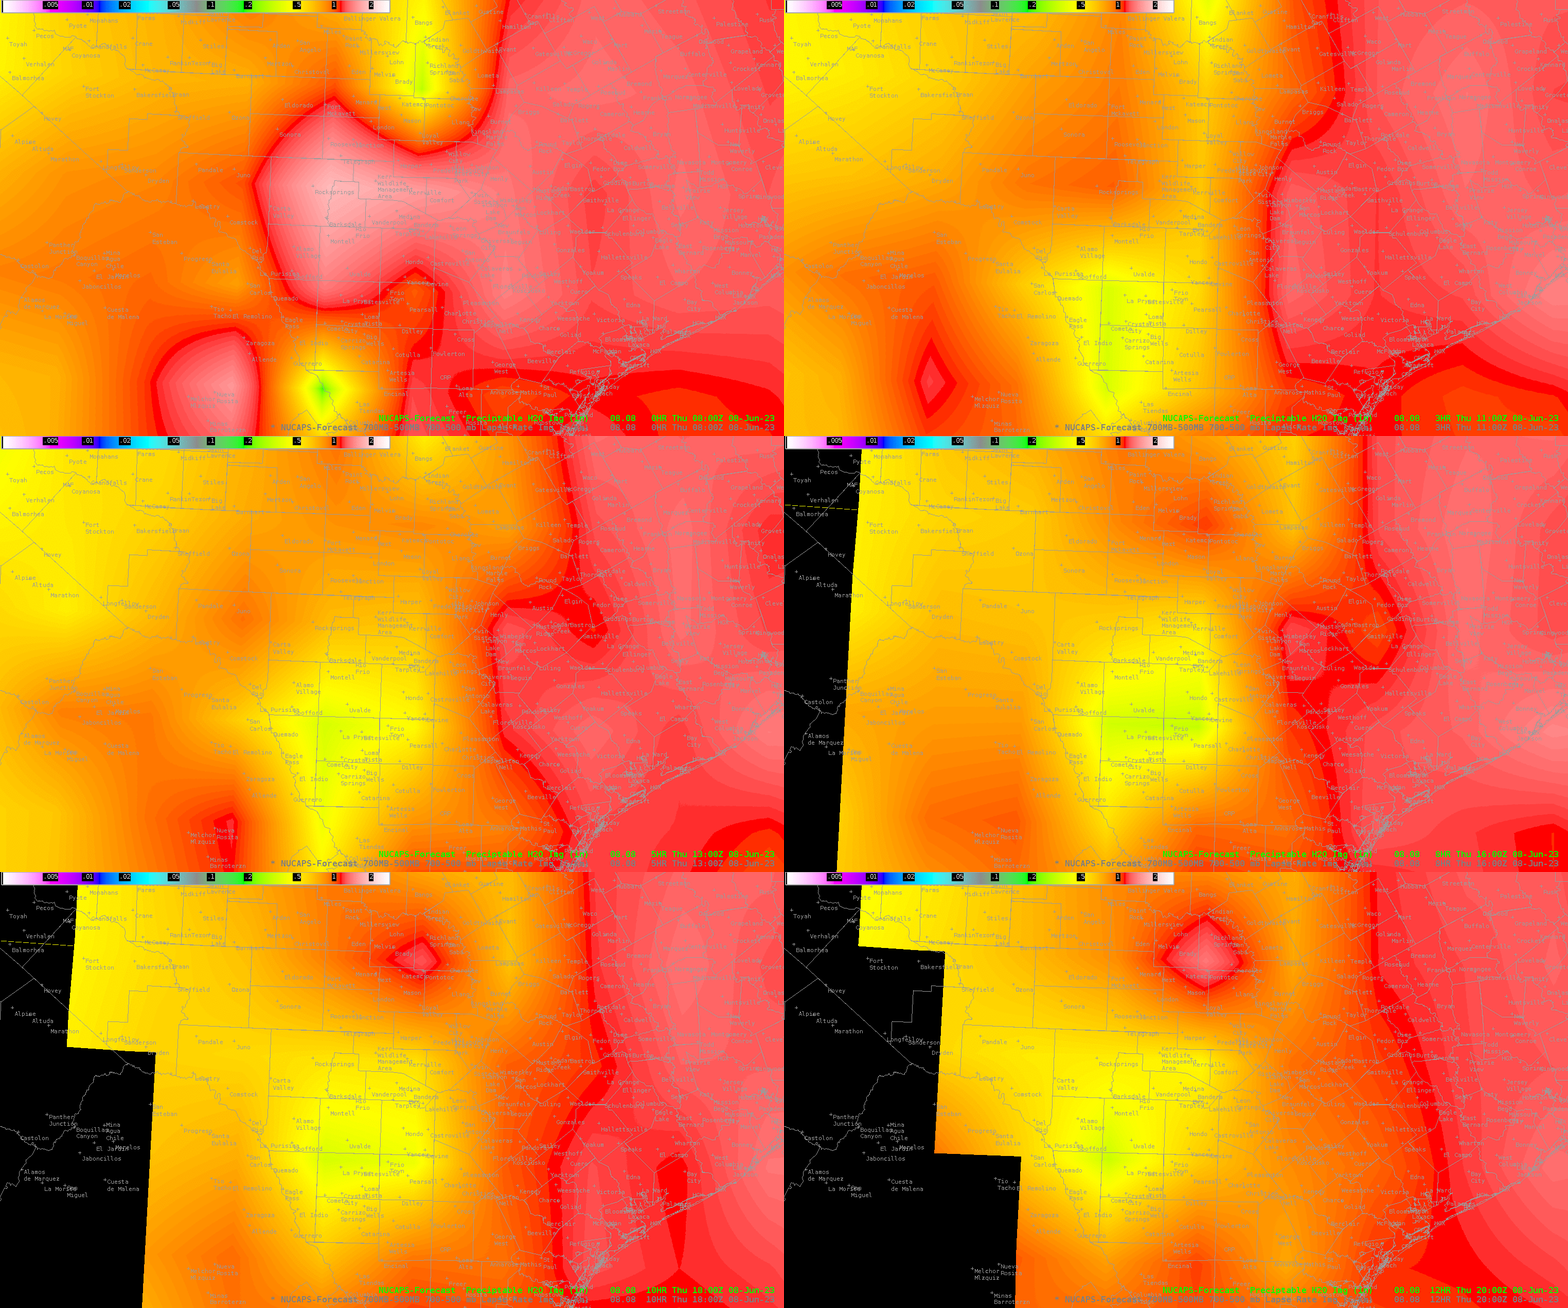
The 08Z Pass of NUCAPS shows a rather impressive PWAT/Moisture gradient this morning, which would likely lead to increased storm chances along the theta gradient over the Hill Country and stretching eastward into the I-35 Corridor. The gradient ranged from 1.25” over the Coastal Plains to .50” over the Edwards Plateau and western EWX CWA.

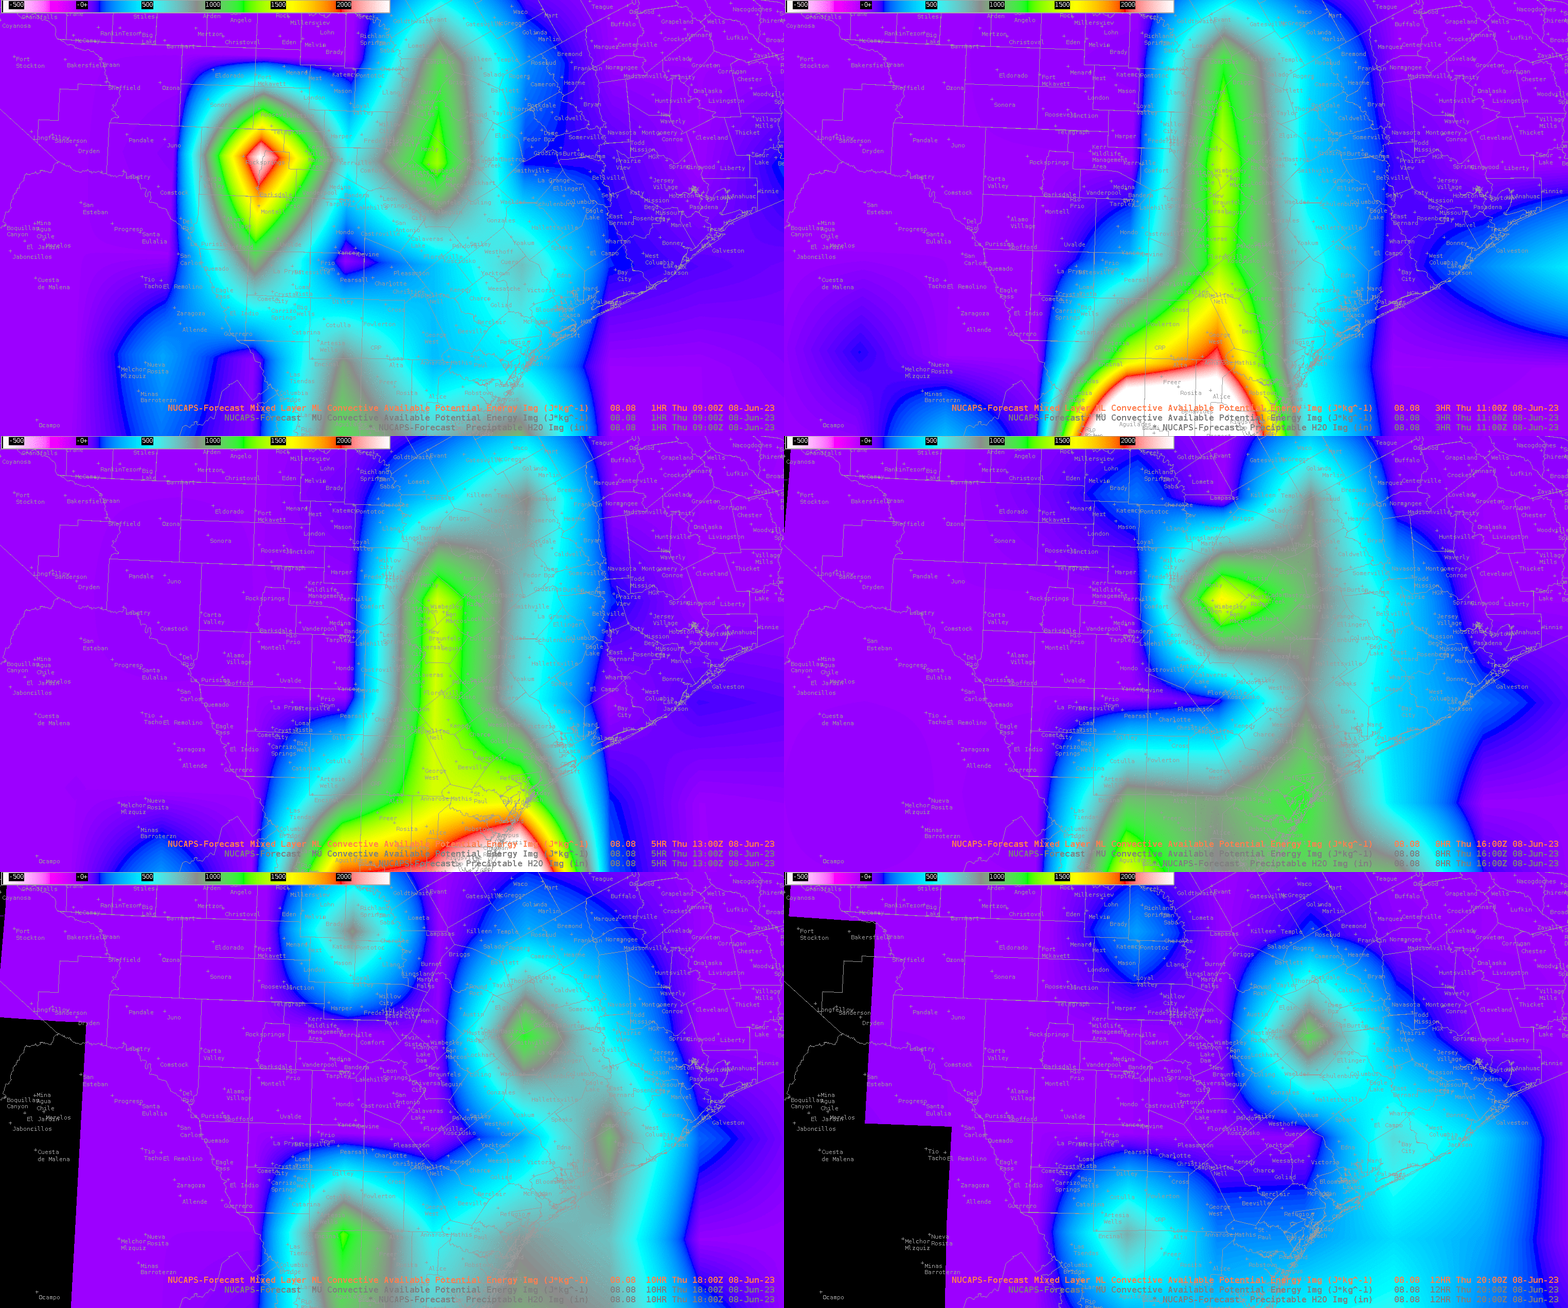
This ties in nicely with the MLCAPE available this morning.

Storms going up in a weaker shear environment with a rainbow color distribution all around the storm from the OCTANE direction window. Very interesting. You may actually be able to infer the type of storm/environmental conditions just based on OCTANE direction depending on the situation.

- Satellite Steve, StormofCentury , Bolt

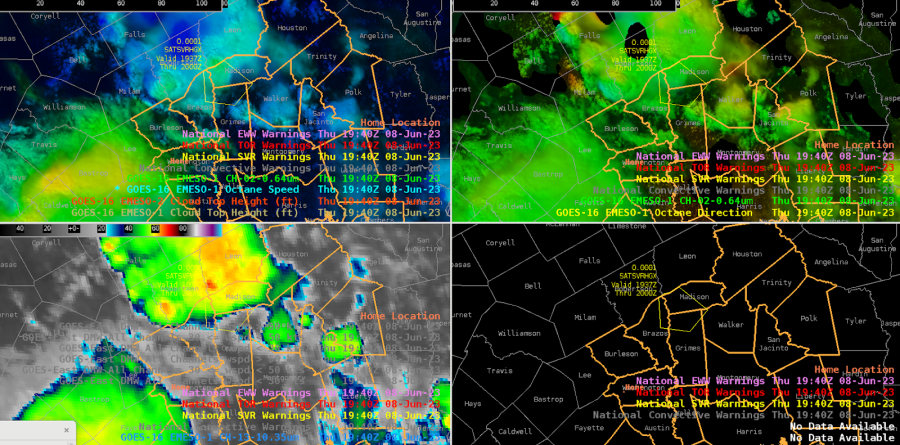
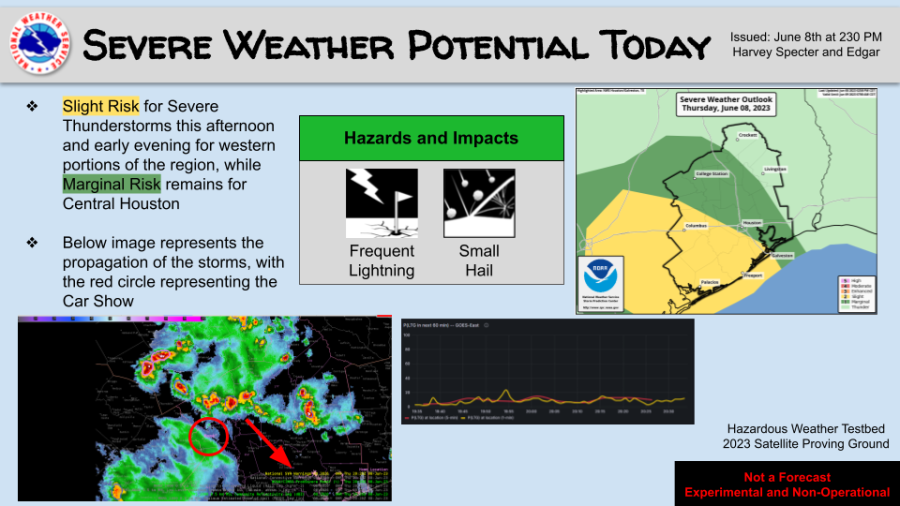
HGX Convection impacting the Car and Truck Show in Burton, TX

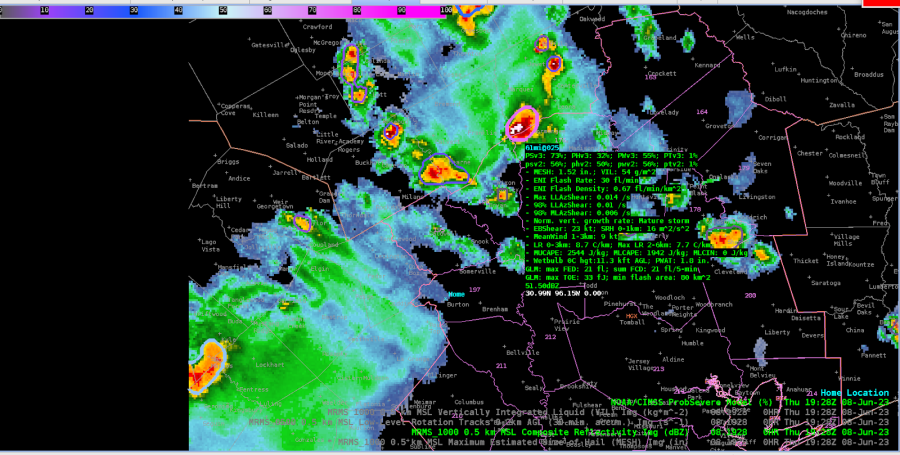
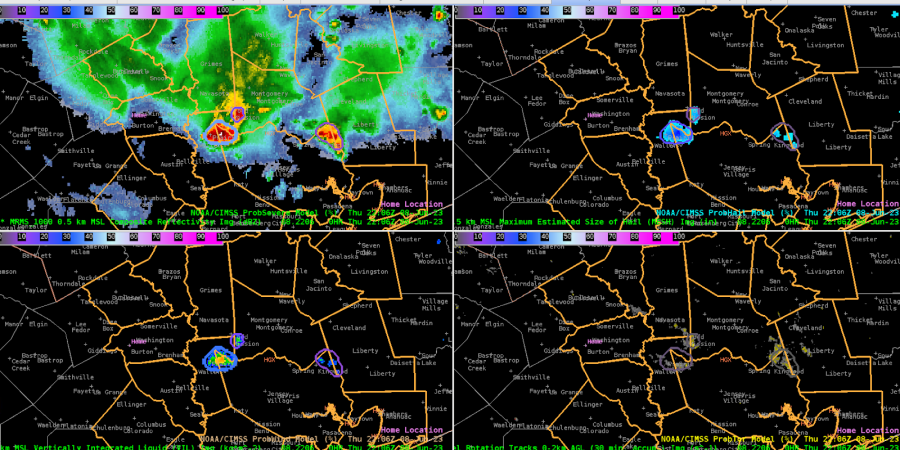
 Initial setup for the HGX vicinity showed several cells to the north and east of the DSS site, propagating southeastward. The strongest cell, pictured below, had a PSv3 of 73%, while PSv2 remained as 56%.

We issued a warning for a northern cell moving into the CWA into Madison county, based on a -70C cloud top brightness temp and PSv3 total prob over 70% (had been climbing from the 50s fairly steadily). But the cloud top shear noted by Octane was not strong (~20-25 kts), so the warning was very borderline. Just a couple scans later, it lost most of its texture on the vis imagery and lost its shear in the Octane direction product. Cloud tops warmed a bit as well.

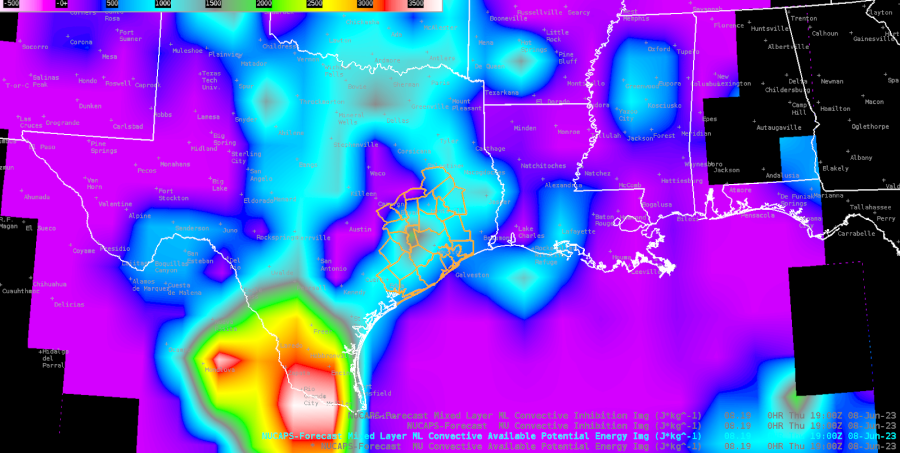
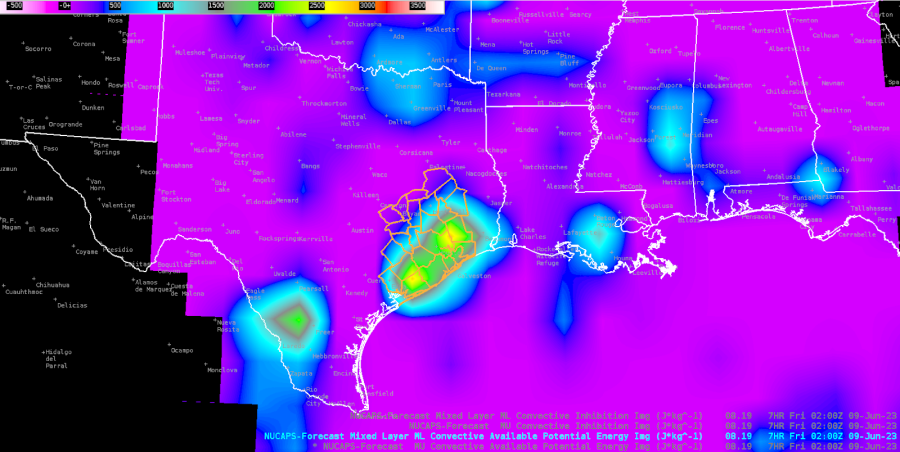
00H NUCAPS-Forecast (NF) is showing moderate CAPE now (1st image below), which may help explain the messy sub-severe multicell clusters, but the forecast valid at 02z this evening shows a resurgence in the CWA (2nd image below).

Looking to our NW, one of the stronger cells is outside our CWA, but the Octane direction is showing good cloud top diffluence.

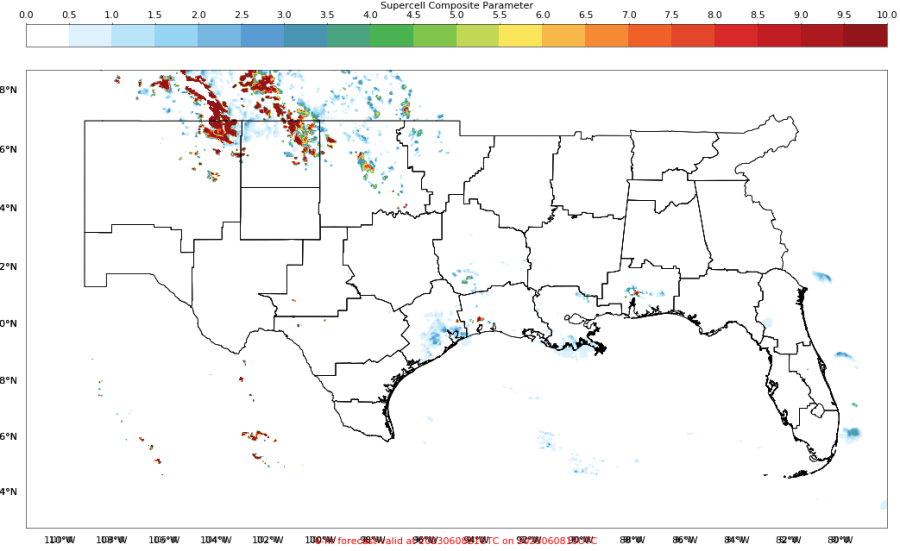
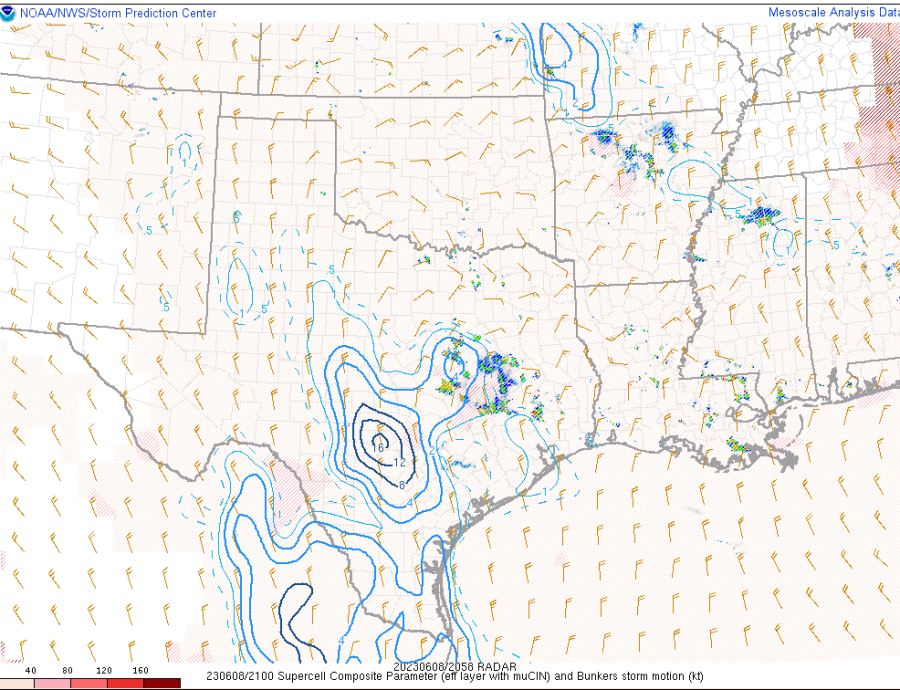
The PHS SCP forecast valid at 20z looks to be around 2-4 over our area, although this doesn’t match well with the SPC meso page SCP, which focuses high values W of our CWA.

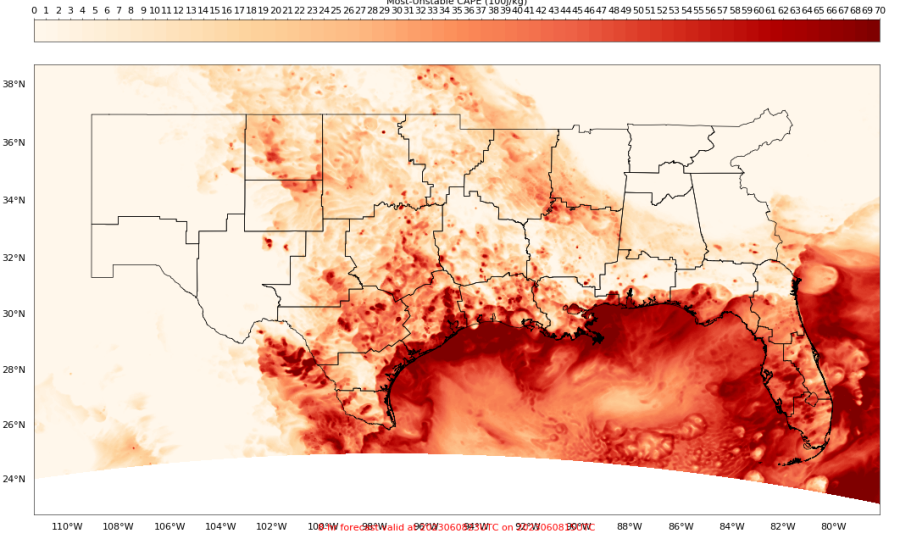
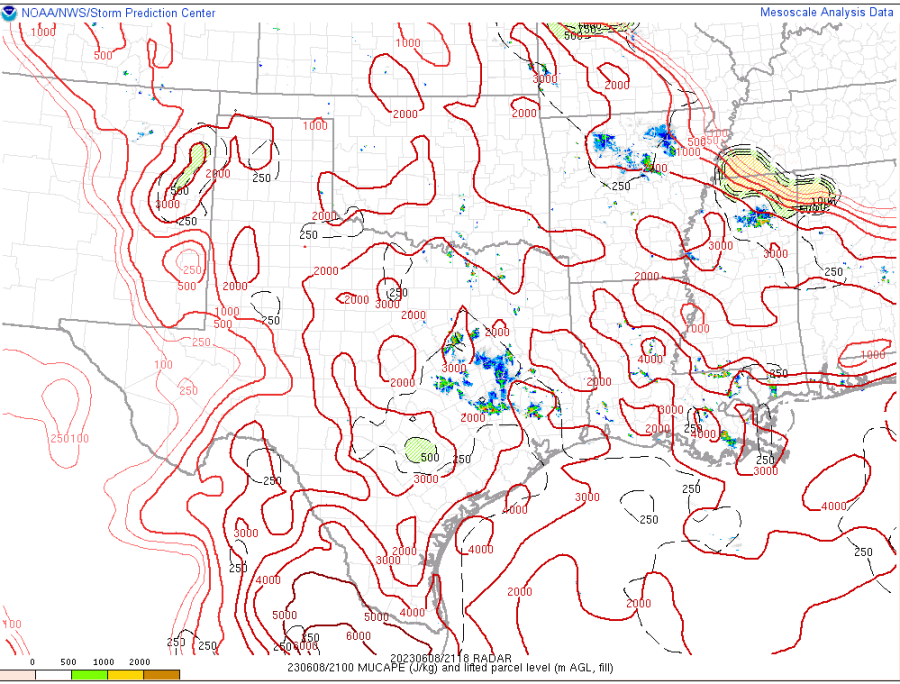
The 21z PHS MUCAPE (15z run) looks like it has insane values of 6000-7000 J/kg near the coast and just offshore. This is much higher than the SPC meso page, showing 3000-4000 J/kg at most.

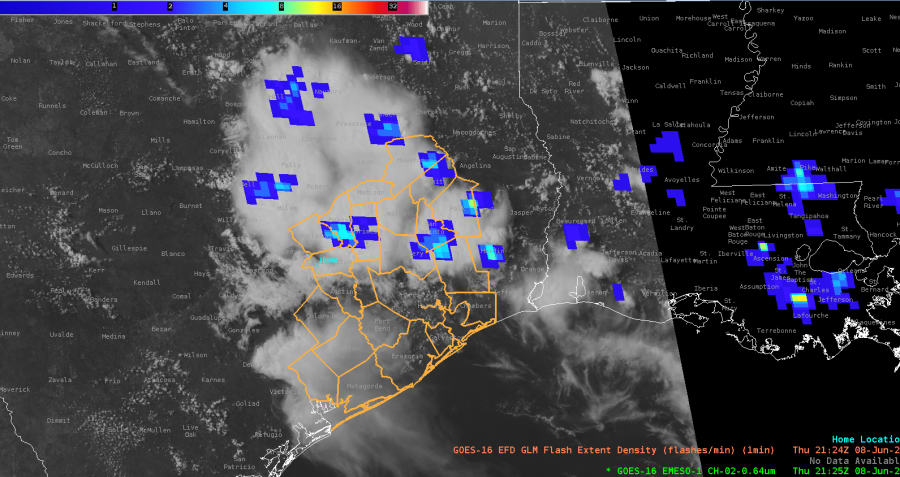
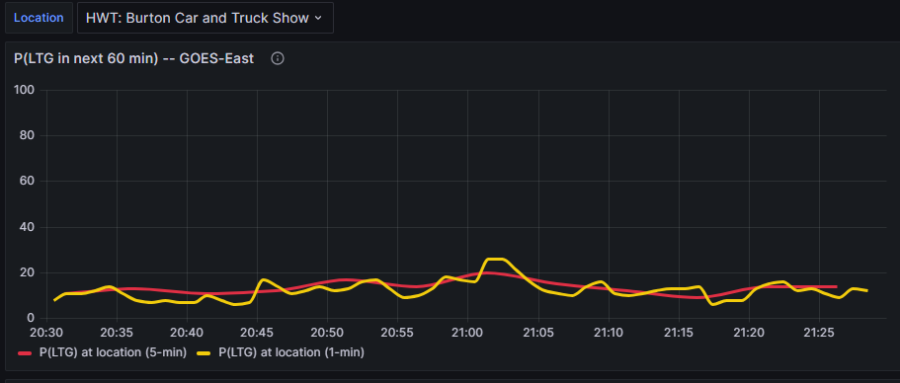
Looking at the optimal application of LightningCast, it seems that the point-based meteogram would work best for CI and in situ developing convection, versus storms propagating into the area. In our case here, at the DSS site, the point-based LC probs are low, suggesting little concern. But we can see from the GLM FED data that there are mature cells with lightning just to the NE that will probably move near the site in the next hour, which certainly poses a safety concern.

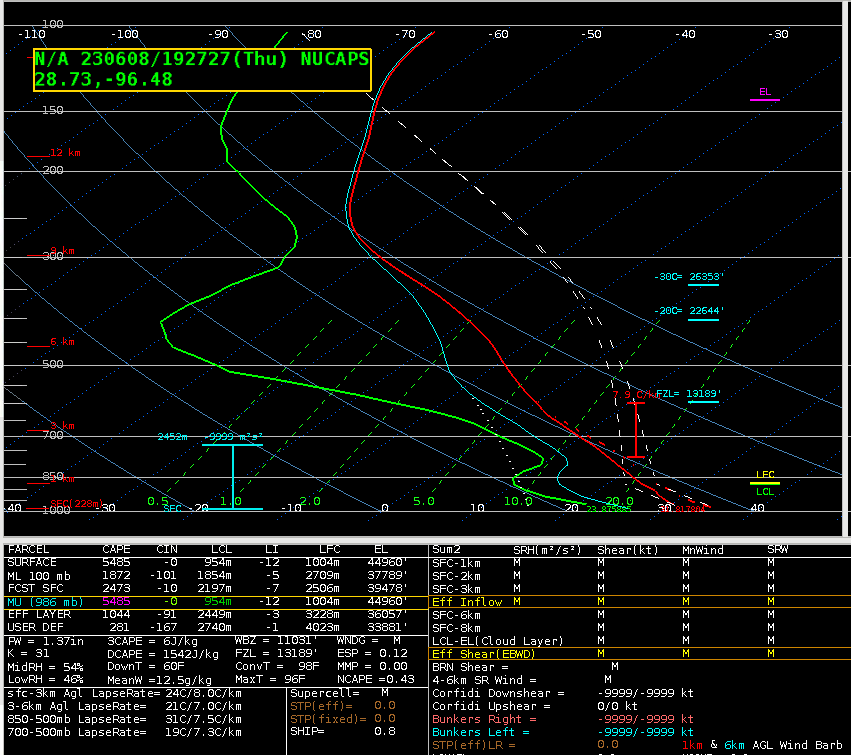
The NUCAPS sounding near Victoria (far SW CWA) showed a lot of CAPE and DCAPE, but a rather dry profile. This is confirmed by WV imagery over much of far S TX.

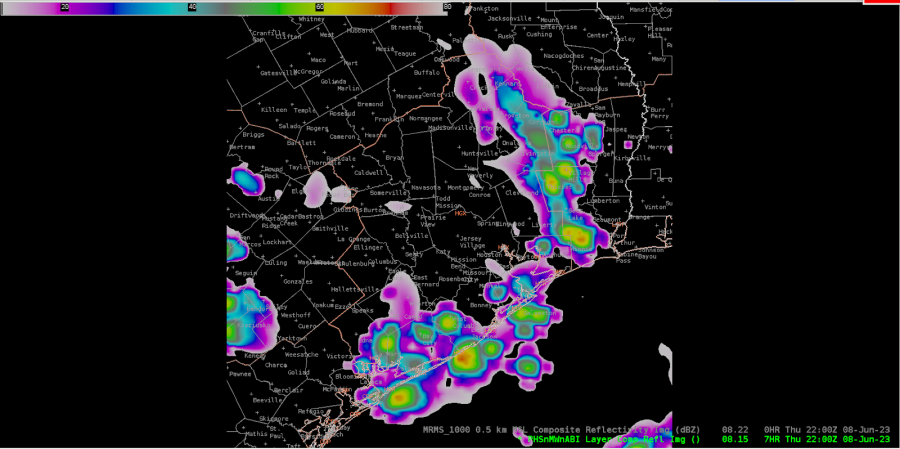
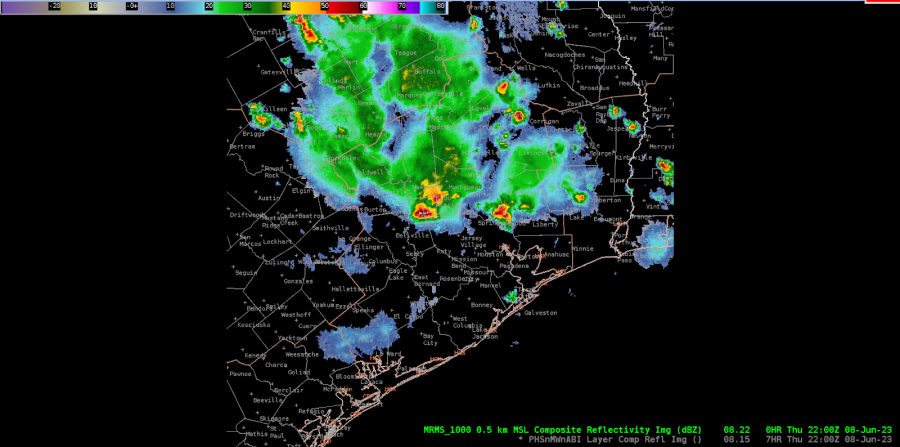
22z PHS Composite Reflectivity (above image) compared to 22z MRMS Composite Reflectivity (below image ) depicting PHS struggling on timing as the cluster of thunderstorms propagate from northwest to southeast.

Late in the event, this cell is showing slow strengthening on PS -- currently both v3 and v2 have 40% total.

- Edgar and Harvey Specter

Monitoring lightning in Texas

Our teams in Texas are monitoring for severe storms and lightning at two DSS events: the "Come and Take It!" Celebration, in Gonzales, TX (point A in Figure 1), and the Burton Car and Truck Show, in Burton, TX (point B in Figure 1).

Figure 1: ProbSevere LightningCast probability of lightning contours (blue=10%, cyan=25%, green=50%, magenta=75%), GOES-16 ABI daytime cloud phase distinction RGB (background), GOES-16 GLM flash-extent density (orange foreground).

The LightningCast time series at the "Come and Take It!" Celebration is showing an upward trend in lightning potential (Figure 2, top panel). There have been a few anvil flashes within 10 miles already, as observed by ENI (bottom panel).


Figure 2: Meteograms of LightningCast probabilities (top panel) and observed lightning (bottom panel) for a DSS event in Gonzales, TX.

ProbSevere v3 showing improvement

While the HWT forecasters didn't operate in North Dakota or South Carolina yesterday, I wanted to document several cases where Probsevere v3 (PSv3) was making improved predictions of severe weather, relative to ProbSevere v2 (PSv2).

In eastern North Dakota, very modest shear under a ridge helped these storms to get a little organization. Though PHv3 and PWv3 are rather low, the overall PSv3 probability was 44%, compared to PSv2 of 14%. Soon after the image in Figure 1, golf ball-sized hail was reported. In this storm, the low effective shear and lightning flash rate (12 fl/min) were hurting PSv2, while the MESH, ENI flash rate, low-level lapse rate (8.7 C/km), and decent mid-level azimuthal shear were the top contributors to the probability of severe. 

Figure 1: ProbSevere contours, MRMS MergedReflectivity, and NWS severe weather warnings.


A little further west and about an hour later, another storm showed a nearly 40% difference between PSv3 and PSv2 (50% vs. 13%). Despite a better flash rate and 1" of MESH, PSv2 was again hampered by low effective shear. Similar to the previous storm, the low-level lapse rate, MESH, and flash rate were helping PSv3. But in this storm, a strong satellite growth rate (not displayed in Figure 2) was the 5th leading positive predictor. Soon after the image below, there were two reports of semi-trucks blow over. Interestingly in this storm, the GLM flash rate was very low (1 fl/5 min) compared to the ENI flash rate (34 fl/min). This is another example showing how using data fusion helps create a more robust probabilistic model---when one data source is suspect (for whatever reason), others pick up the slack. We have also seen storms where GLM flash rates are much higher than ENI flash rates.

Figure 2: As Figure 1, but for a second North Dakota storm.


Several storms in South Carolina were showing some good improvement as well. A storm entering western South Carolina was pegged at 35% in PSv3, while only 3% in PSv2, owing to low MESH (0.47 in), low shear (~20 kt), and low/modest ENI flash rate (16 fl/min). In PSv3, a combination of good satellite growth (the growth rate was older, so not displayed in Figure 3 readout below, but still used in the model computations), modest reflectivity-based parameters, and a solid low-level lapse rate (9.1 C/km) combined to produce the 35% probability of severe. Reports of multiple trees down came in soon after this image.

Figure 3:  As Figure 1, but for a storm on the South Carolina /  Georgia border.


Further east, a similar story, with PSv3 13% greater than PSv2 (43% vs 30%). Dozens of trees and powerlines were down from this storm. The probability of wind was much higher than the probability of hail in v3.

Figure 4:  As Figure 1, but for a storm in central South Carolina

An analysis that was provided in the training slides for PSv3 showed that improvement was greatest in the moderate MLCAPE and modest/moderate effective shear regimes, which these storms fit into. One other point to note is that while ProbSevere v2 is often higher on very strong and mature storms, we've seen that quite frequently, ProbSevere v3 ramps up in probability sooner than v2, which we feel is a very important distinction and improvement. While not explicitly shown in the animation in Figure 5, v3 was again a little ahead of v2 in these storms in southwest Texas, where one team of HWT forecasters was working.

Figure 5: An animation of ProbSevere v3 contours, MRMS MergedReflectivity, and NWS severe weather warnings.

LightningCast for DSS at HWT

Several forecasters at the HWT were using the ProbSevere LightningCast meteograms to help inform communication and decision-making in simulated DSS events.

In Albuquerque, NM, we simulated their famed International Balloon Fiesta. Several areas of terrain-based convection were in the vicinity, when agitated cumulus clouds started heading toward the event from the southwest (Figure 1; red dot is the event location). Despite partial obscuration of the boundary layer clouds from upper-level outflow of another cell, LightningCast could still "see" the growing cumulus clouds and gradually increased the probability of lightning in the next 60 minutes, with a rapid rise in probability from 20:55 to 21:00 UTC (see Figure 2). The first flashes within 10 miles were at 21:23 UTC.

Figure 1: LightningCast probabilities of lightning in the next 60 minutes (contours), GOES-18 ABI daytime cloud phase distinction RGB (background), and GOES-18 GLM flash-extent density (foreground). Red dot is location of the Albuquerque International Balloon Fiesta. 


Figure 2: Top panel: LightningCast probability time series for GOES-18 5-minute (purple) and 1-minute (green) sectors; Bottom panel: Time series for ENI lightning (orange) and GOES-18 GLM flashes (blue).


Near Boise, ID, the DSS location was the American Aquarium Concert. A weakening upper low still supported sufficient deep-layer shear to produce strong storms heading for the concert from the east-southeast (Figure 3). As the storms edged closer, the probability of lightning continued to increase gradually, until a rather rapid increase from 21:45 to 22:15 UTC, from 20% to 80% (see Figure 4), as the anvil of the storm and some adjacent cumulus clouds moved right towards the event location (red dot in Figure 3).

Both GOES-East and GOES-West captured the increasing lightning potential at the simulated DSS event about 20-25 minutes prior to the first flash within 5 miles of the event. HWT forecasters at one point noted that the probabilities in AWIPS were not lining up exactly with the probabilities in the time series tool. We explained that in AWIPS, the contours are parallax-corrected, while the time series LightningCast data are not corrected. Based on their feedback (and that of other forecasters), we aim to provide parallax-corrected data in the time series capability very soon. 

We hope these cases illustrate the potential benefit of using an on-demand time series capability where lightning potential can be quickly ascertained, for both lightning initiation and advection scenarios.

Figure 3: LightningCast probabilities of lightning in the next 60 minutes (contours), GOES-18 ABI daytime cloud phase distinction RGB (background), and GOES-18 GLM flash-extent density (foreground). Red dot is location of the American Aquarium Concert in Boise, ID.

Figure 4: Meteograms of LightningCast probabilities (top panels) and lightning observations (bottom panels) for GOES-East (left) and GOES-West (right), centered at the American Aquarium Concert simulated DSS event.


Wednesday, June 7, 2023

Albuquerque HWT

 Storms are exhibiting some decent shearing aloft over NW New Mexico when comparing to NE New Mexico. Something I might not have noticed had I not had this product as I don’t always have time to go into the SPC mesoanalysis and check various levels of shear values. The 0-8km shear values are in the 40-50 kt range, in agreement with the range of values noted on the speed shear values of OCTANE. See below.

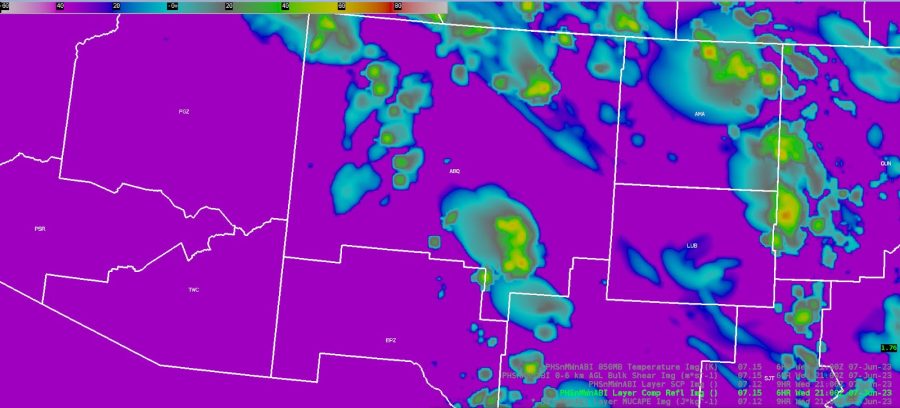
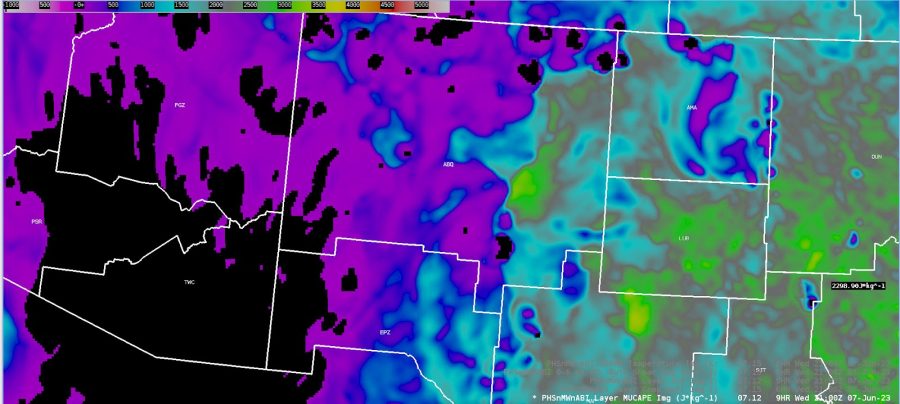
PHS really doing a nice job of pointing out peak areas of MUCAPE and where storms will likely develop. Decent scale and resolution results in some good quality comparisons with various other products. This is over the southern ABQ CWA.

Forecast Layer Comp Refl 21Z

Forecast MUCAPE 21Z

Forecast MUCAPE 23Z - Also, noting a sharp gradient in MUCAPE values as convection strengthens over east-central New Mexico late this afternoon into the early evening hours. We will have to see how this plays out.

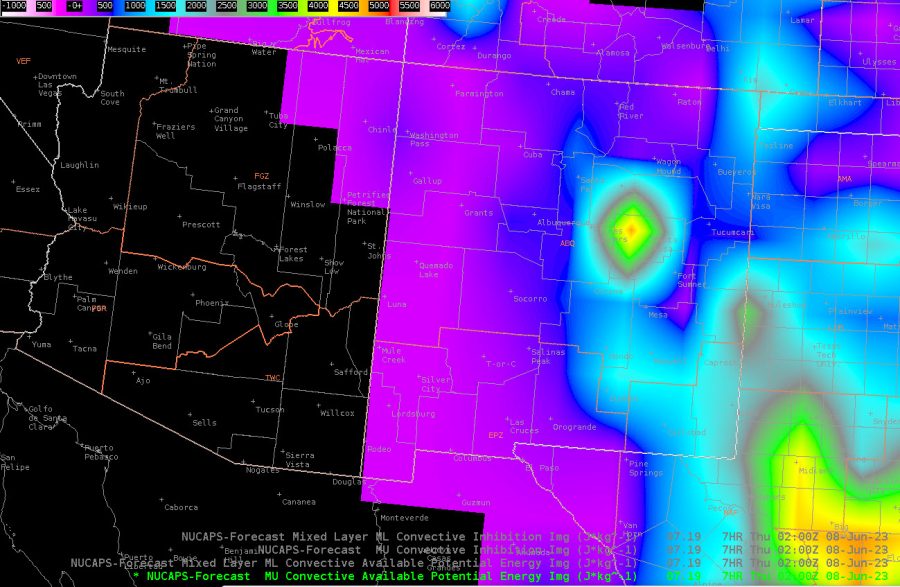
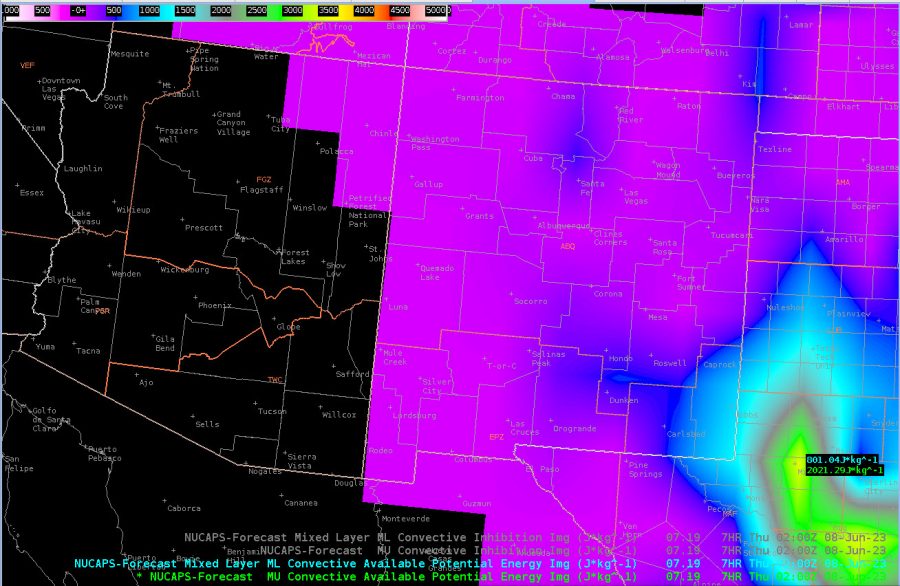
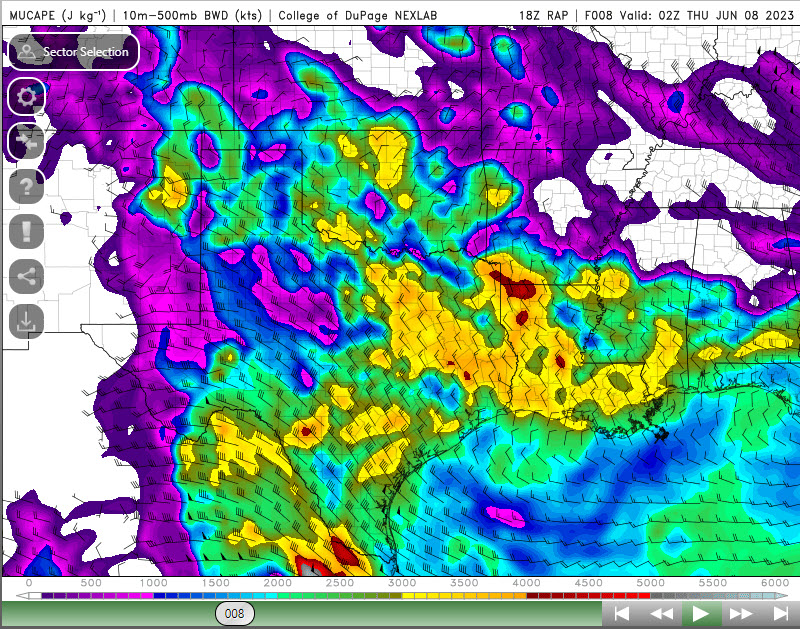
MUCAPE values seem a bit higher than they should be when compared with the MLCAPE values at the same times over New Mexico. I’m not exactly sure why the values are so high, but the forecast RAP values for the same time frame appear to be notably more displaced to the east and lower.

Example below from forecasted time 02Z.

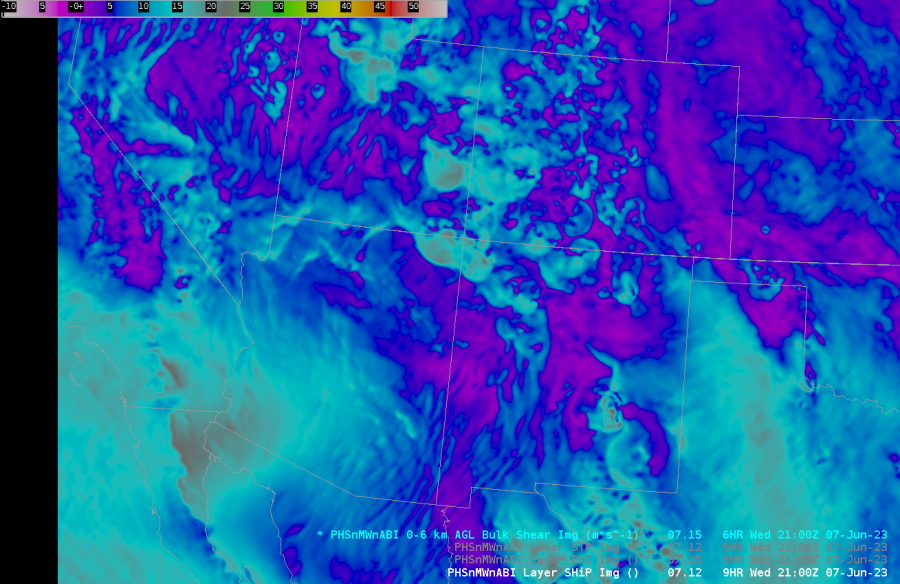
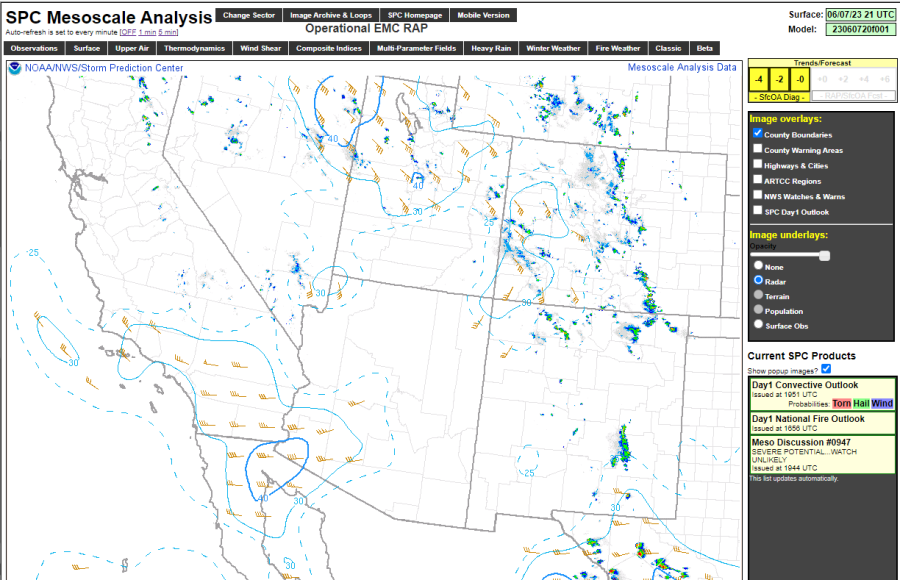
The 6 hour forecast at 21z of PHS 0-6 km Bulk Shear (first image) is compared against the 21z SPC Mesoanalysis (second image). Overall, the PHS forecast did quite well over New Mexico. There is generally little to no shear across the state except for near the Four Corners in the northwest and far southeastern New Mexico. The values are reasonable in these areas as well, around 16 m/s for PHS which fits in with the over 30 knot SPC values.These differences can be noted in the convection occurring as well (seen in the SPC image). Mainly isolated cellular over central NM, but showing more organization in the areas of higher shear.

-Satellite Steve and Burton Guster