Monday, June 5, 2023

Severe Cell in TFX CWA

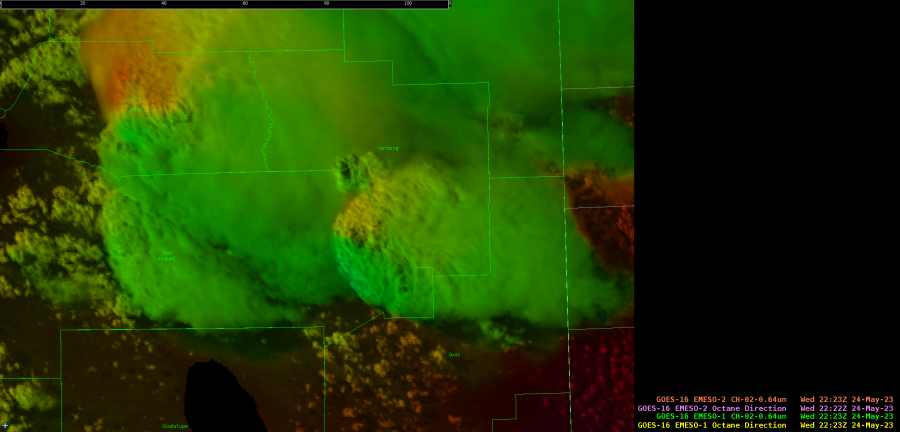
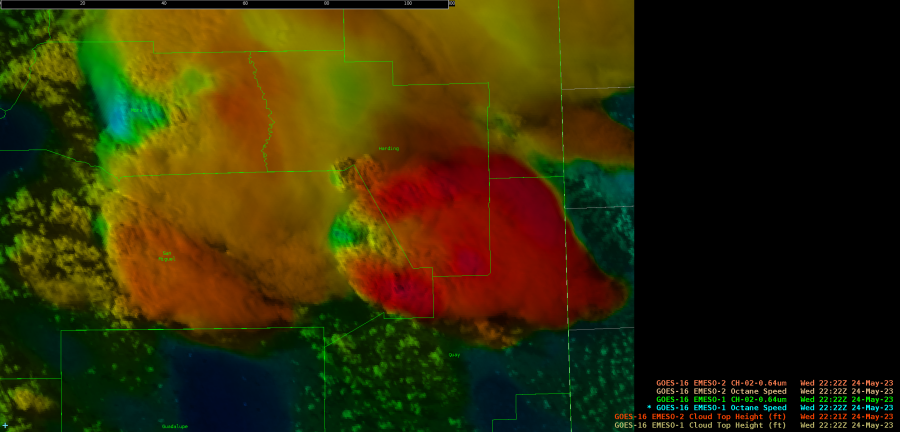
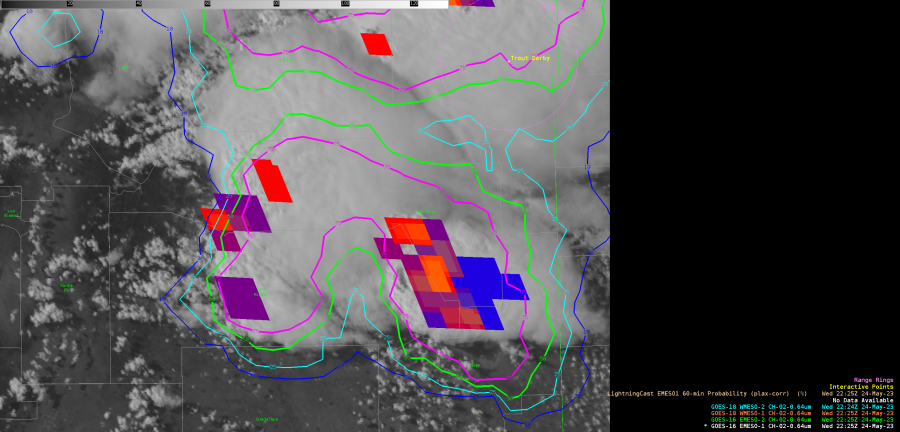
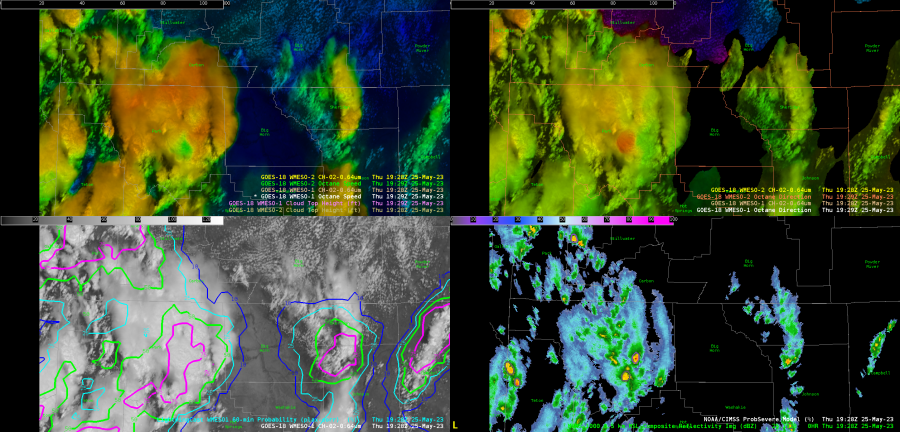
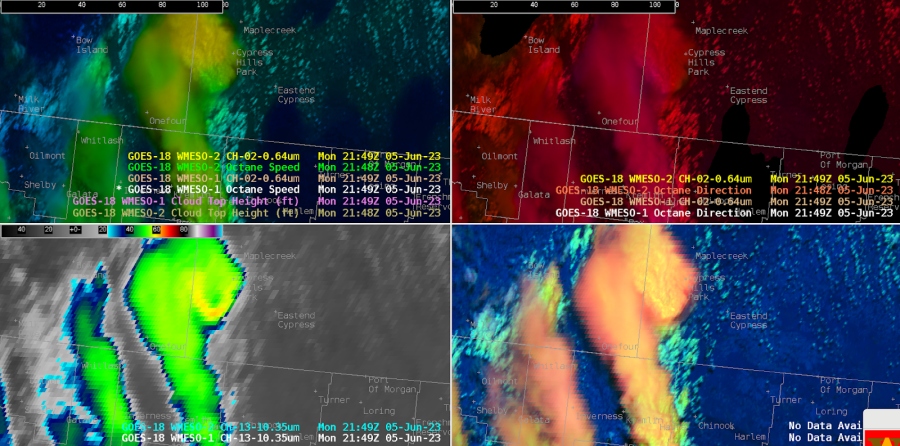
 At WFO Great Falls (TFX), we made use of the Octane speed and direction imagery, plus the IR brightness and day-cloud phase distinction to evaluate a cell northeast of Iliad. This imagery helped us screen the multiple cells over the CWA so we could home in on this particular cell. Characteristics that stood out included the higher anvil speeds on this cell, the diffluent cloud top signal on the Octane direction imagery; the cooler cloud tops (around -62C), and new/robust convection noted by DCPD.
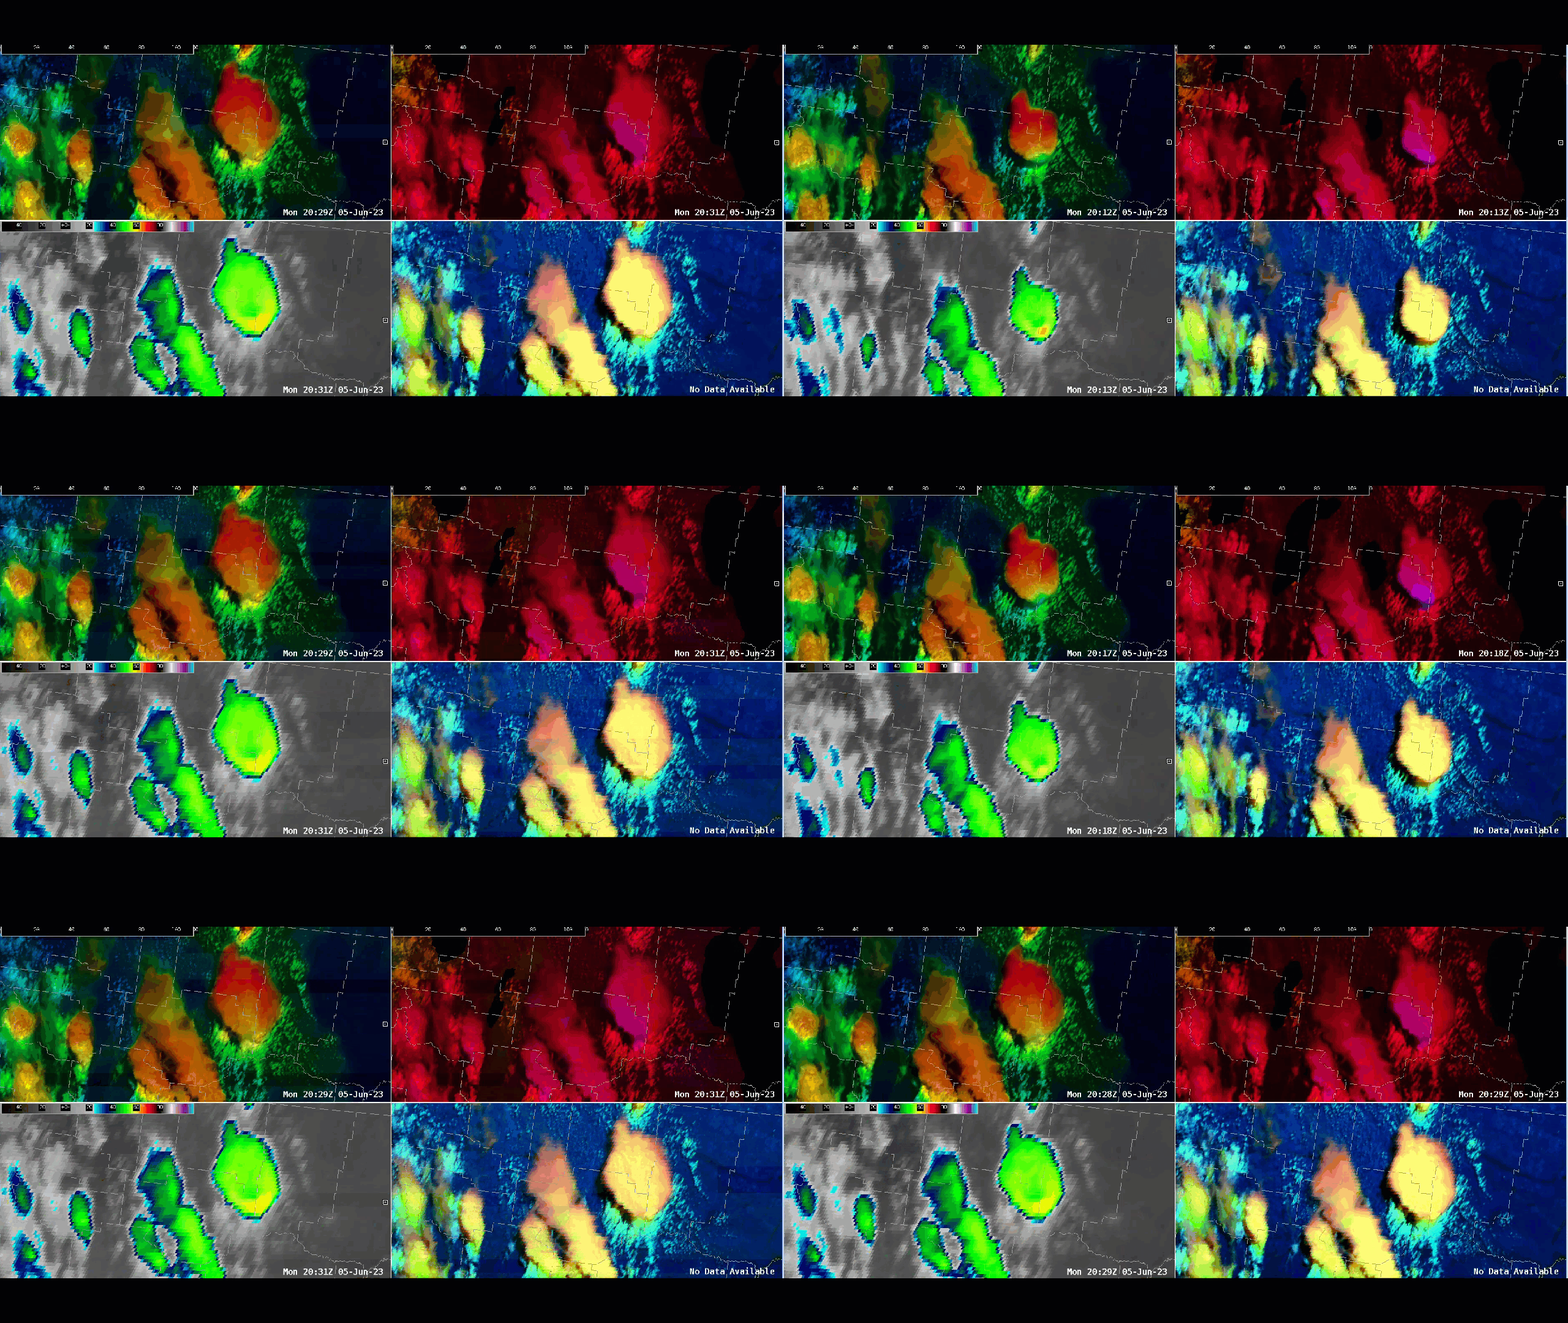
4 Panel OCTANE depiction of severe warned storm near Iliad, MT.

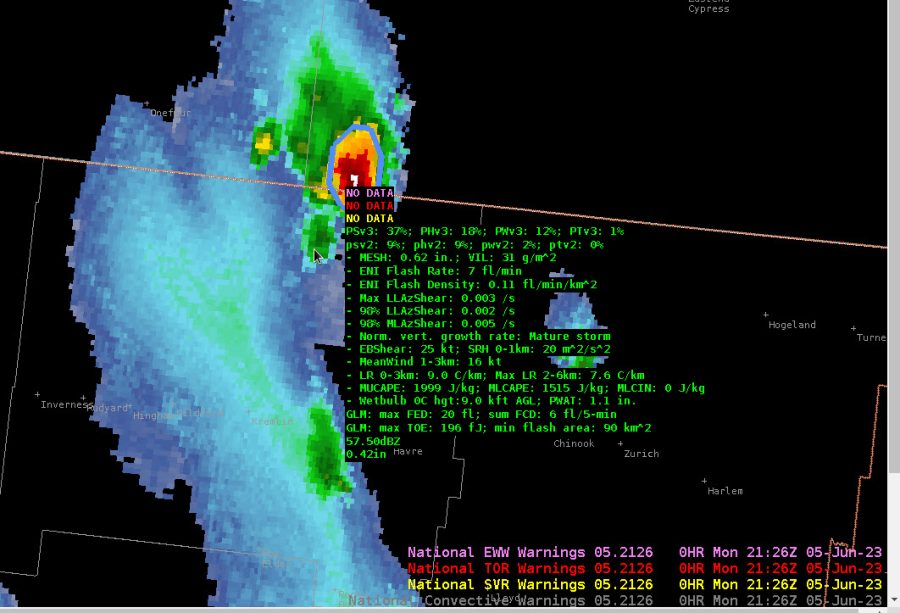
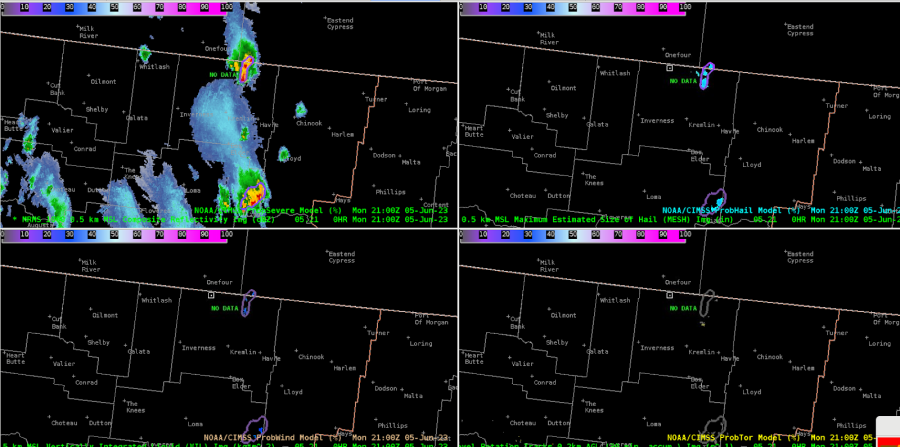
Meanwhile, the cell closer to the Canadian border is becoming stronger. The ProbSevereV3 is trending higher for total severe, up to 19% at 2104Z. The anvil from the storm to the south is beginning to impinge on the cell to the north and somewhat obstruct the view.

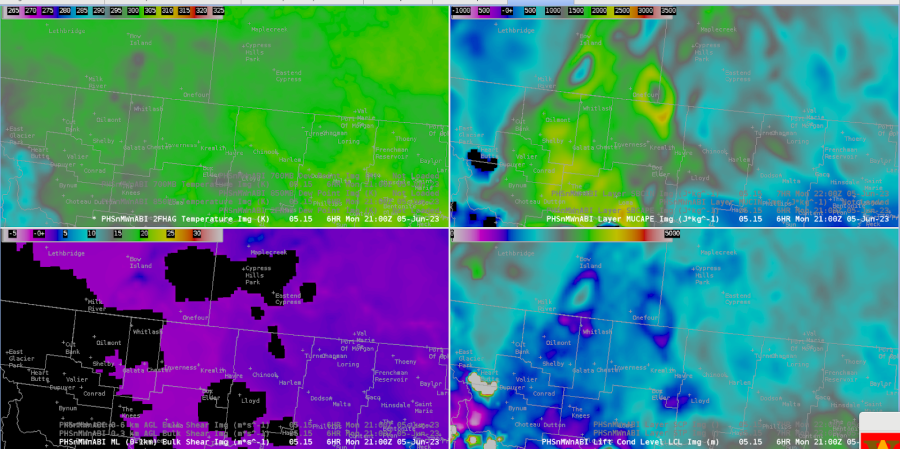
The PHS imagery showed a regional peak in MUCAPE in this area.
Looking a bit later, the total ProbSevere continues to climb. It is well above the individual probabilities, which is curious.

Storms have matured with a notable V notch of cooler cloud tops and warmer tops to the north of the notch. Based on Octane speed, there is a notable difference in speeds from the southern end of the anvil to the northern reaches with 35-40 kts increasing to 65-70 kts. PSv3 does indicate a 50% chance for severe with this storm.
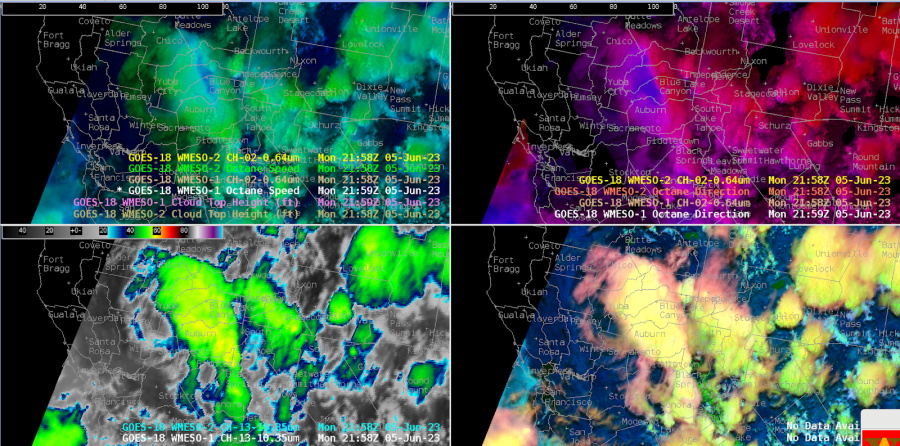
Meanwhile, down in CA, northeast of Sacramento, the Octane direction product is showing an impressive divergence signal!
-  Satellite Steve and Edgar

Thursday, May 25, 2023

The value of data fusion

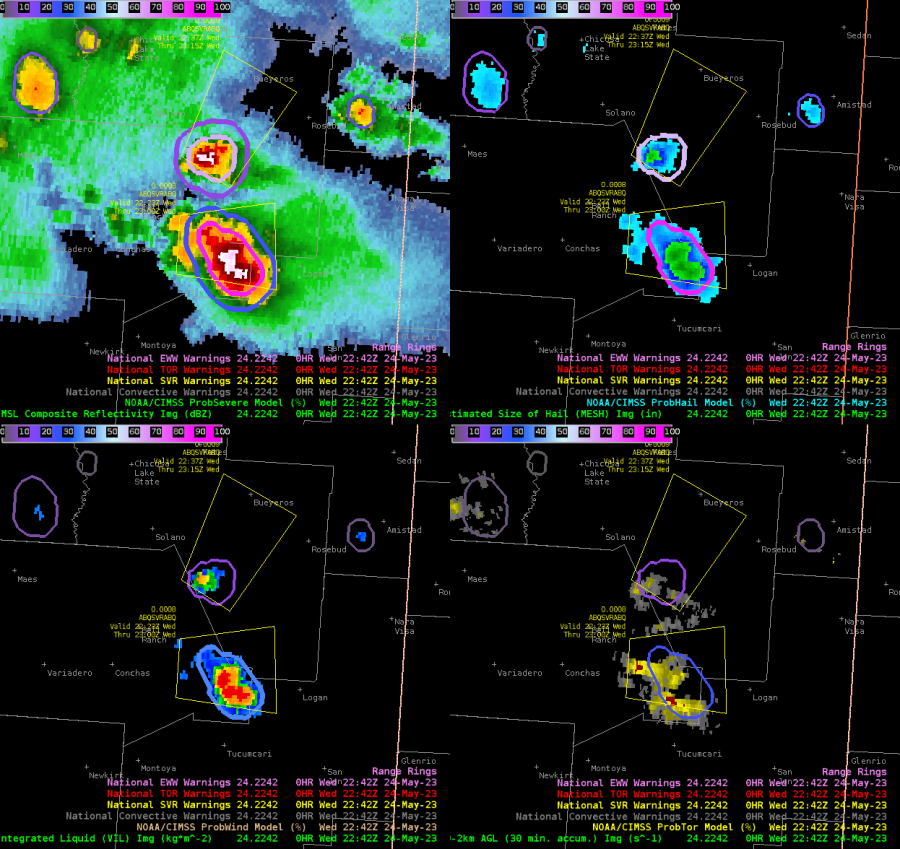
We had an interesting storm develop in a radar gap in far eastern New Mexico yesterday. This is a great case study to demonstrate the value of data fusion in ProbSevere.

Figure 1 shows where the storm developed (the red circle), which was in a region of very poor "radar quality", as the eastern New Mexico KFDR radar was down. Thus, the closest radar was KAMA in Amarillo, TX.

Figure 1: Radar Quality Index for eastern New Mexico yesterday. The red circle is the approximate location of where the storm first developed. 

Figure 2: ProbSevere IntenseStormNet contours with GOES-16 ABI vis-IR sandwich product for a rapidly developing storm in eastern New Mexico.


One input into ProbSevere v3 is the probability of "intense" convection, as computed from IntenseStormNet. This is a deep-learning model that uses images of ABI 0.64-µm reflectance, 10.3-µm brightness temperature, and GLM flash-extent density to compute a probability of how "intense" the storm looks from a satellite perspective [paper]. 

The rapidly increasing IntenseStormNet probability, along with a favorable environment, and increasing total lightning flash rates helped jump the probability of severe despite poor radar reflectivity.

As the storm moved south and east into better radar coverage, radar reflectivity increased and the probabilities of severe further increased to above 70%. 

Figure 3: ProbSevere contours, MRMS MergedReflectivity, and NWS severe weather warnings.


Forecasters at the HWT have noted numerous times how ProbSevere v3 has increased before v2, particularly noticeable in the regime we've experienced this week, where the storms have had a dearth of lightning at the developing stages. At the time in Figure 4, this storm had PSv3 of 36% vs PSv2 of 12%


Figure 4: ProbSevere and MRMS MergedReflectivity for a developing storm in a radar gap in eastern New Mexico.


Later on, this storm produced numerous large hail, severe wind, and several tornado reports. Interestingly, the ProbTor v3 was much higher than ProbTor v2 prior to the first tornado report. In Figure 5, we can see PTv3 is 47% while PTv2 is only 9%. Looking into this deeper, we found that the environmental information such as the 0-1 km storm-relative helicity (~ 30 m^2/s^2) and the 1-3 km mean wind (~15 kt) were very low. The HRRR values in PTv3 were much better (~100 m^2/s^2 for SRH and 27 kt for the low-level mean wind). I believe this is an indication that PTv2 was too dependent on environmental information, compared to PTv2. This also demonstrates that the HRRR had a better handle on the environment than the RAP. You can see the low 0-1 km storm-relative helicity in the SPC mesoanalysis (Figure 6).

Figure 5: ProbSevere contours (the outer contour is colored by the probability of tornado), MRMS MergedReflectivity, and NWS severe weather warnings.


Figure 6: 0-1 km SRH (contours) and storm motion (vectors) prior to tornadogenesis. The red circle shows where the approximate location of the storm prior to producing tornadoes. 

Figure 7 demonstrates how ProbTor v3 was much higher than ProbTor v2 early on. The vertical black lines in the top-left two panels represent the times of the first and last tornado reports. The interactive version of these time series have been saved off and are available here.  

Figure 7: Time series of ProbSevere probabilities and radar, satellite, lightning, and HRRR attributes for the tornadic storm in Figure 6. 


Using Octane, GLM, and ProbSev for Warning Operations with Very Little Radar

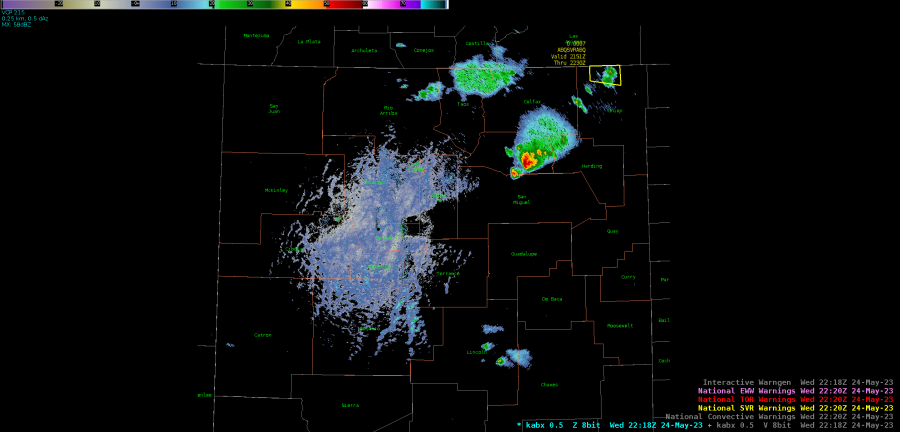
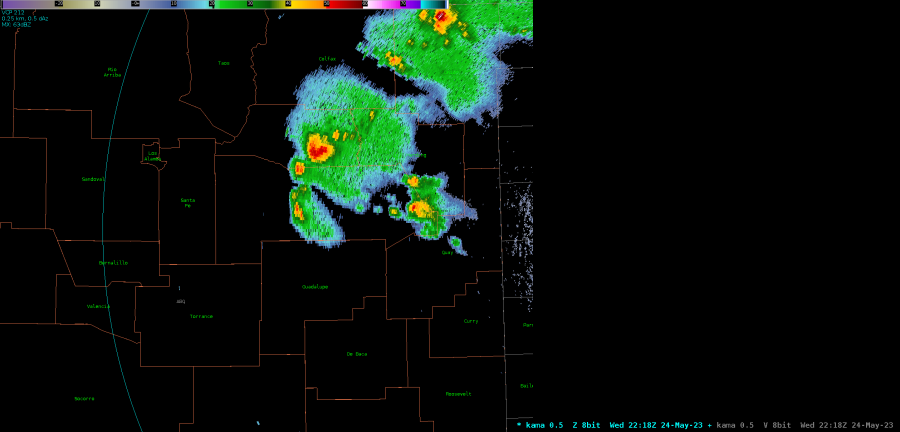
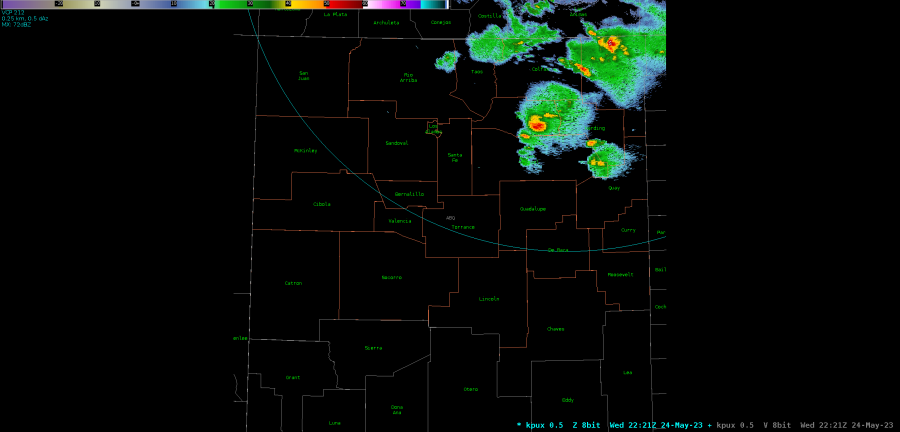
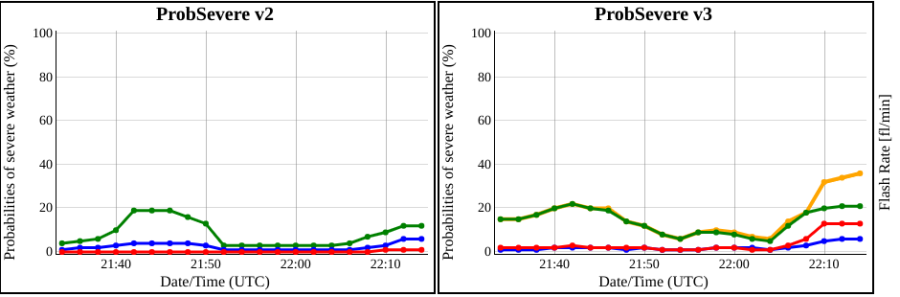
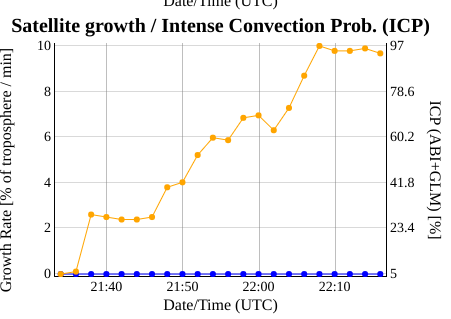
 A severe thunderstorm warning decision in eastern New Mexico was a challenge today as it was within a KABX beam blockage and the eastern NM radar, KFDX, was down. The signs of the intensifying storm were found on satellite, GLM, and then slowly ProbSevere as the radar reflectivity heights from KAMA (the nearest valid radar) were very disorganized and slow to respond compared to the trends depicted by satellite and GLM trends. An above anvil cirrus plume, IR thermal couplet, consistent GLM FED/MFE signature, and cloud top divergence depicted by the Octane Speed/Direction product showed signs of strong convection developing. While reflectivity below showed just a minimal 50 dbz core and no 60 dbz core. As ProbSevere V3 gradually increased to around 35%, the ProbSevere ​Satellite Growth/Intense Convection Prob. quickly ​increased. The satellite growth/Intense Convection is not weighted as high in V2 and because of that ProbSevere was much lower at the same time.  While the radar reflectivity core was still missing, we decided to issue a warning for the storm given the other satellite based signatures. ProbSevere V3 began to show strong chances for severe weather approximately 13 minutes after the warning was issued, and a strong 60 dbz core developed on the KAMA radar shortly after with MESH getting as high as 3.5 inches.

GOES-16 Octane Direction.

GOES-16 Octane Speed.

GOES-16 GLM RGB

KABX 0.5 degree reflectivity.

KAMA 0.5 degree reflectivity.

KPUX 0.5 degree reflectivity.
 

​_

ProbSevere probability charts.


MRMS output showing radar data approximately 20 minutes after warning issuance.


-Thunderstruck

- Joaq

Using GLM to decide to issue an SPS

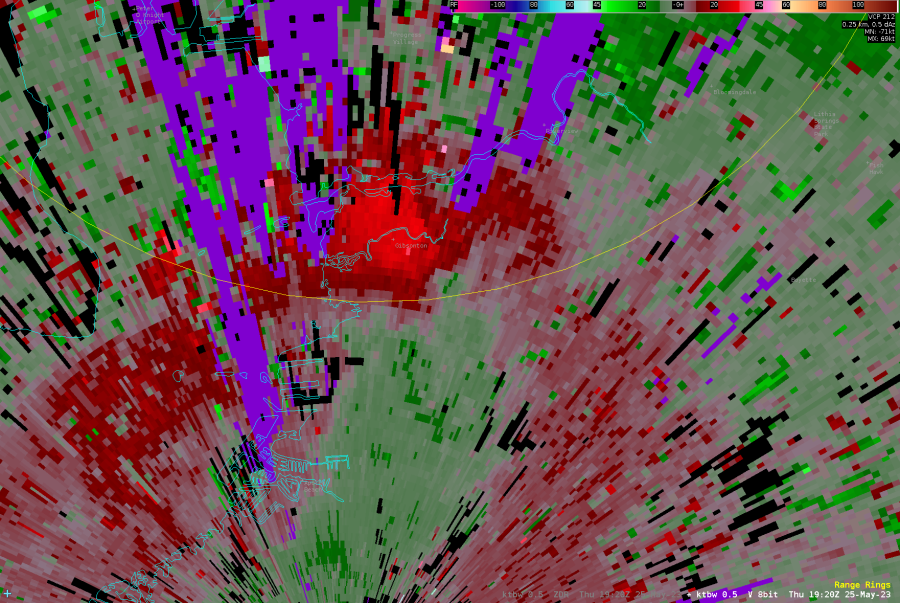
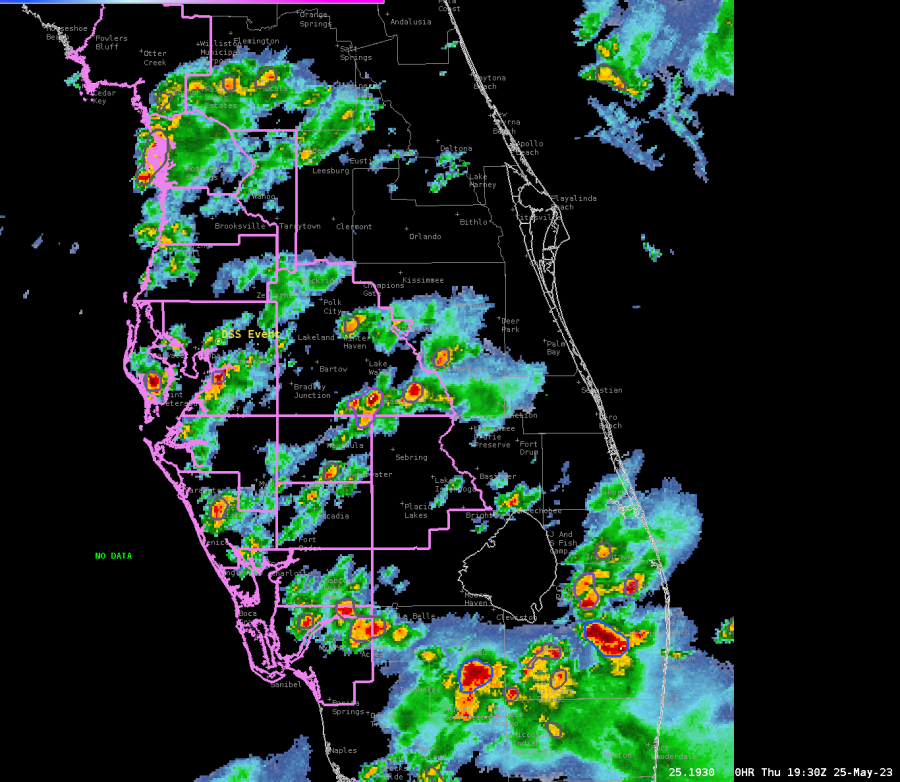
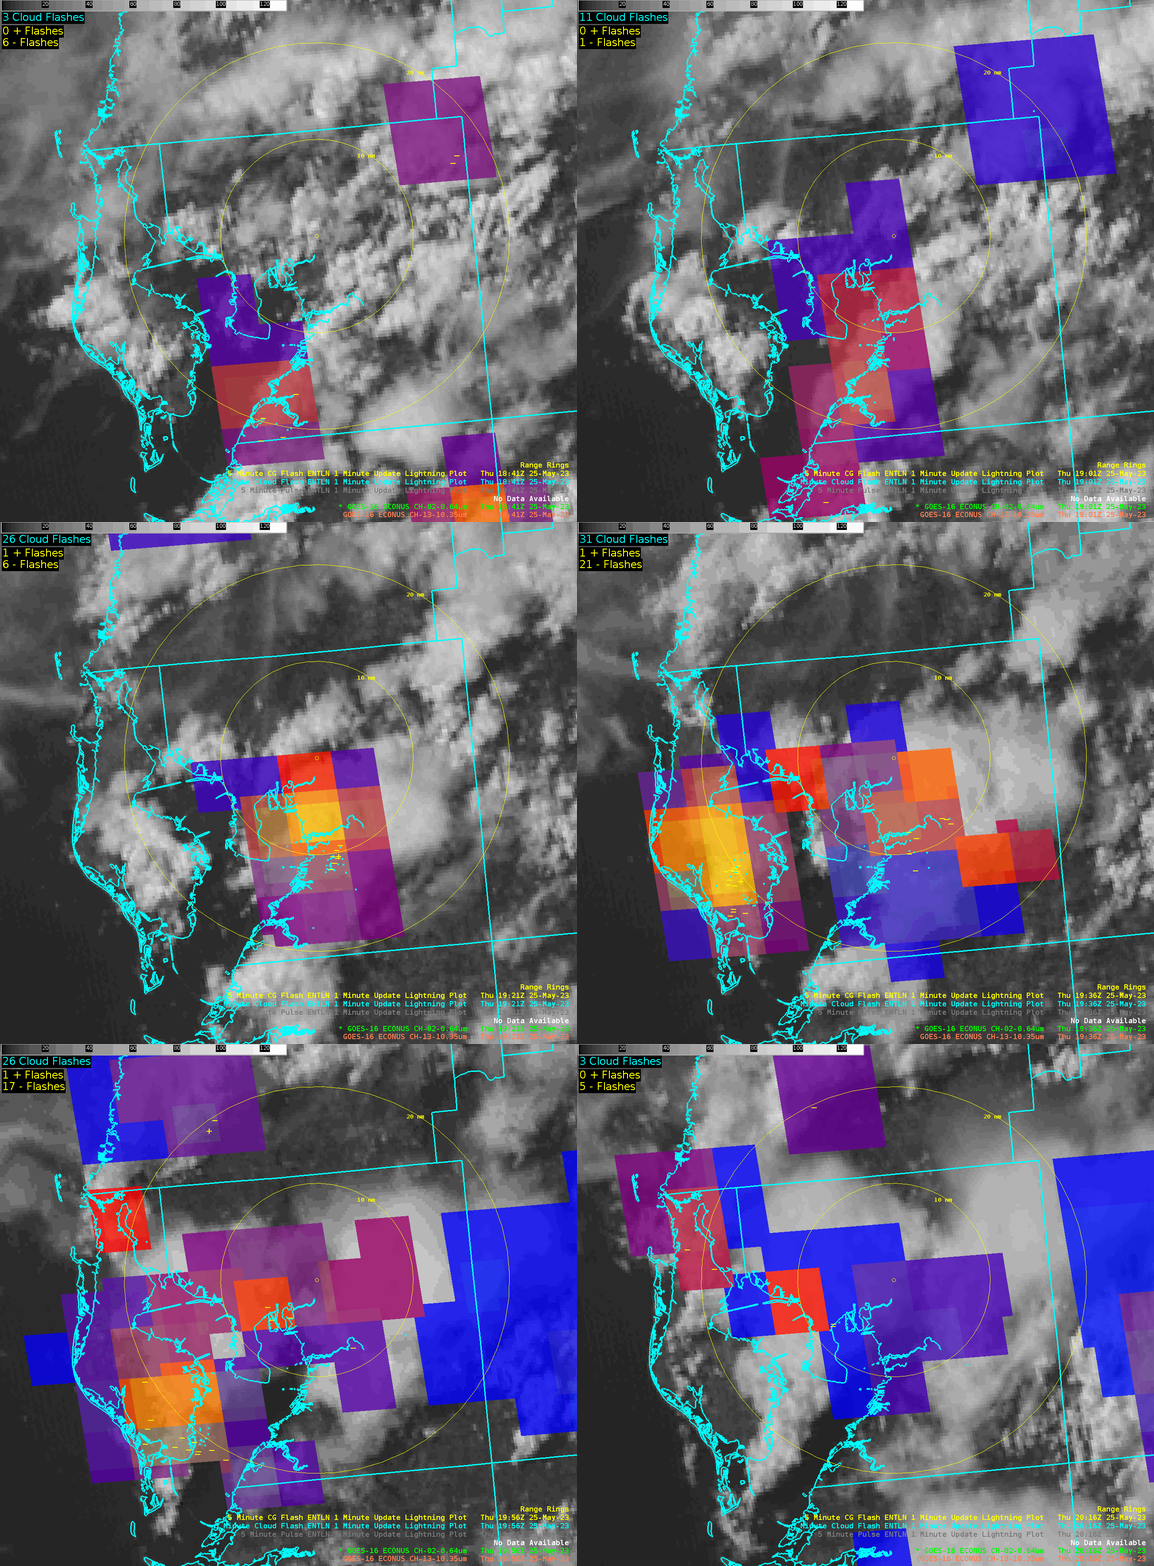
 GLM RGB showed the progression of a developing storm near the TBW DSS site this afternoon. Not only was lightning a threat communicated to the DSS site, but KTBW radar depicted a downburst signature as shown below, which prompted us to issue an SPS for wind to around 40 mph, frequent lightning, and heavy rain.  track a developing storm near the Florida State Fair
-Joaq

Using GLM to track thunderstorm life cycles

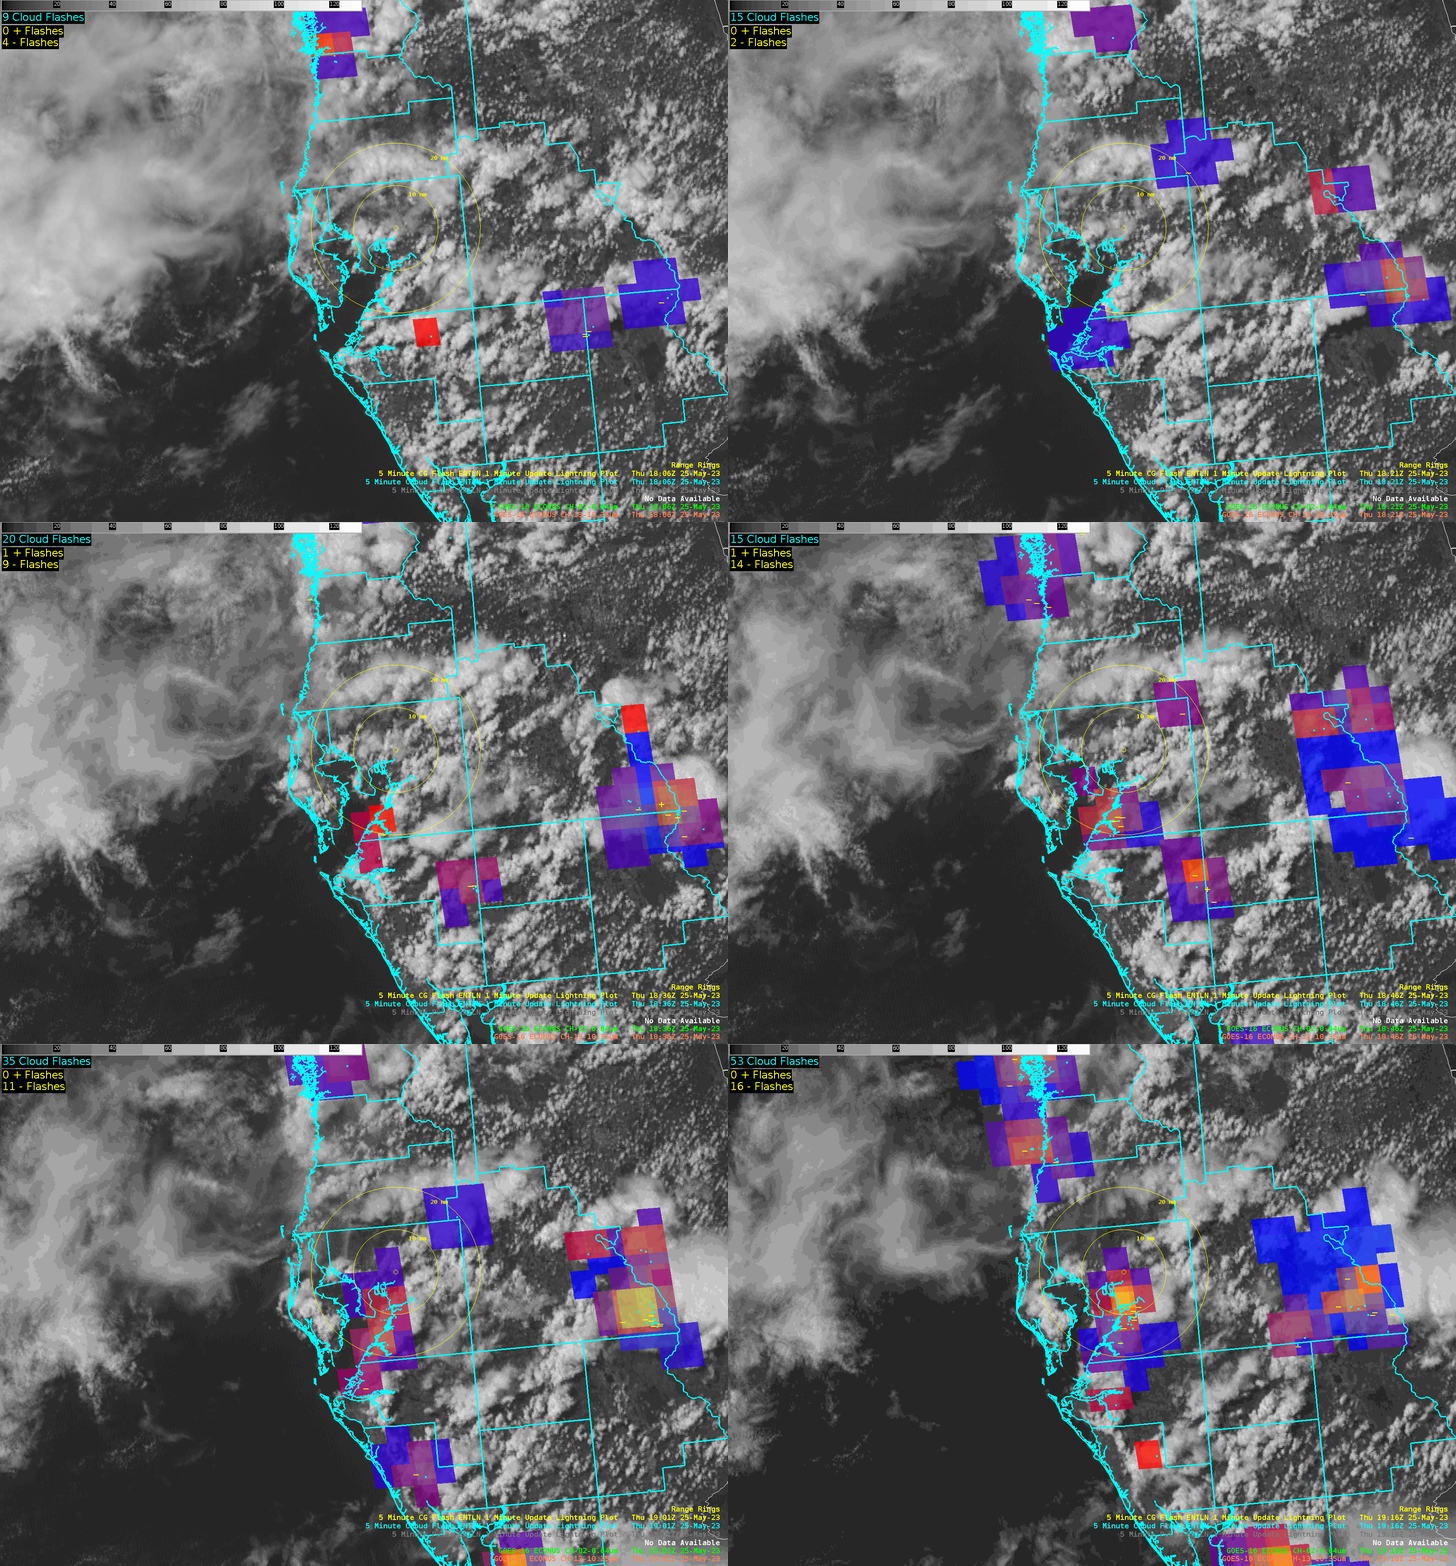
 GLM FED/MFA RGB here shows the rapid thunderstorm life cycles in the weakly sheared but highly unstable Florida atmosphere, as reds to yellows (intensifying convection with lots of short cloud flashes) give way to blues and purples (weakening convection with fewer but longer flashes). The range rings circle today's DSS event, which also highlights the difficult nature of producing storm by storm headlines or products for public safety as the life span of these thunderstorms are brief. The messaging for today highlights the consistently sporadic lightning threat for anyone on the coast or at the DSS site while storms build and collapse over a matter of minutes.

-Joaq

PHS and GLM Data for Tampa Florida this Afternoon and Evening

 General Risk for Thunderstorms in Florida this Afternoon and Evening

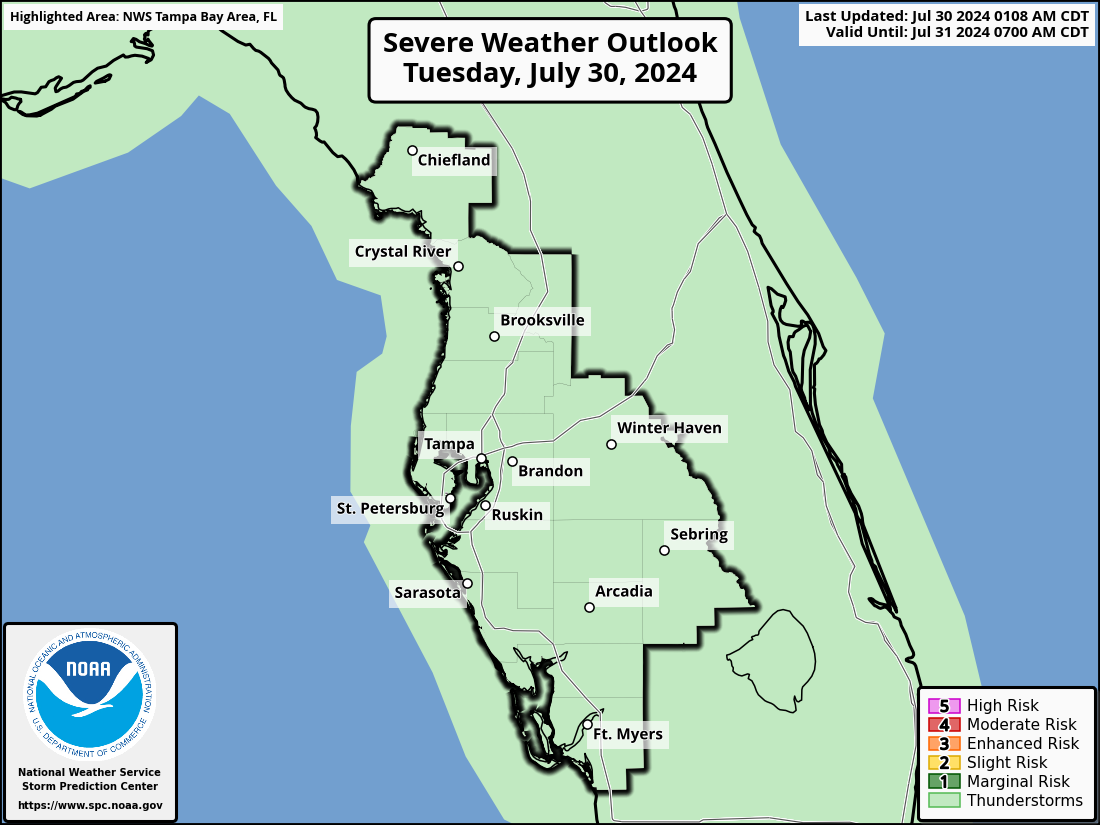
The Tampa CWA is in a general risk for thunderstorms this afternoon and evening per the SPC.

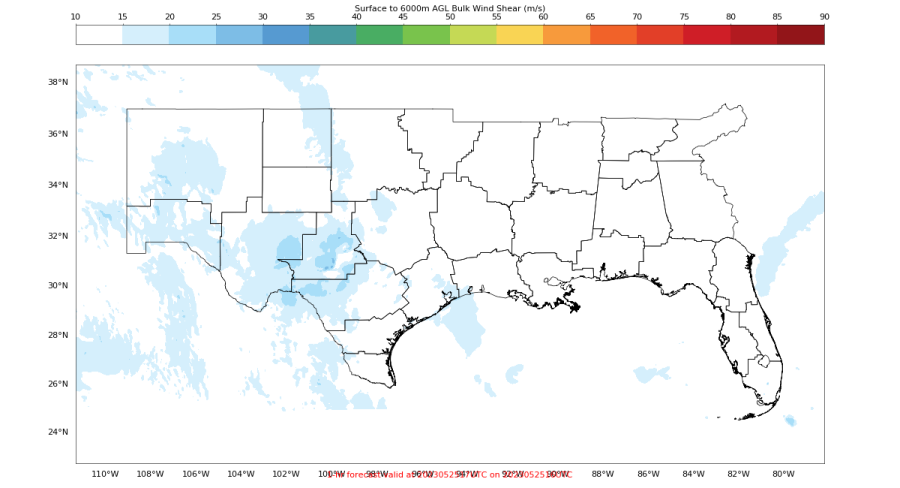
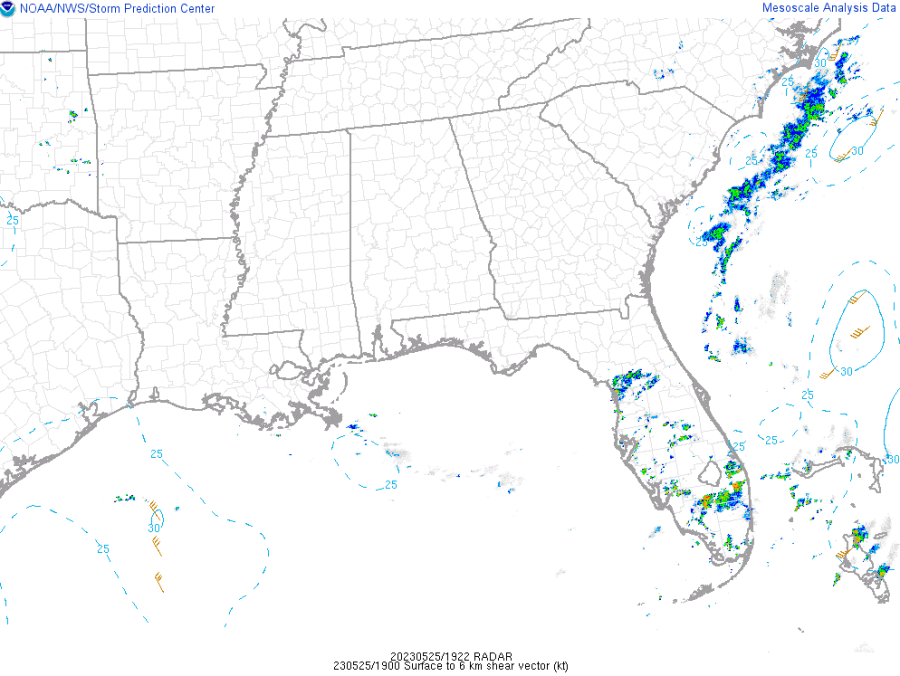
The main potential impacts are frequent lightning, heavy rainfall, and gusty winds thanks to decent amounts of SBCAPE.  Localized flooding  also remains possible, especially in urban areas,  due to slow storm motion as PHS shows no 0-6 km Bulk Shear over Florida. This matches well with the latest SPC Mesoanalysis which also shows no 0-6 km Bulk Shear shear over the region.

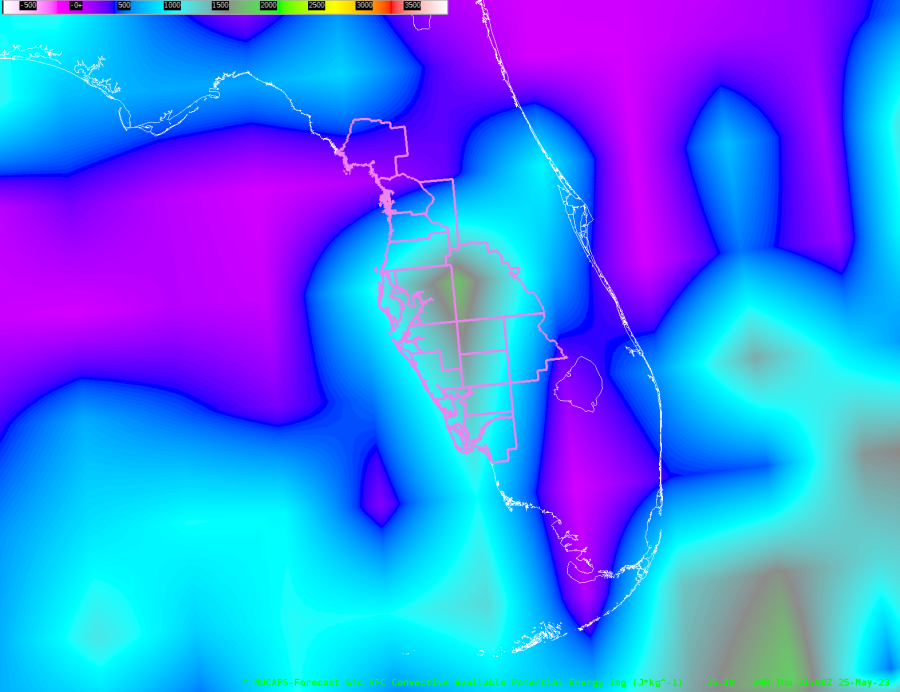
NUCAPS showing SBCAPE values at 21Z. Values are highest across the central and southern portions of the Tampa CWA. Areas in green had values around 1600-1700 J/kg. Areas in teal show values ranging from 800-1400 J/kg. Areas in purple range from 200-300 J/kg.  PHS shows a similar trend to NUCAPs with higher areas of SBCAPE across the central and southern CWA with lower values across the northern half of the CWA. However, the color scale on the online version of PHS is difficult to interpret as the gradient ramps up from light red to dark red. So, you cannot really pinpoint specific values of SBCAPE. However, you are able to see areas of lower SBCAPE and areas of higher SBCAPE at a glance. 
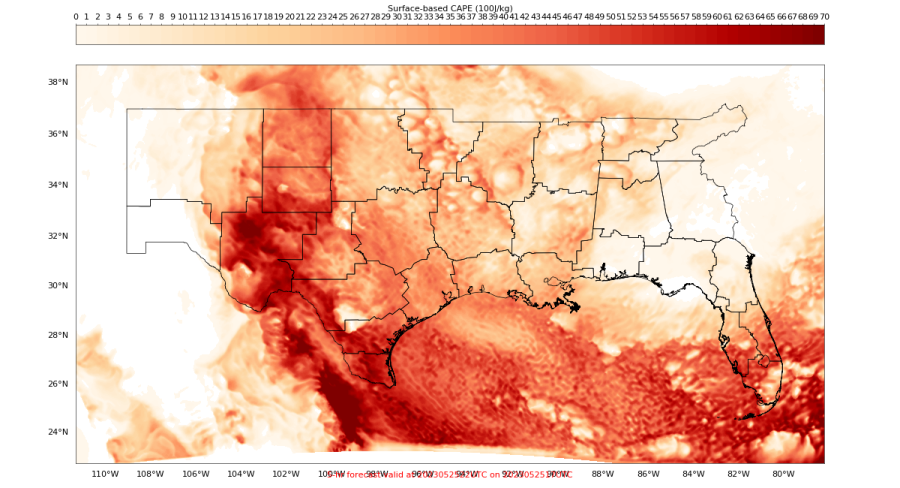
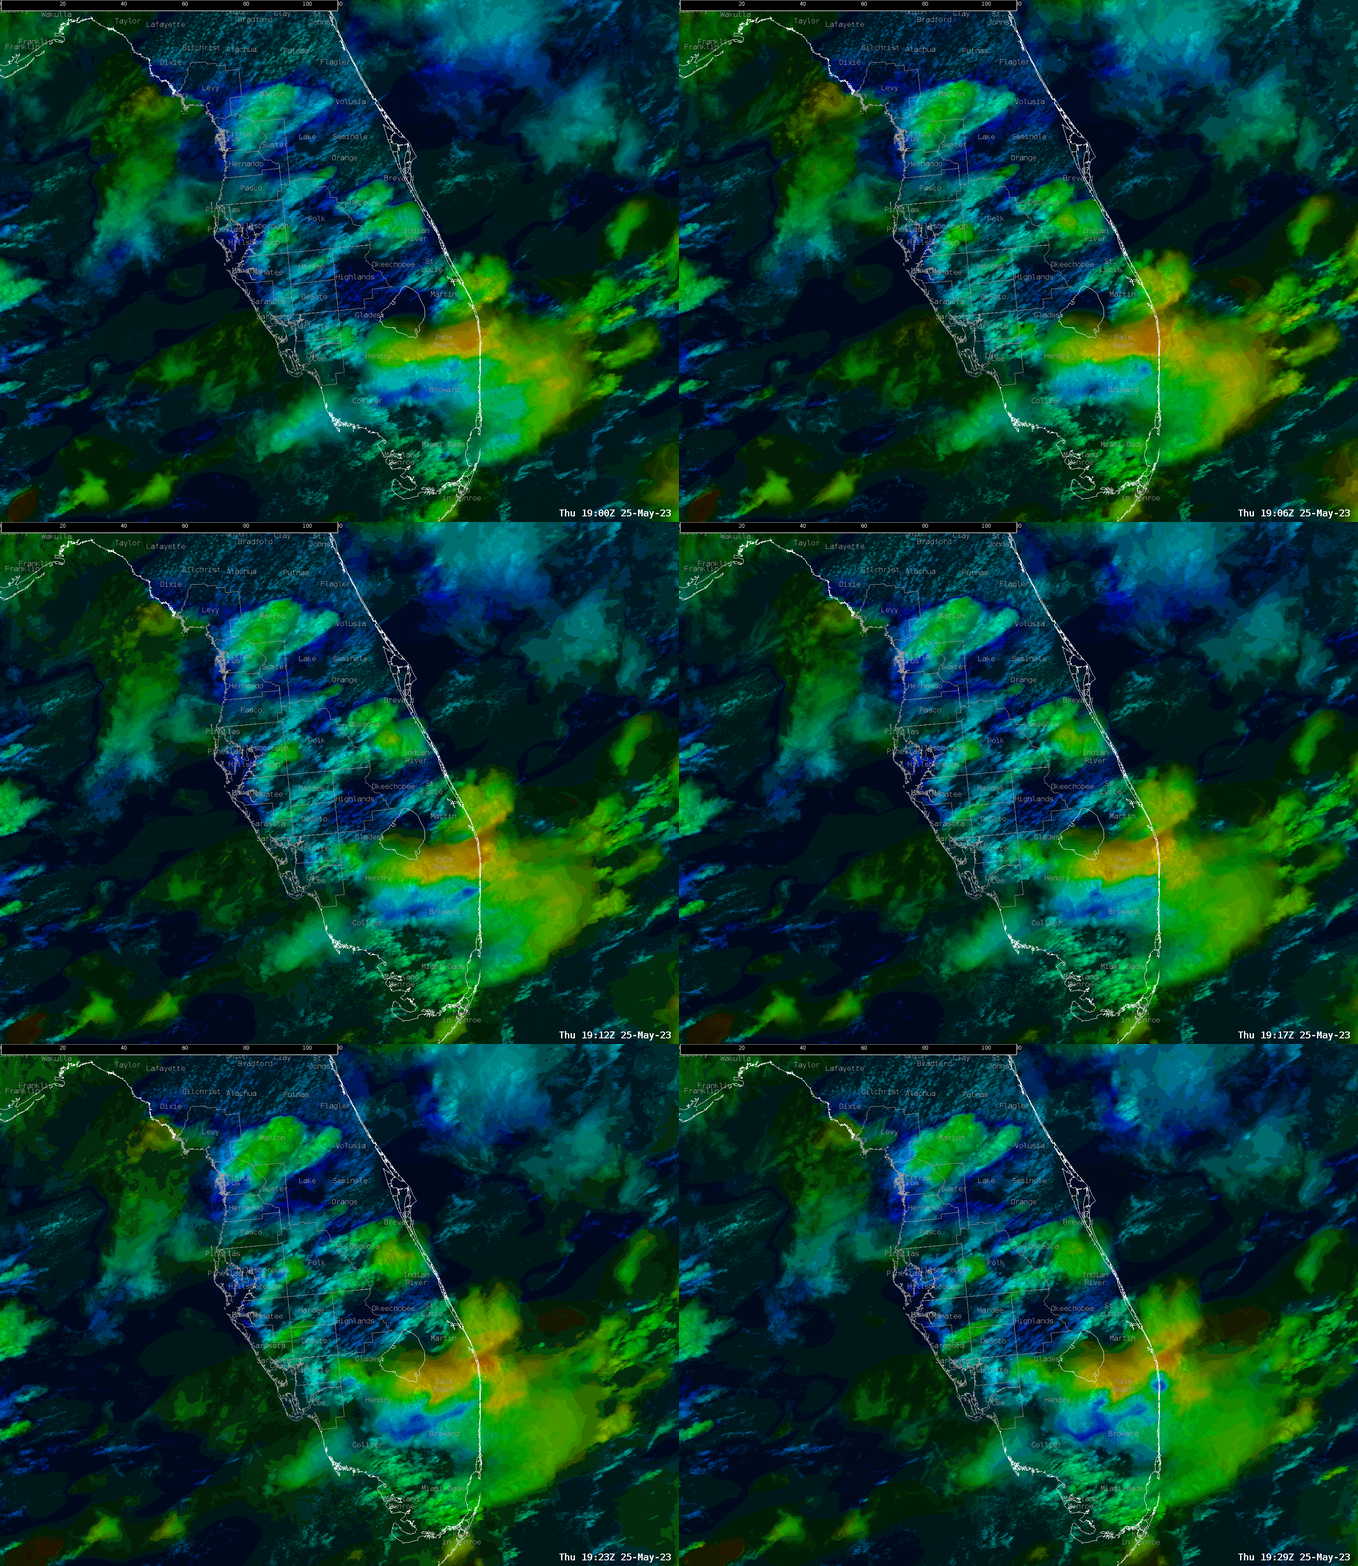
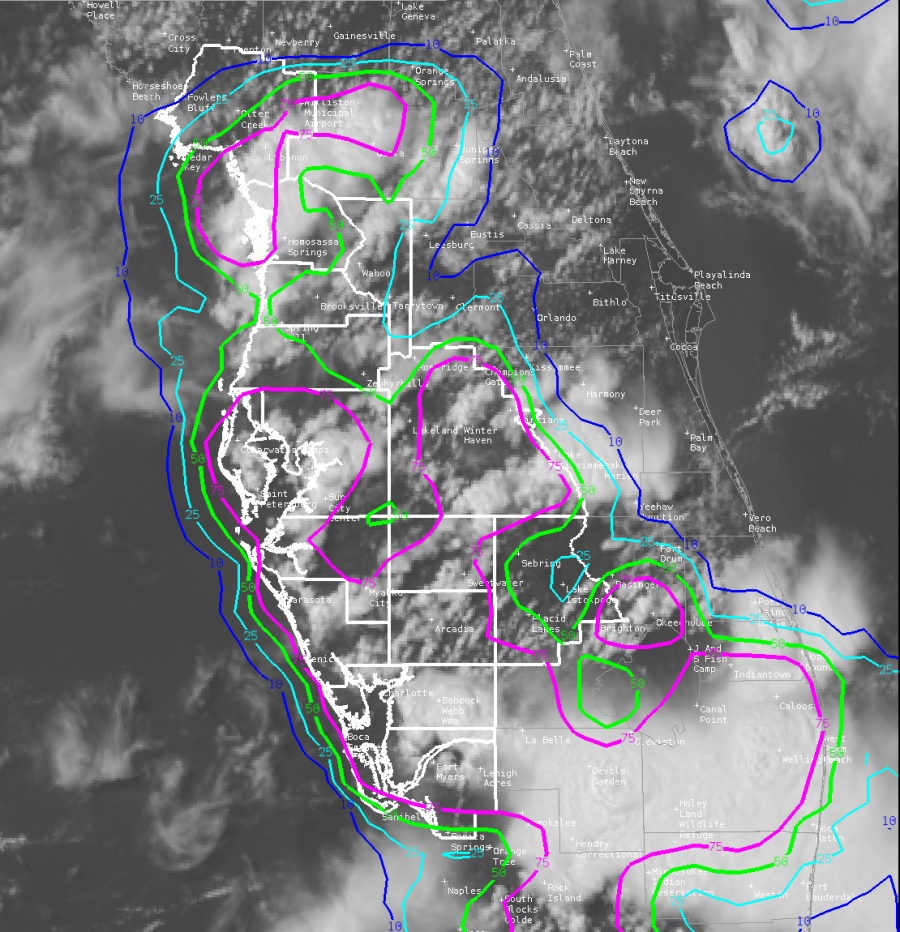
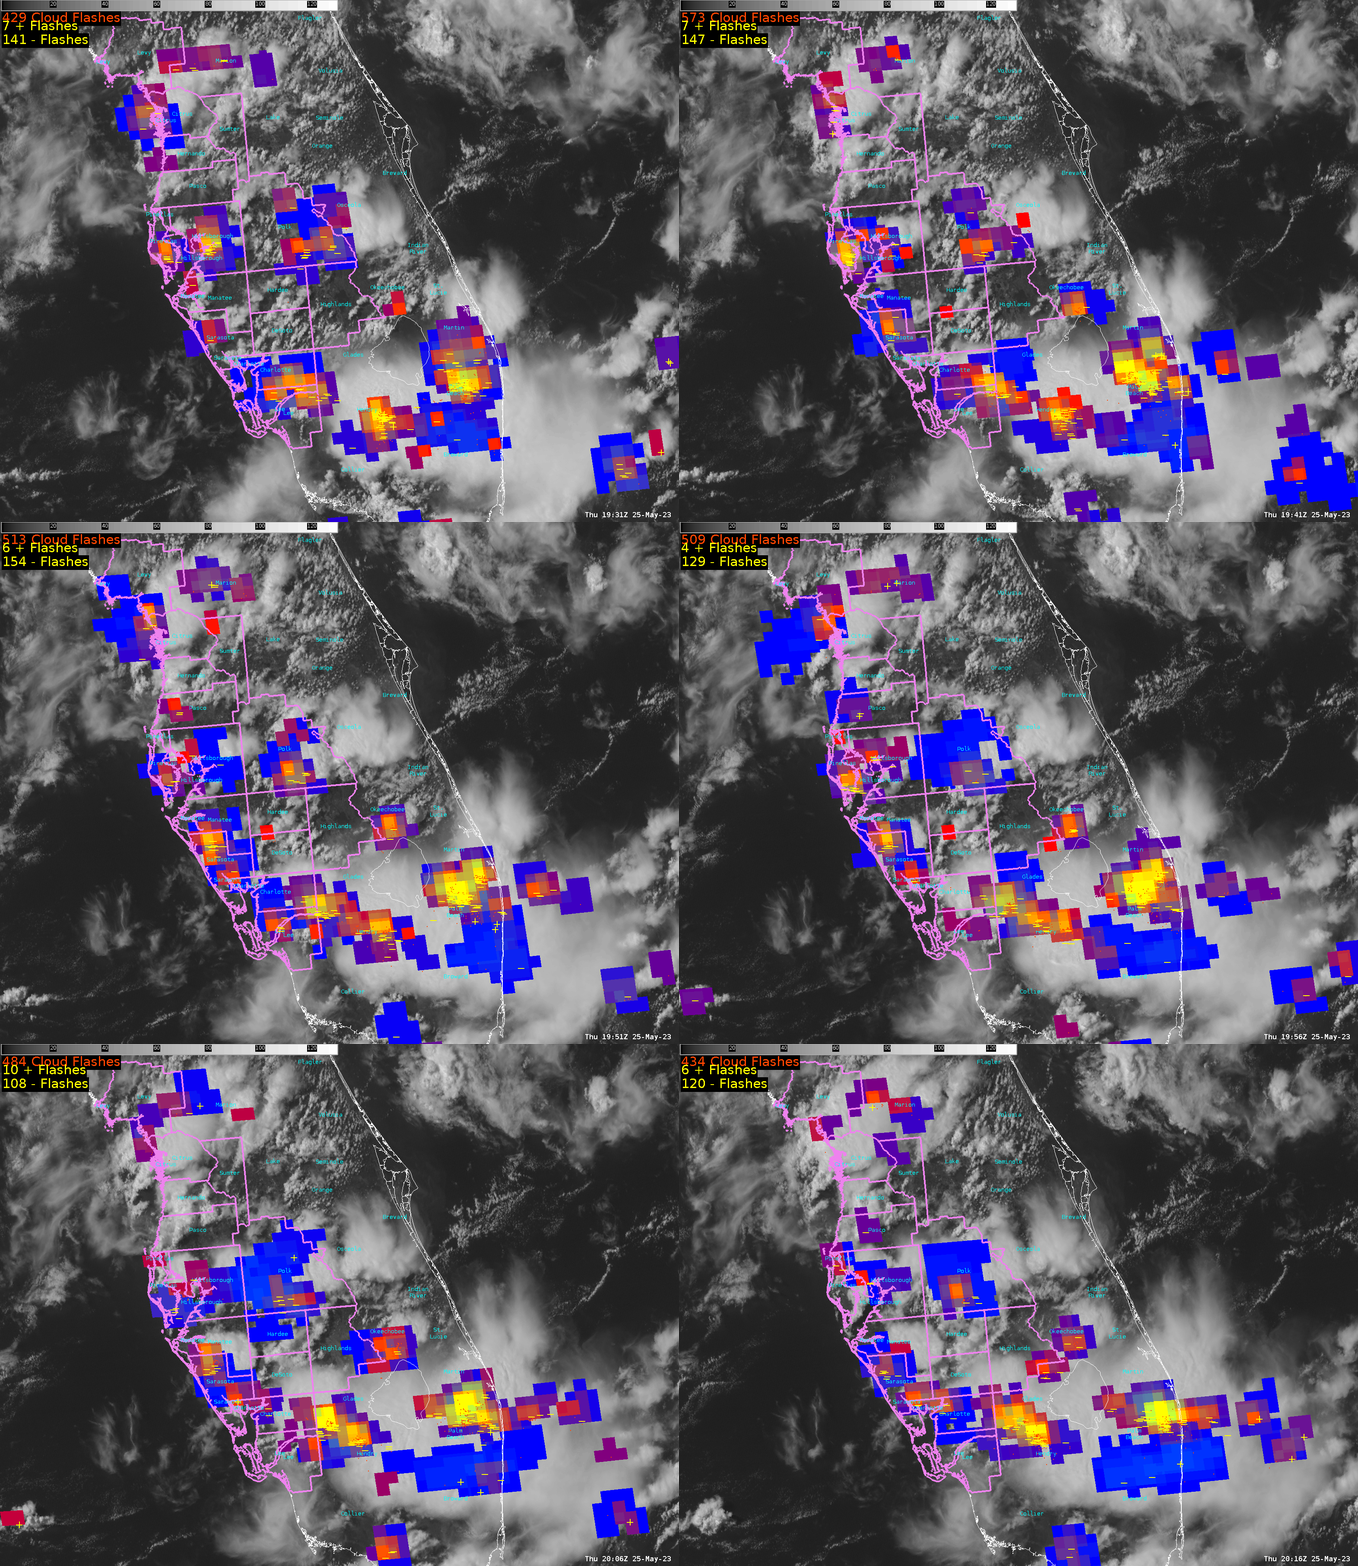
ProbSevere version 3 increases our confidence that storms will remain generally sub-severe as ProbSevere values are below 10% across the Tampa CWA as of 1930Z.The Octane Speed Sandwich product further confirms that storms are remaining below severe limits as the strongest storms are noted over southeastern Florida this afternoon as of 1930Z. Not only do these products help us pinpoint areas of potential severe weather, but they also help us pinpoint areas of sub-severe weather.  GLM shows lightning activity increasing across the Tampa CWA early this afternoon, and activity is expected to gradually increase in coverage as more thunderstorms develop through the late afternoon and early evening hours.  Lightning Cast around 1930Z shows lightning probabilities increasing across the Tampa CWA over the next hour. Pink contours represent a 75% chance of lightning in the next hour. Green represents a 50% chance, teal a 20% chance, and dark blue a10% chance of lightning in the next hour. GLM showing lightning activity increasing across Florida from 1930Z through 2016Z across the Tampa CWA. Areas showing more oranges and yellows have shorter flashes and more lightning density. These areas help us know where stronger updrafts are located. The strongest updrafts at the time of this loop remain outside of the Tampa CWA.  -Dwight Schrute
New Four Panel

 After a few days at the HWT I have decided to make a four panel of my own with the new products which has been working great! On the top left we have Octane Speed with Octane direction on the top left. We have Vis with lightningcast and GLM 1 min lightning on bottom left. On bottom right I have MRMS data and ProbSevere V3.  I was very happy with this display for situational awareness.

Also in the image below we can easily spot a stronger storm in a cluster of cells in Park County looking at directional and speed shear with Octane. Then we can quickly look down at ProbSevere and see its on the one storm being highlighted. That tells me this is the storm that I need to watch over the next 10-15 minutes for development.

-Thunderstruck

NUCAPS Low Level Lapse Rates Compared to RAP in Convection

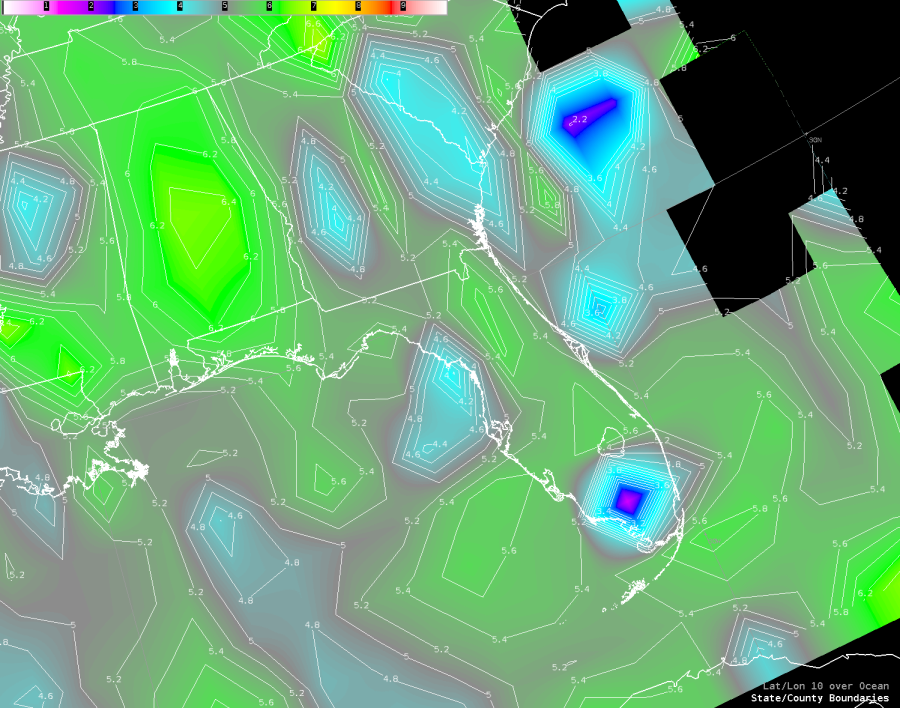
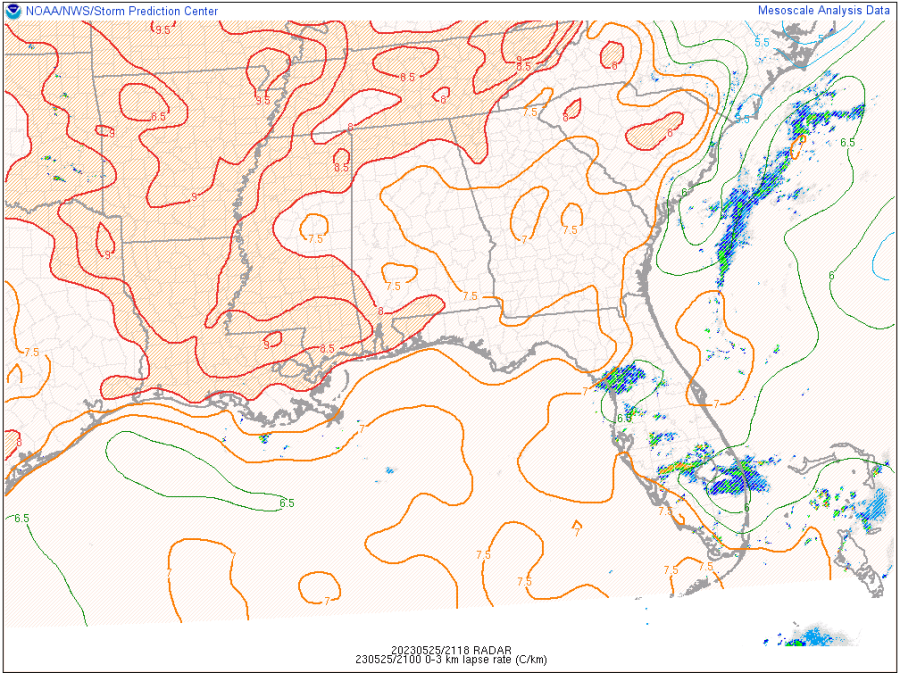
 The 19Z NUCAPS sounding pass went over Florida as convection was ongoing across much of the state. The 850mb to 700mb lapse rate product picked up on some of the convective overturning in southern Florida where lapse rates were far less steep than other portions of the state (indicative of cooler low levels), as well as where low level lapse rates were a bit lower over the western coast. This lines up well with where the RAP was showing lower surface to 3 km lapse rates. Though these two levels are not completely analogous , they represent similar processes post-convection. However, the NUCAPS pass is also picking up on lower 850-700mb lapse rates over Georgia and South Carolina which doesn't match with the lower lapse rate product from the RAP, but these areas were also not experiencing convection so the reason for this could be due to other factors.

-Joaq

Outflow Boundary Heading Towards Florida State Fair DSS Event

 Outflow Captured by Radar and Octane Speed Sandwich in West Florida 

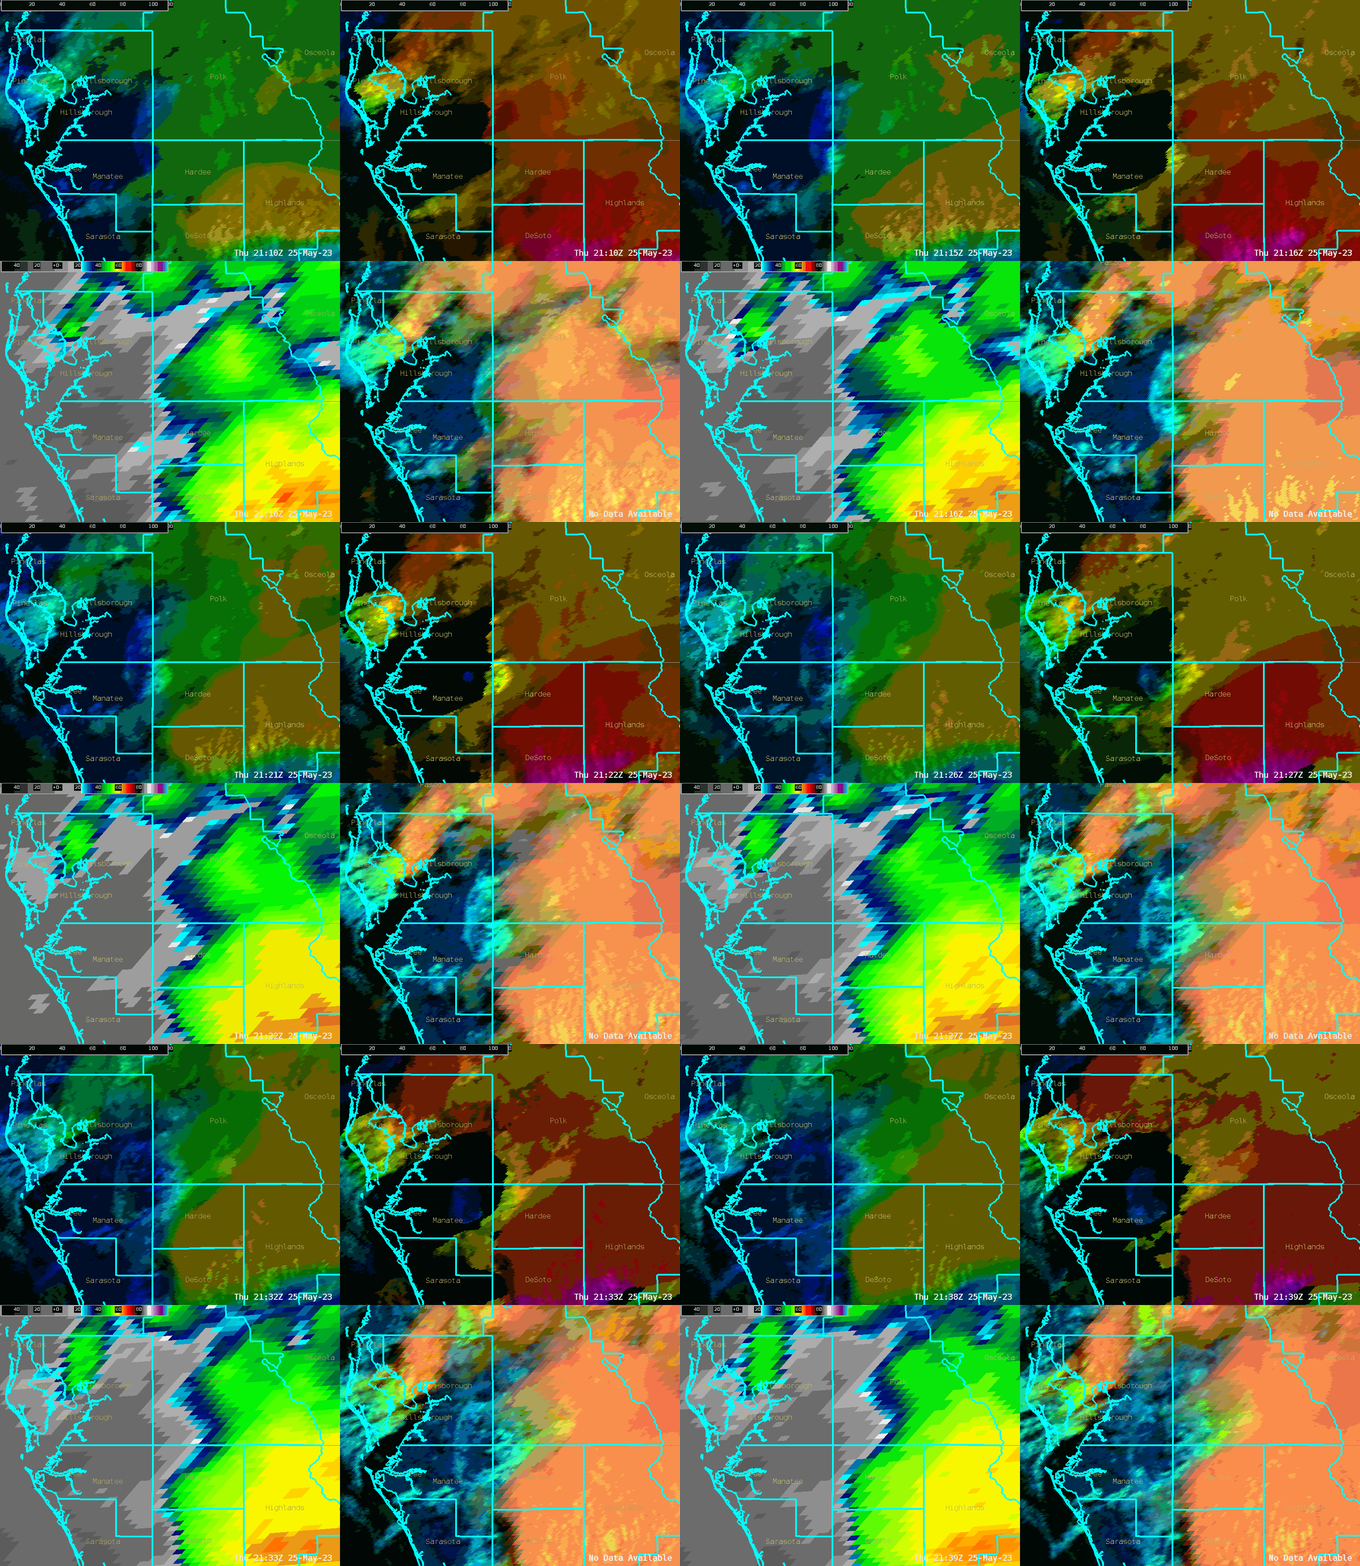
An outflow boundary tracking west towards a DSS Event in Tampa shown via radar. The outflow could be seen up to 20000 to 2500 feet MSL on radar.  Octane Speed Sandwich also captured the outflow boundary approaching the DSS Event.
-Dwight Schrute

Splitting Supercell Over SW TX

This is an 80 minute loop (in 1-minute increments).  The visible imagery with an experimental GLM RGB overlayed shows a splitting supercell over SW TX on the afternoon of 5/25/23.-Champion