Thursday, May 25, 2023

New Four Panel

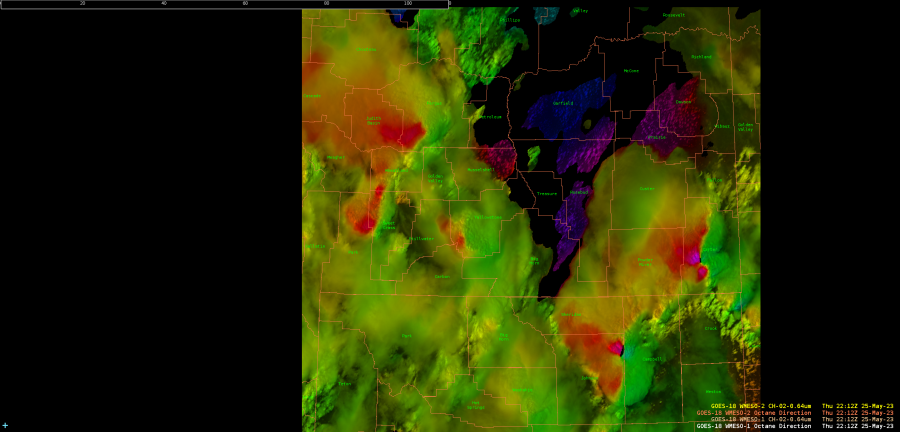
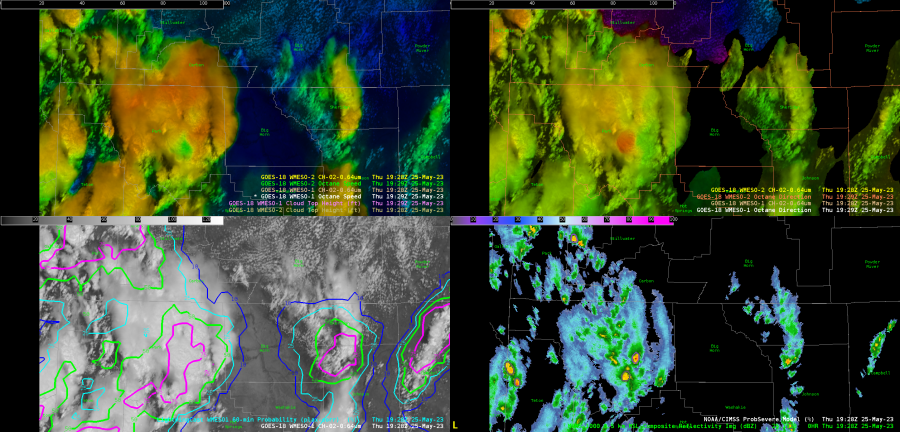
 After a few days at the HWT I have decided to make a four panel of my own with the new products which has been working great! On the top left we have Octane Speed with Octane direction on the top left. We have Vis with lightningcast and GLM 1 min lightning on bottom left. On bottom right I have MRMS data and ProbSevere V3.  I was very happy with this display for situational awareness.

Also in the image below we can easily spot a stronger storm in a cluster of cells in Park County looking at directional and speed shear with Octane. Then we can quickly look down at ProbSevere and see its on the one storm being highlighted. That tells me this is the storm that I need to watch over the next 10-15 minutes for development.

-Thunderstruck

NUCAPS Low Level Lapse Rates Compared to RAP in Convection

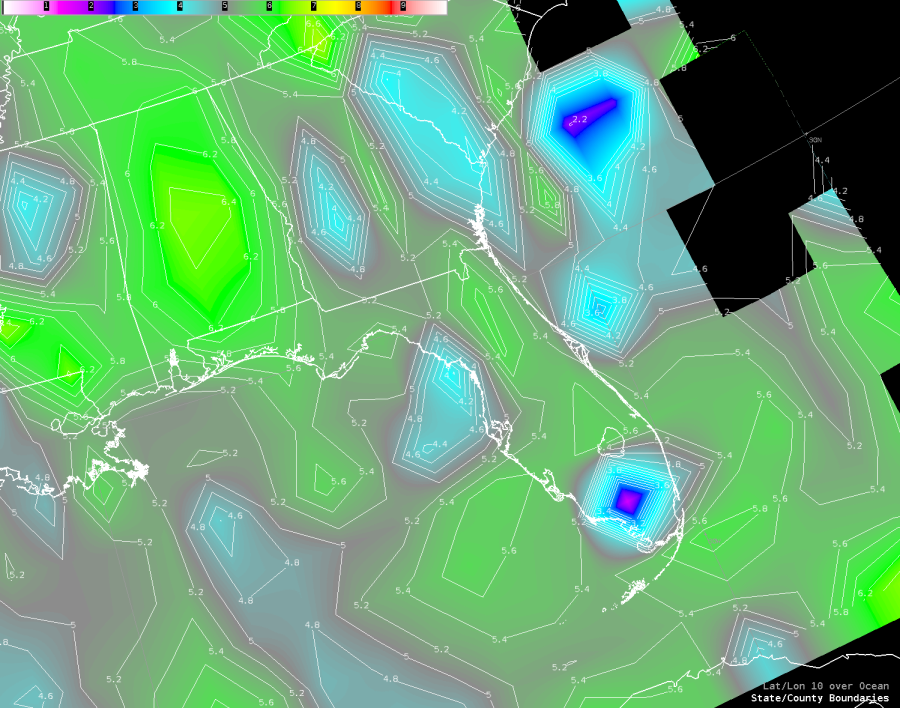
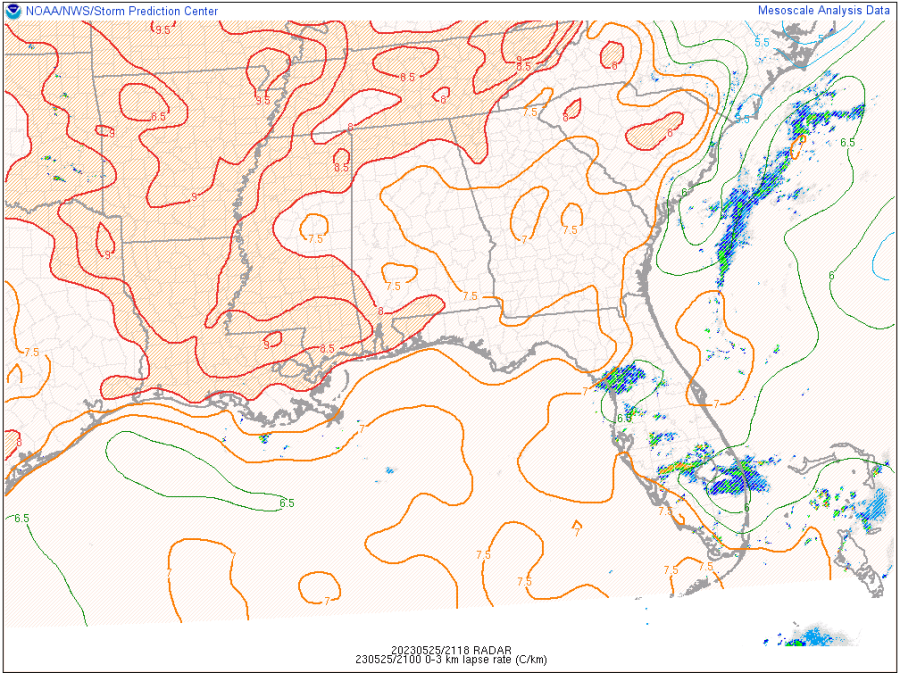
 The 19Z NUCAPS sounding pass went over Florida as convection was ongoing across much of the state. The 850mb to 700mb lapse rate product picked up on some of the convective overturning in southern Florida where lapse rates were far less steep than other portions of the state (indicative of cooler low levels), as well as where low level lapse rates were a bit lower over the western coast. This lines up well with where the RAP was showing lower surface to 3 km lapse rates. Though these two levels are not completely analogous , they represent similar processes post-convection. However, the NUCAPS pass is also picking up on lower 850-700mb lapse rates over Georgia and South Carolina which doesn't match with the lower lapse rate product from the RAP, but these areas were also not experiencing convection so the reason for this could be due to other factors.

-Joaq

Outflow Boundary Heading Towards Florida State Fair DSS Event

 Outflow Captured by Radar and Octane Speed Sandwich in West Florida 

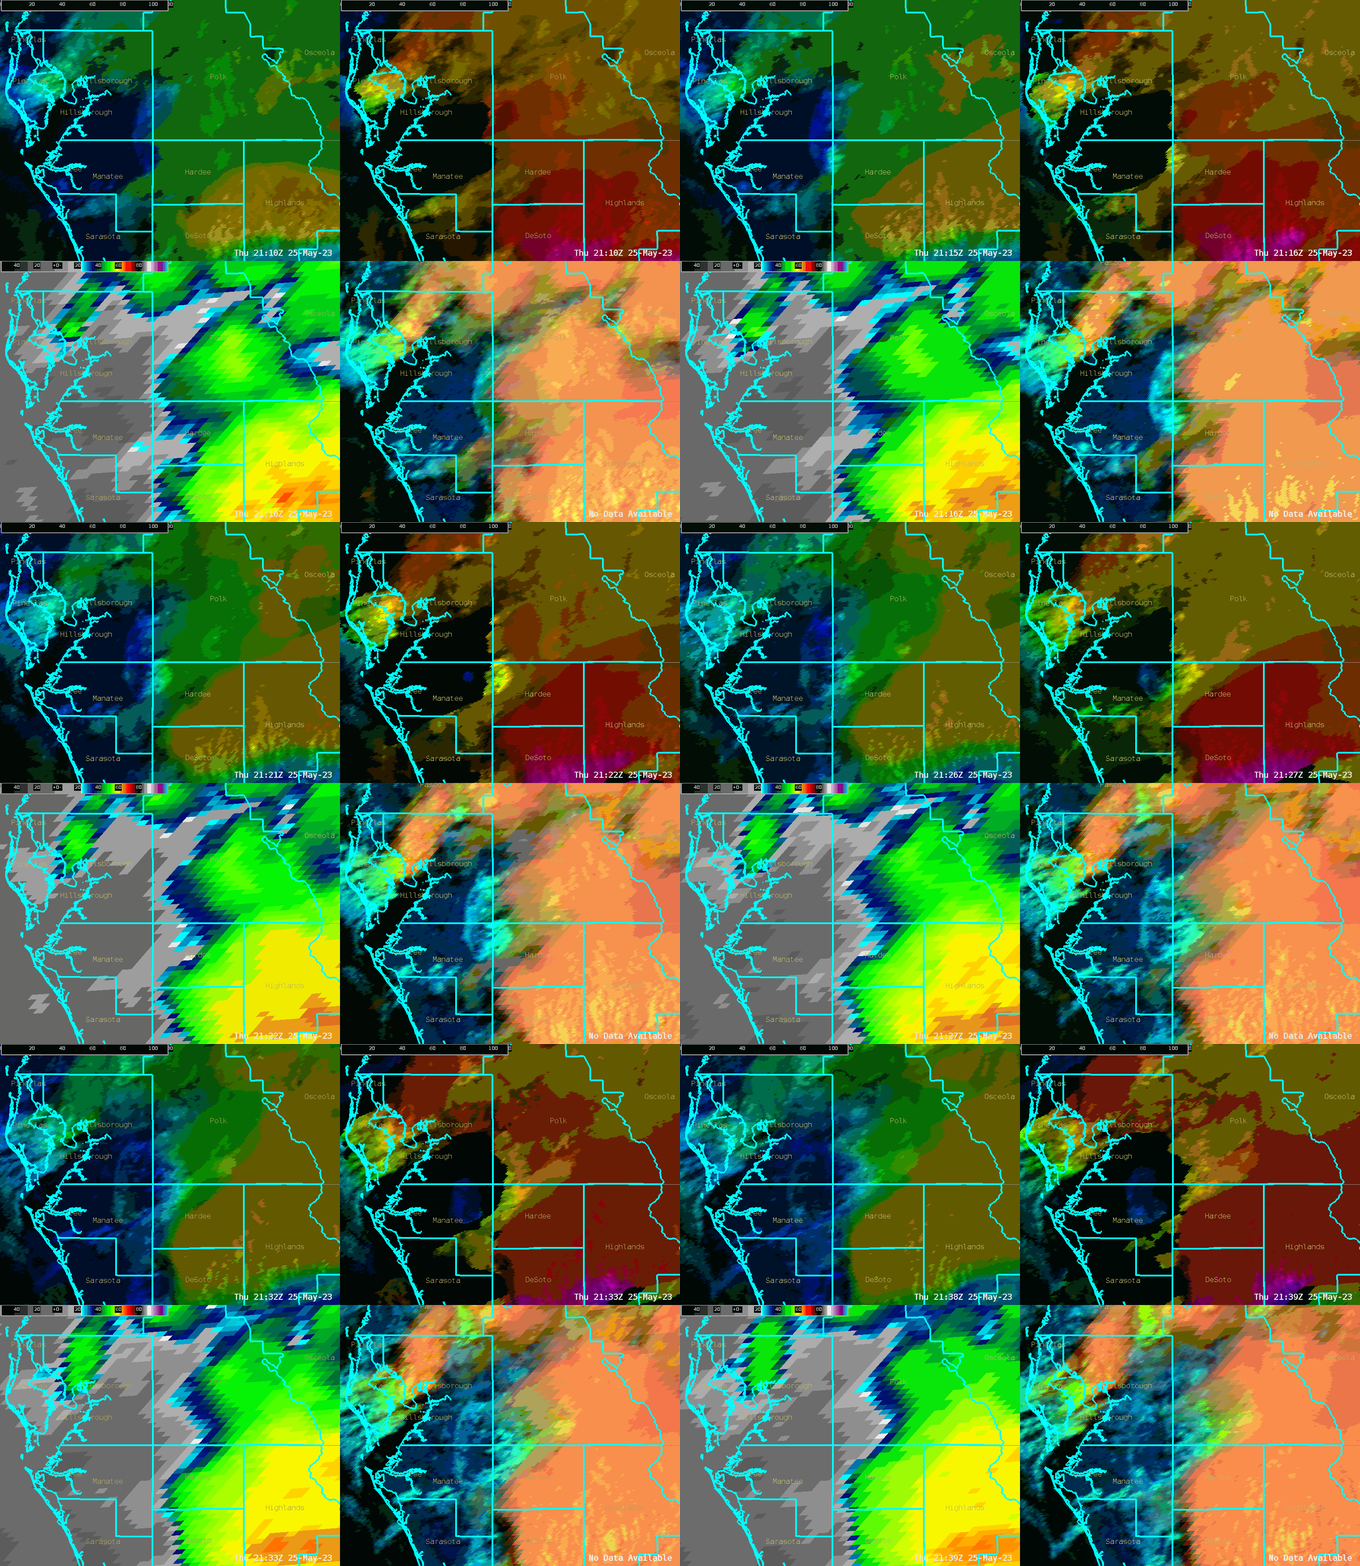
An outflow boundary tracking west towards a DSS Event in Tampa shown via radar. The outflow could be seen up to 20000 to 2500 feet MSL on radar.  Octane Speed Sandwich also captured the outflow boundary approaching the DSS Event.

-Dwight Schrute

Splitting Supercell Over SW TX

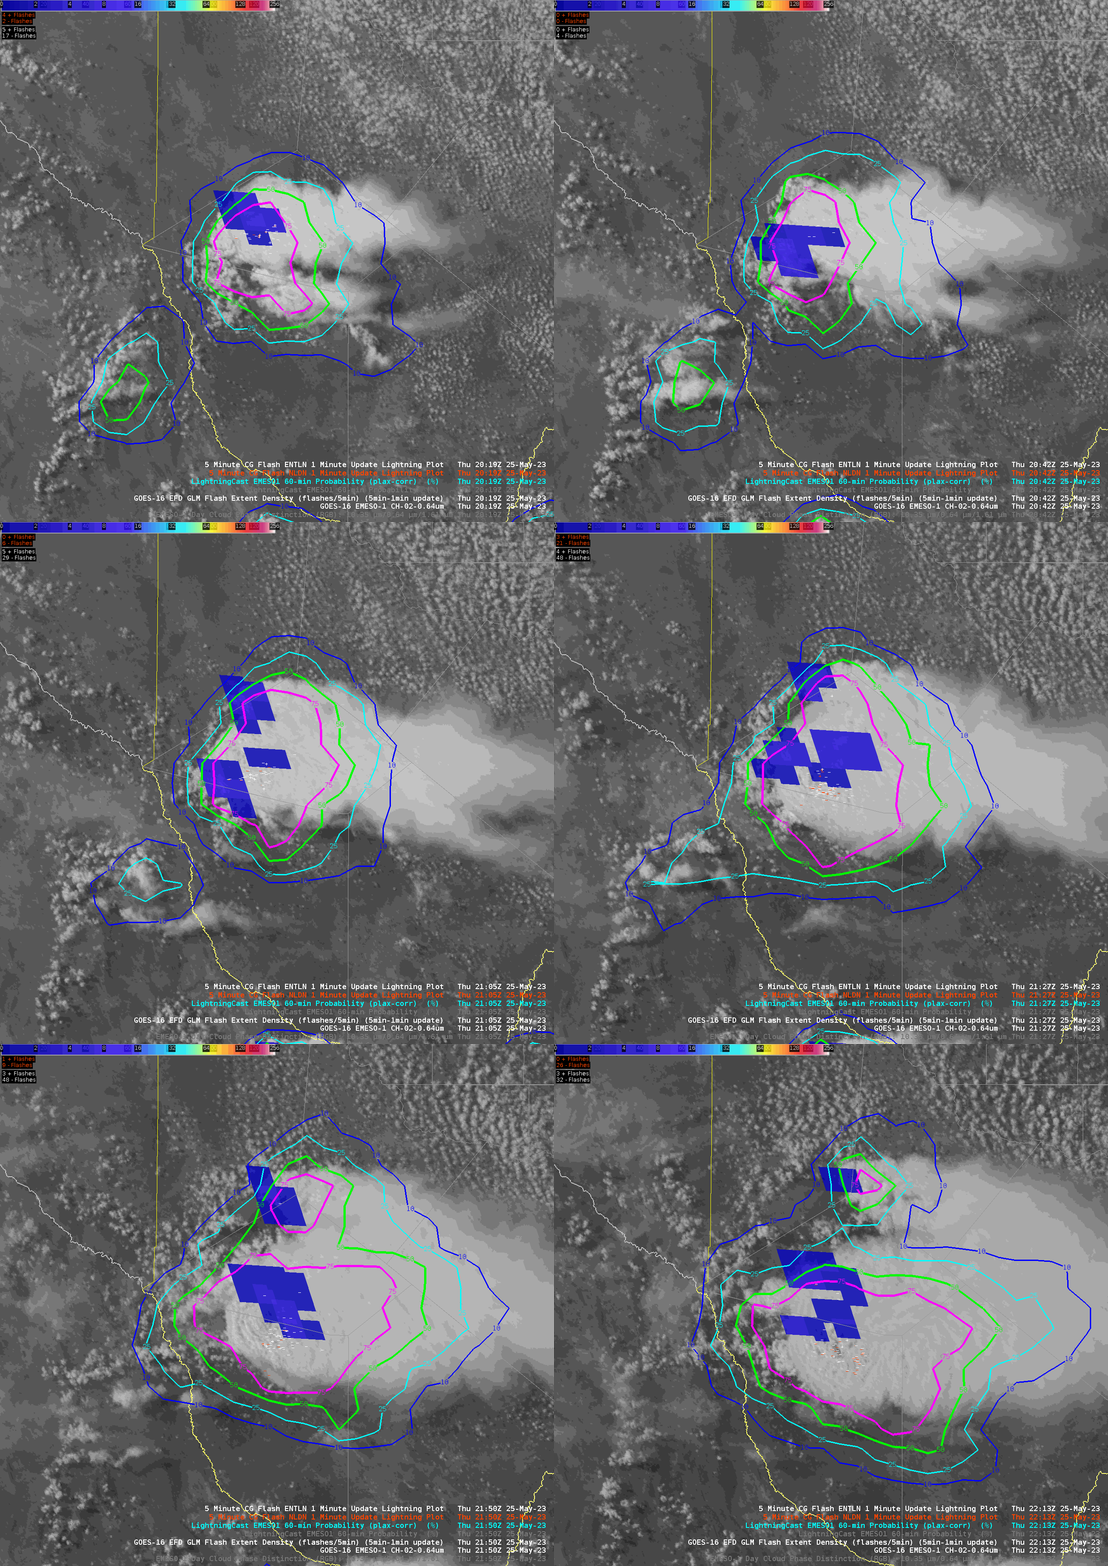
This is an 80 minute loop (in 1-minute increments).  The visible imagery with an experimental GLM RGB overlayed shows a splitting supercell over SW TX on the afternoon of 5/25/23.-Champion

Evolution of LightningCast Over Southern Montana/DSS Event In Billings

 Upper level flow shows continued SSW flow aloft over the region, thanks to deep troughing remaining over the West Coast. Overall forcing through the afternoon is on the weaker side of things, but models show an upper level jet streak nosing into the area. Scattered thunderstorm activity has already developed (below) to the south of Billings in northern WY, and is expected to expand in coverage through the afternoon. The DSS event is noted by the large yellow "B" over Billings.
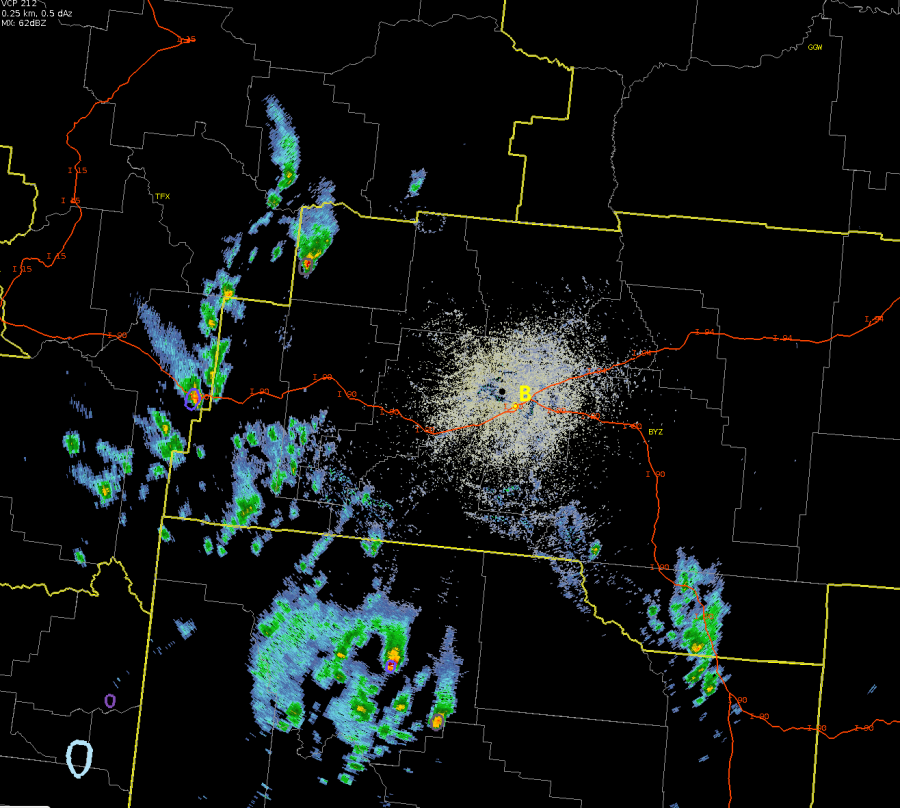
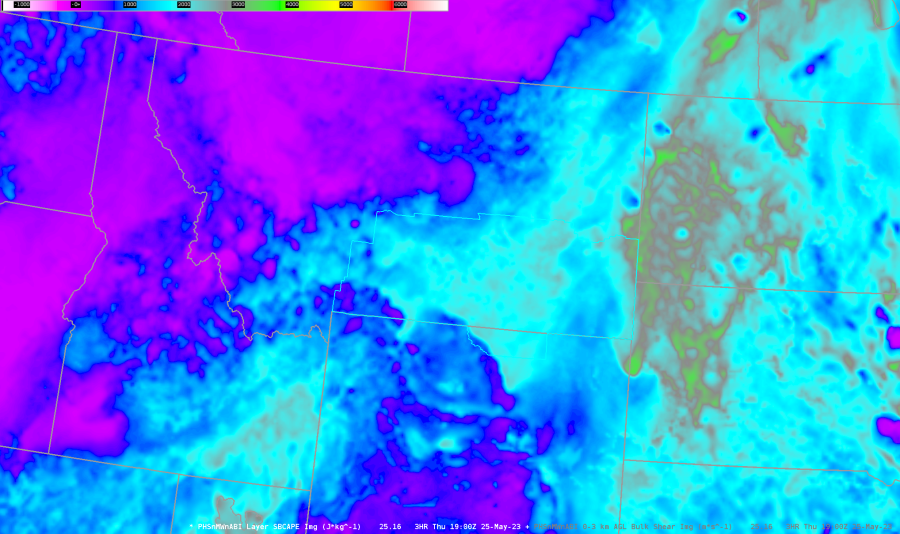
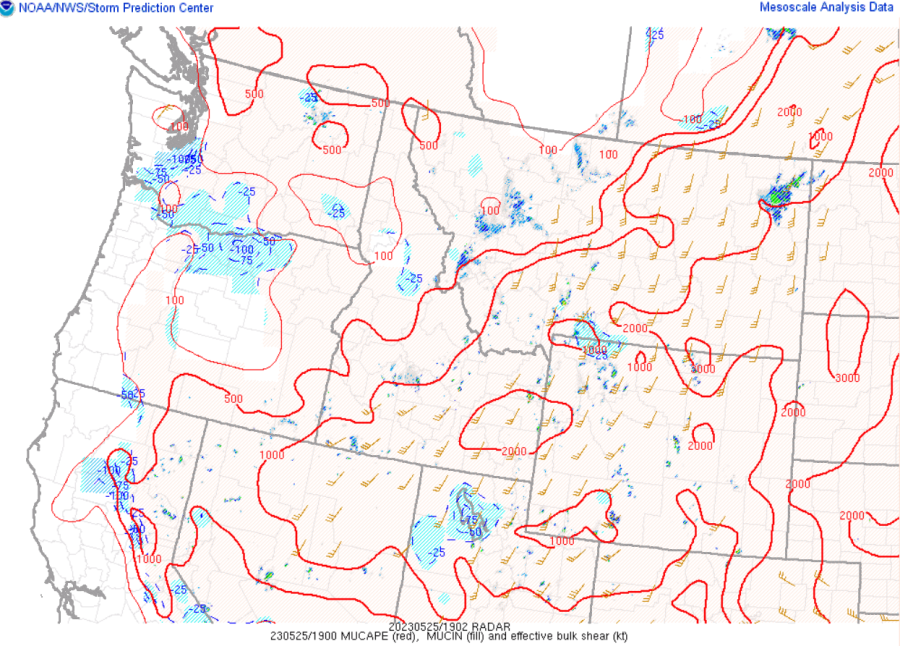
The 14Z PHS forecast output (below) showed 19Z MUCAPE values across the area ranging roughly from 1000-2500 j/kg (with highest values in the eastern areas). Looking further into the mid-afternoon hours, outside of MUCAPE values creeping closer to 3000 j/kg in far NE portions of the CWA, the PHS overall didn’t show any notable changes in values. PHS values of 0-6km shear also matched up fairly well with SPC Mesoanalysis at 19Z, and had values increasing to around 35-40 kts through the afternoon.
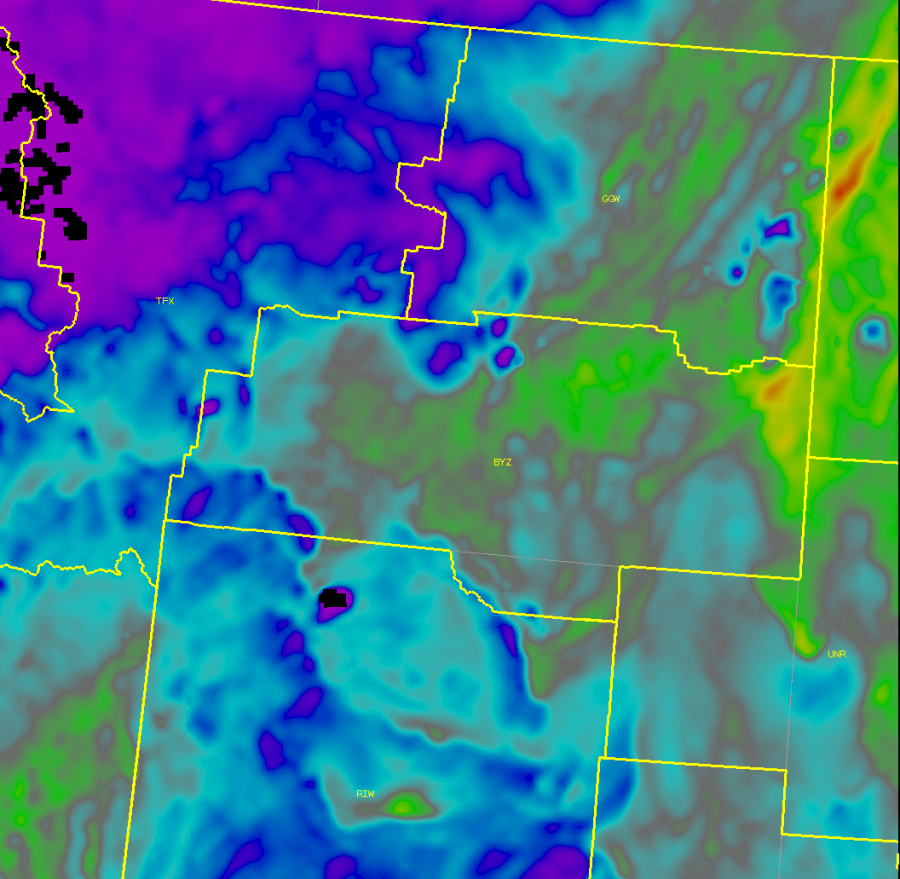
Below is the 19Z MUCAPE via the SPC Mesoanalysis page.
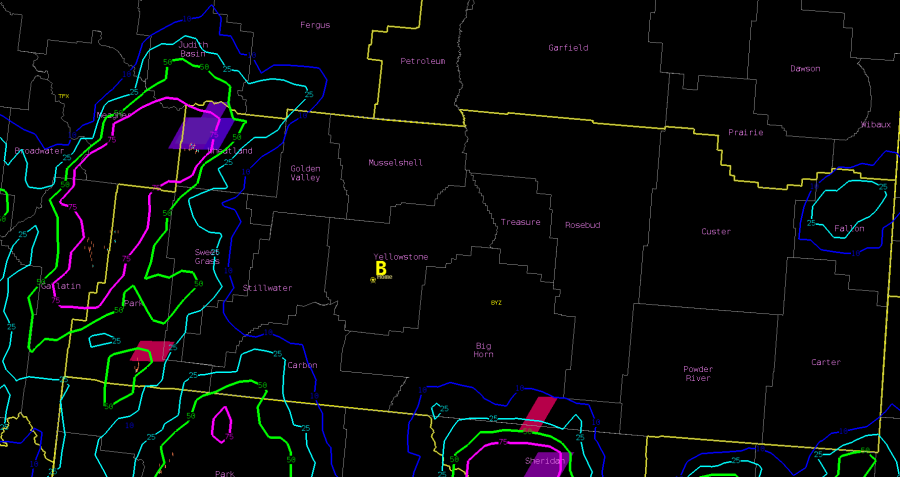
LightningCast right around 19Z showed the 10% probability contour still about 40 miles SSW of Billings at its closest point (below).
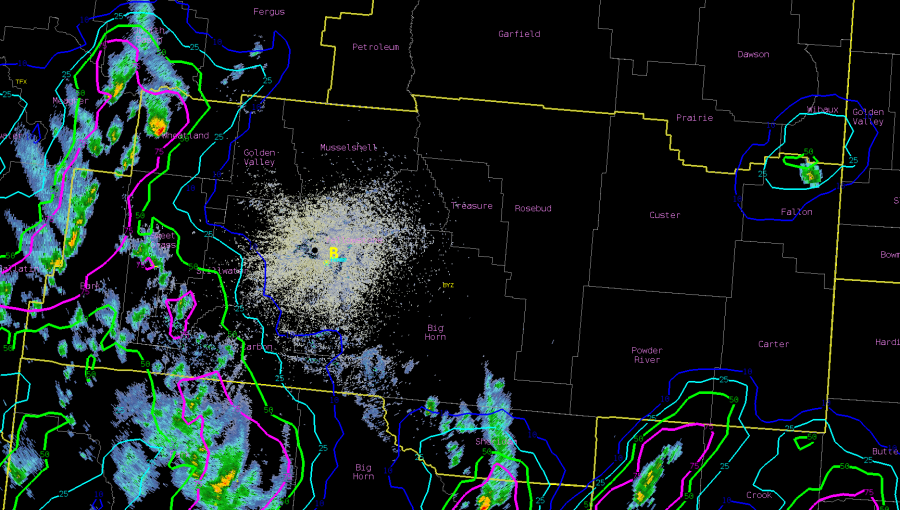
LightningCast right around 20Z showed the 10% probability contour still about 30-35 miles W-SW of Billings at its closest point (below).
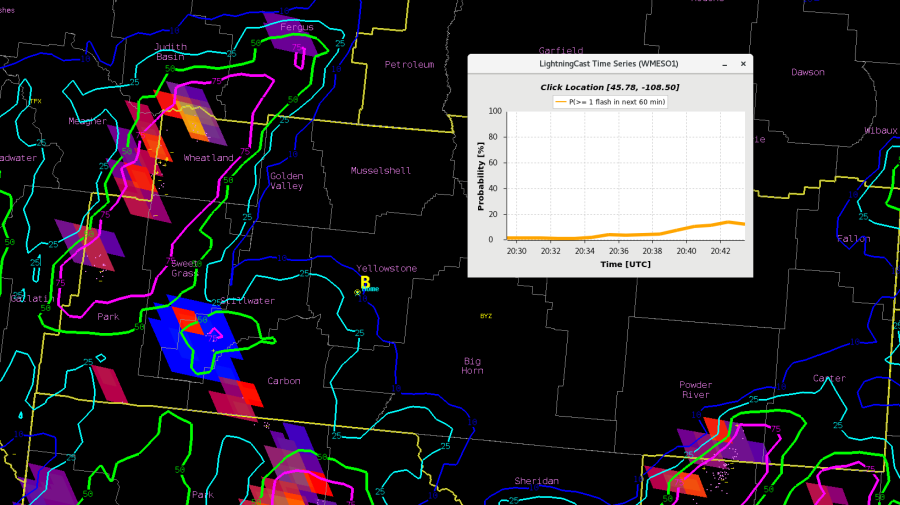
Around 2045Z, the 10% prob. contour reached the DSS event(below), but overall activity continues to be slow to push NNE. The LightningCast Time Series is included to show the trend up to this point.
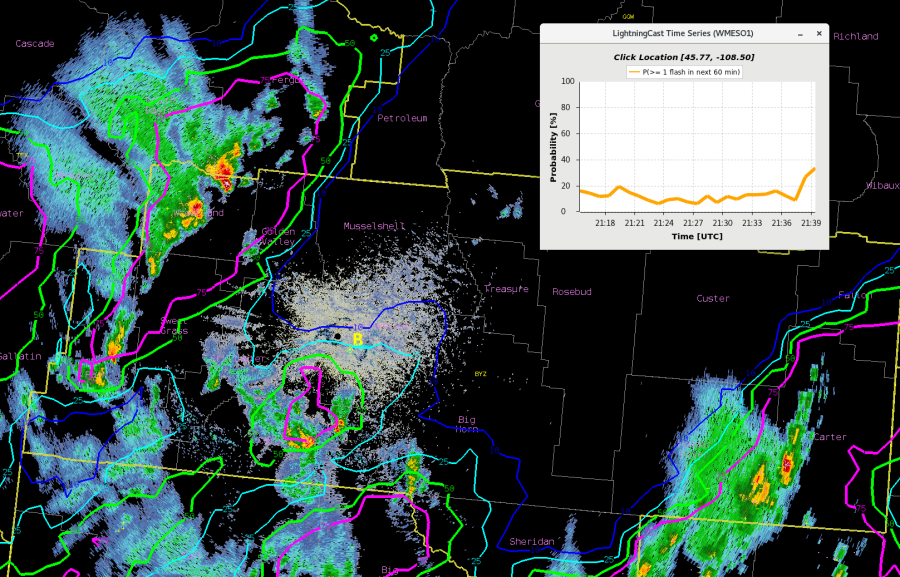
Fast forward to roughly an hour later (~2140Z), there’s been a bit of a jump in the LightningCast Probability/TimeSeries (below), with the DSS event now sitting with a roughly 35% probability of lightning in the next hour.
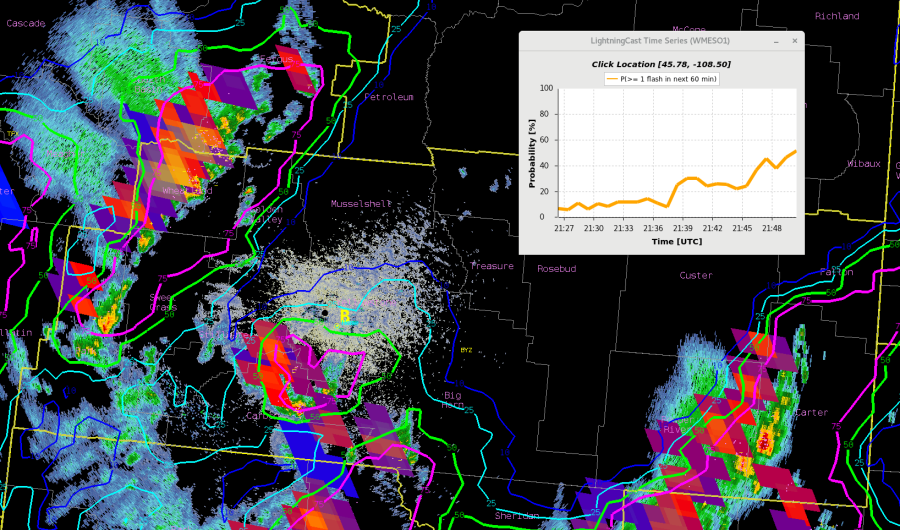
A few minutes later, another jump up in probability - up to around 50%. Below is an image that has the GLM FED (colored pixels) included with the radar, LightningCast, and ENI Total Lighting Plot.

You likely have already been talking with the DSS contact point, but this jump up in the last ~10 mins may warrant another update, conveying that there is an increasing probability of lightning occurring in the next 60 mins.
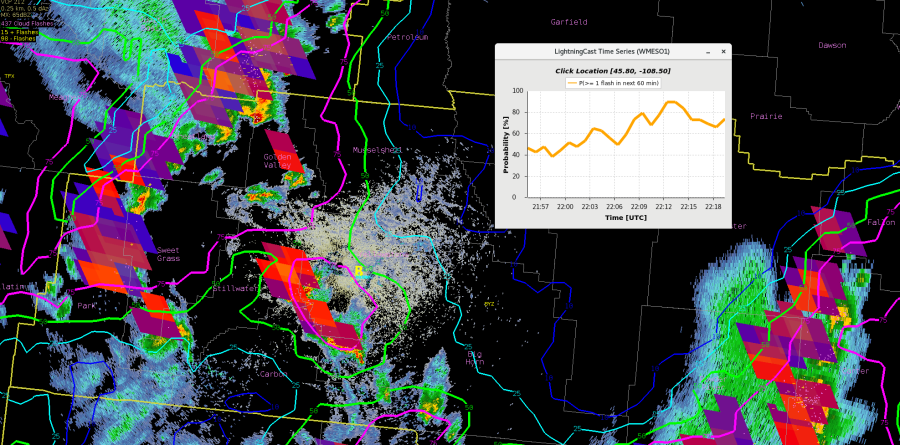
Not surprisingly, the LightningCast probabilities have continued to increase, also shown in the time series. Image is from 2220Z.
What’s the best way to pass along this information to the DSS contact point?

With this type of event, where it’s slow to move in (driven more by the upper forcing vs the somewhat random quicker-developing activity that can occur in high CAPE/low shear  and other types of environments) and no significant changes in the overall environment across the area, perhaps you could wait until it’s closer to 50% or more  before expressing greater concern for the threat of lightning.  In those instances where activity may be quicker to develop/strengthen, it's not out of the question that values closer to the 25% contour would warrant greater concern. No matter the overall environment, I do believe the addition of a shorter-term probability (lightning within 30 mins)  would be beneficial.

- Bubbles
 

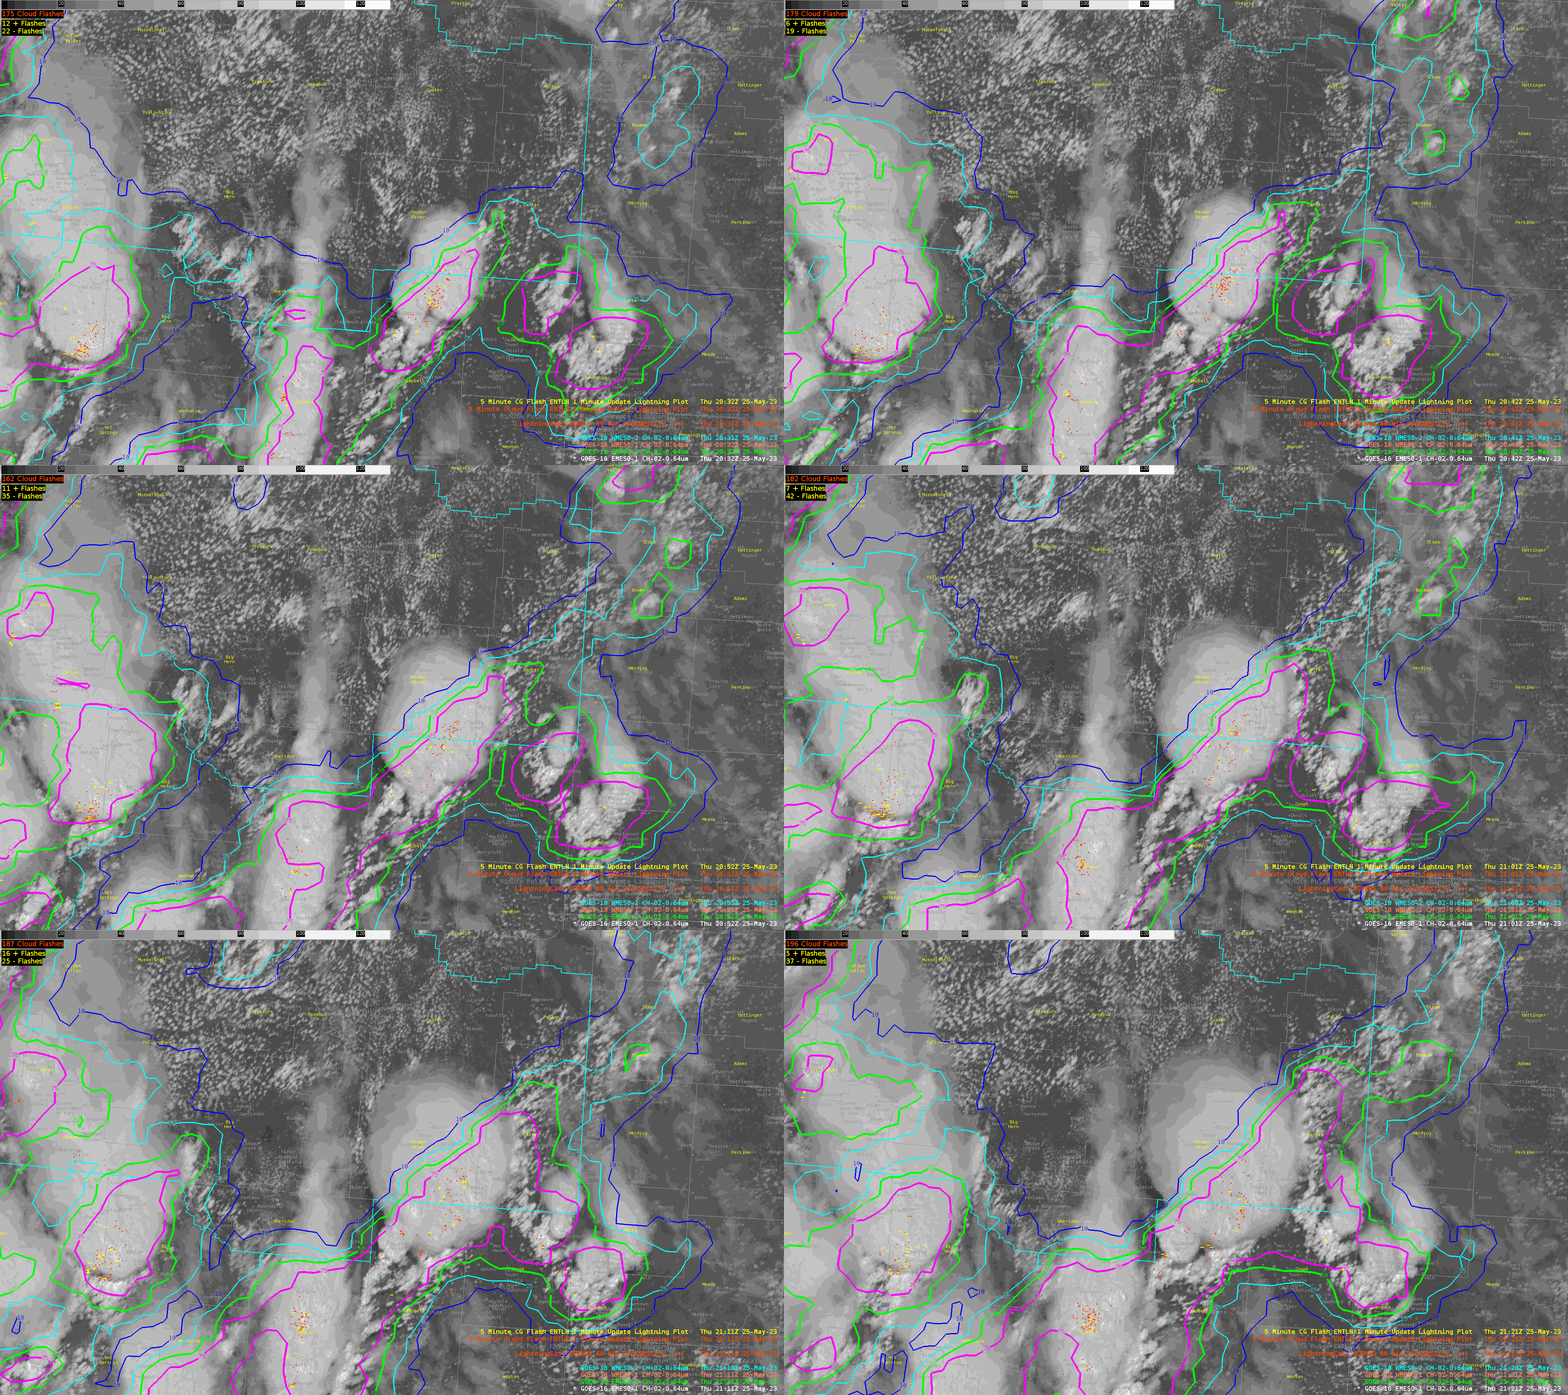
LightningCast And A Splitting Supercell

 This is a 2-hour loop (in 1-minute increments) over SW TX on the afternoon of 5/25/23.  The visible imagery is overlayed with GLM, LightningCast, and CG Flashes for NLDN and ENTLN.  Notice how the LightningCast is able to track the splitting supercell.

-Champion

Extreme GOES-18 Parallax Over Florida

 This animation shows the effects of parallax with the GOES-18 satellite imagery over the west coast of Florida. Overlaid on the GOES-18 visible product is MRMS Maximum Estimated Size of Hail (MESH). You can see MESH objects within the updrafts near the coast line while the associated anvils are well to the east (the displacement a product of the parallax). While GOES-18 wouldn't likely be used operationally at an eastern location, it does show a potential operational use of MRMS and satellite display together, showing the characteristics of the thunderstorm visually with the estimated hail size derived by radar (among other MRMS calculations).

-Joaq

Octane Direction Corrected Wind Speed Color

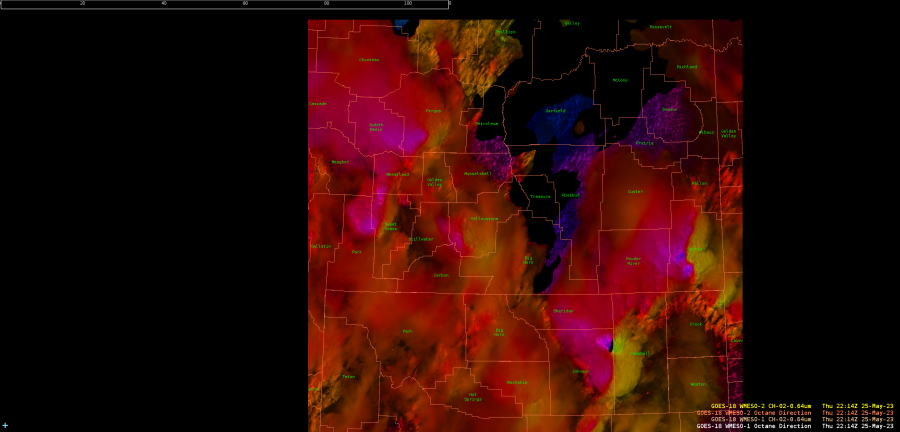
Octane Direction is a useful tool but changing the color table helps. I think we need get away from the pinks and reds. The top image is the corrected color table while the bottom was the uncorrected. Some of the stronger storms still stick out with divergent but a lot of the weaker but still significant outflows are masked by the pinks and reds. For me to get these results I did need to change the table to only go to direction 270 which made everything from 270-360 the same color, which in the current environment worked well. I am hoping with some more experimenting we could find a color table that goes to 360 that looks more similar to the upper picture.  -Thunderstruck

Growing Lightning Threat in Carter County, MT


Growing Lightning Threat in Carter County, MT

LightningCast probabilities steadily increase across Carter County, MT (Far SE MT) through the late afternoon. Perhaps the user could opt to select a more detailed range of probs by using the density radio button option in the product menu. At the moment only the 10/25/50/75% probs are available.

Probailities for lightning are steadily increasing over Carter County as convection forms along the cumulus field observed running SSW to NNE across the county. 

Surface-based CAPE from the PHS product indicate values increasing to 2,000+ J/KG across far SE MT.

- Rain-Free Bass Guitar

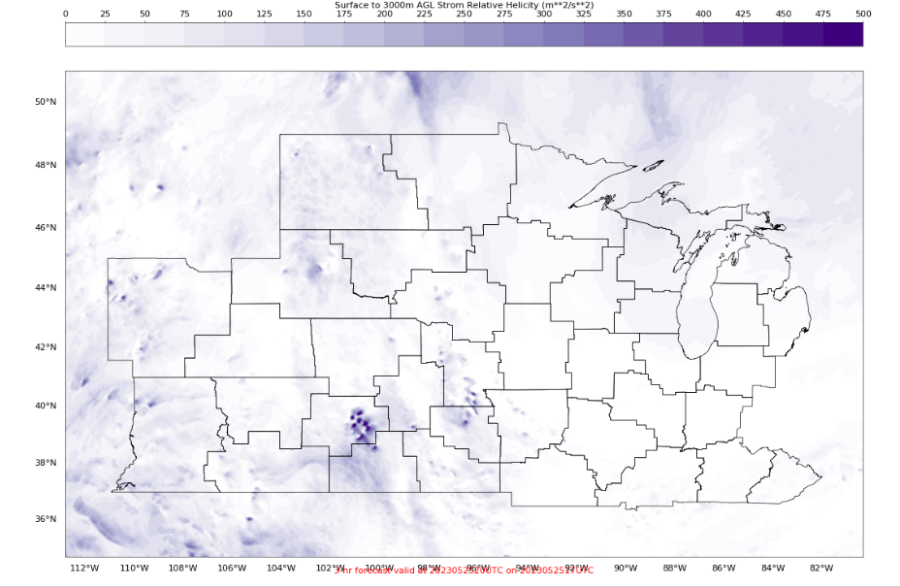
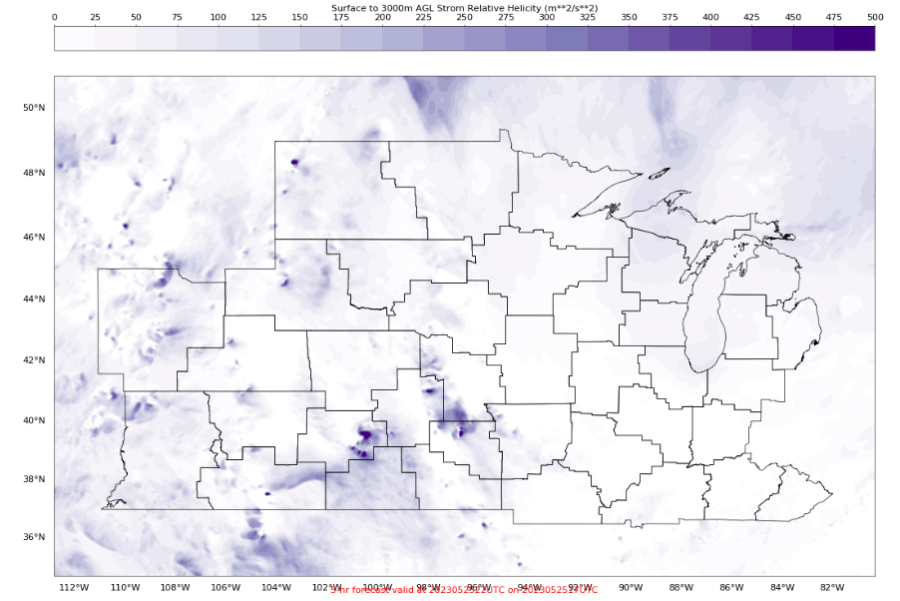
PHS 0-3km SRH for WY/MT - 5/25/23


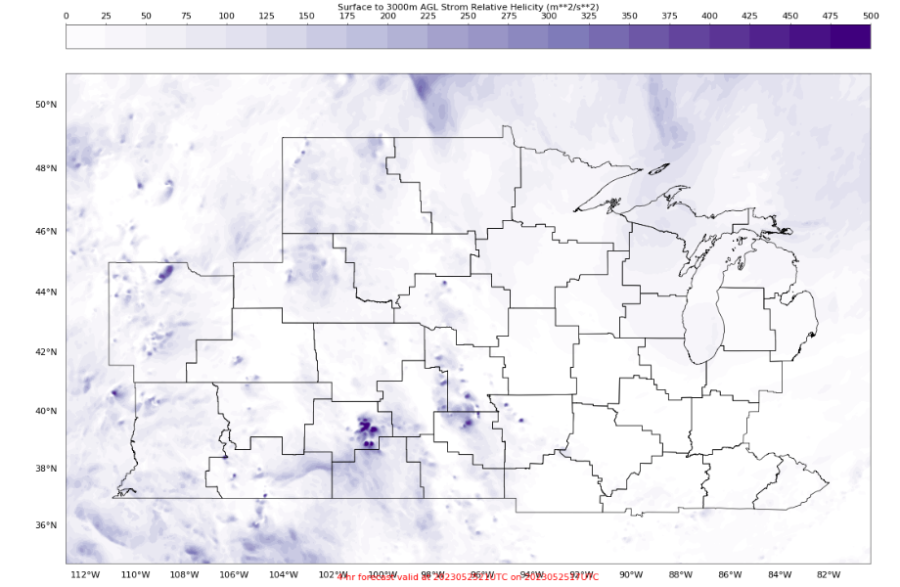
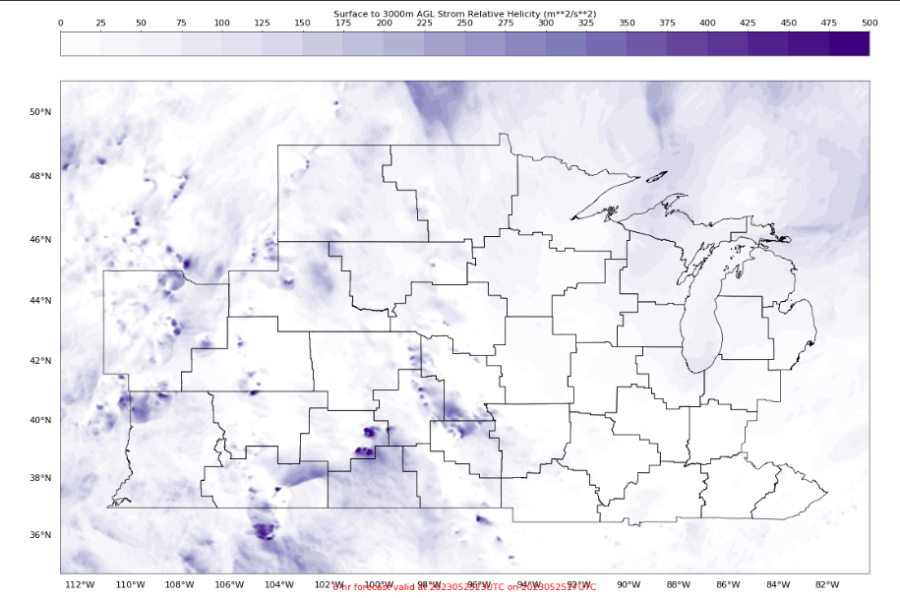
PHS 0-3km SRH for WY/MT - 5/25/23

Shear parameters are highlighted for the afternoon time period across Northern WY and far Southern MT (northwestern portions of the image domain). Radar observations later on indicated this product did well, with several cyclic supercells moving NE to ENE across far Northern WY, and entering into Southern MT at the writing of this post. This product demonstrated higher resolution, though similar placement of convective elements from the same product on the HRRR model.


PHS 0-3km SRH - 20Z - 5/25/23

PHS 0-3km SRH - 21Z - 5/25/23

PHS 0-3km SRH - 22Z - 5/25/23

PHS 0-3km SRH - 23Z - 5/25/23

- Rain-Free Bass Guitar