If we look at the cell on the border of Huerfano and Las Animas at the beginning of the loop has high speed (red and yellow) on the loop showing a mature thunderstorm. However, as the loop continues we notice the wind speeds quickly drop (green). This indicated the storm was starting to weakening which was verified on radar. 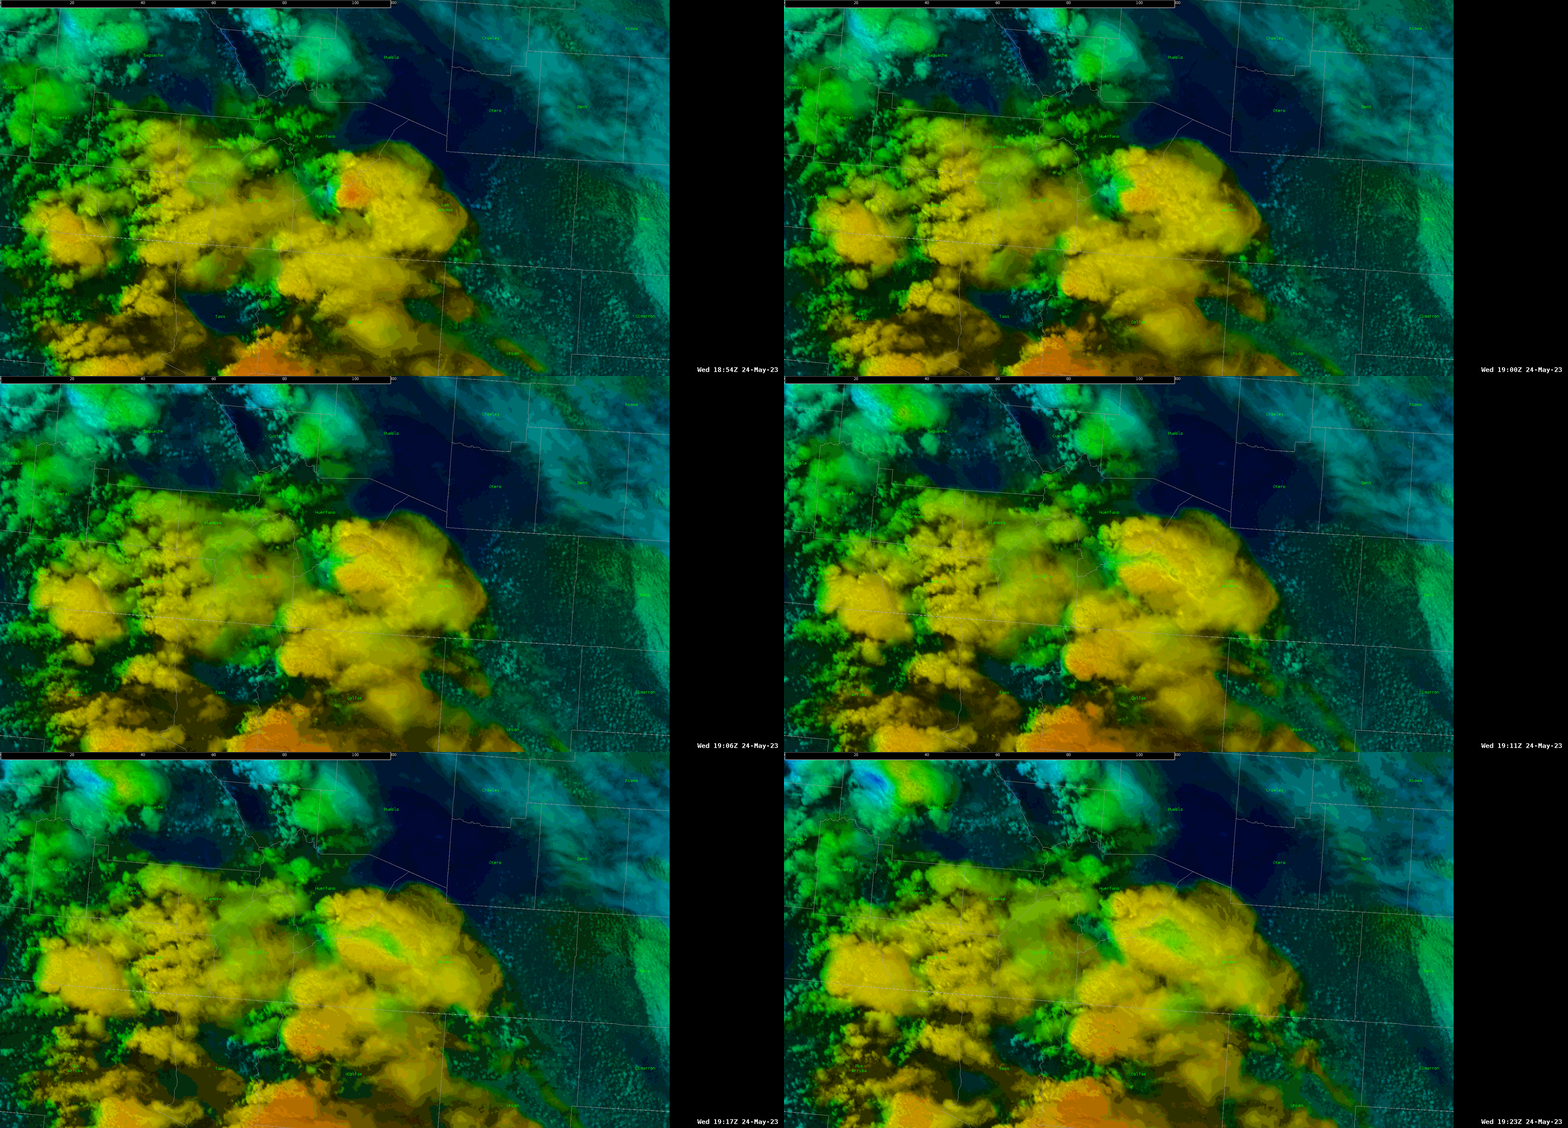 -Thunderstruck
Wednesday, May 24, 2023
Octane Weakening Storm
Finding The Low Level Moisture Axis From The Octane Direction Product
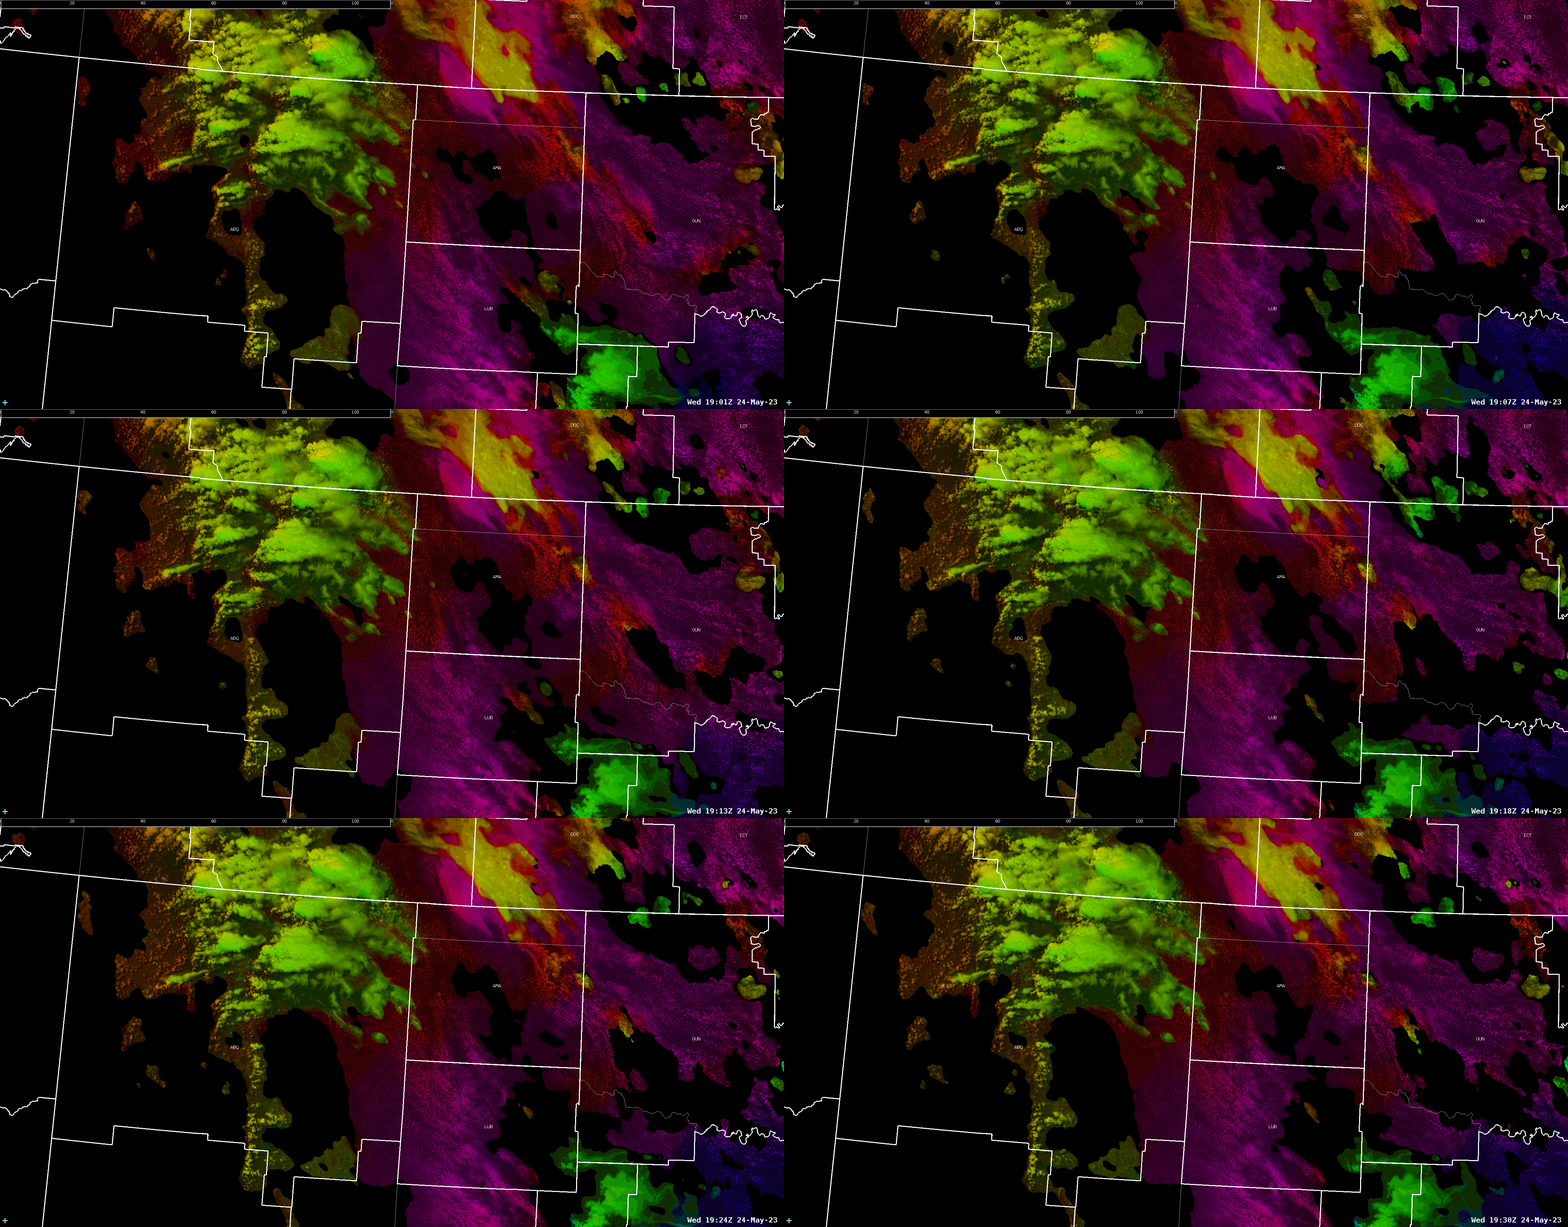
The 19Z Octane Direction product depicts the low level southerly-flow moisture axis well with the the red/purple hues of the shallow cumulus from northeast New Mexico through the AMA and LUB CWAs. This clashes well with the westerly greens shown from the maturing convective towers and anvil clouds coming off the ABQ terrain, lining up with the westerly flow aloft. It's difficult to see the separation from where convection is rooted currently in north central New Mexico compared to where the southerly moist axis is to the east. That said, it's fair to expect a more favorable convective environment within that moist axis for thunderstorms to move into and strengthen later this afternoon or evening.
-Joaq
Storm Top Divergence Progression in a Severe Storm With Octane Products
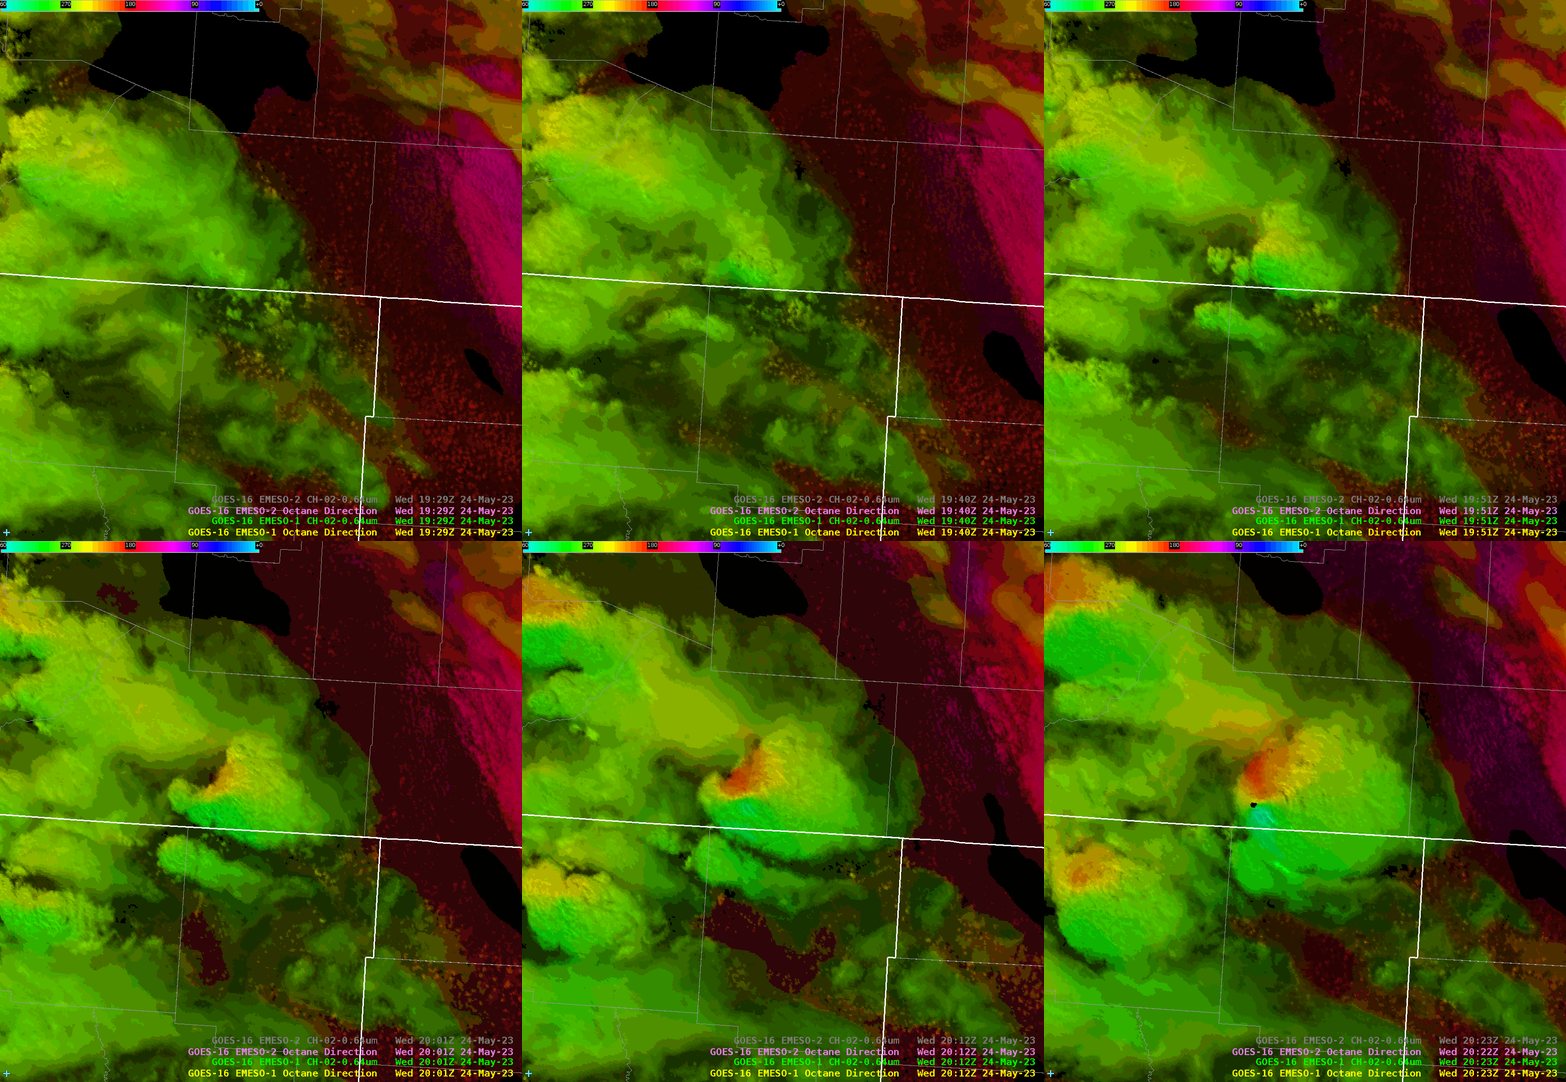
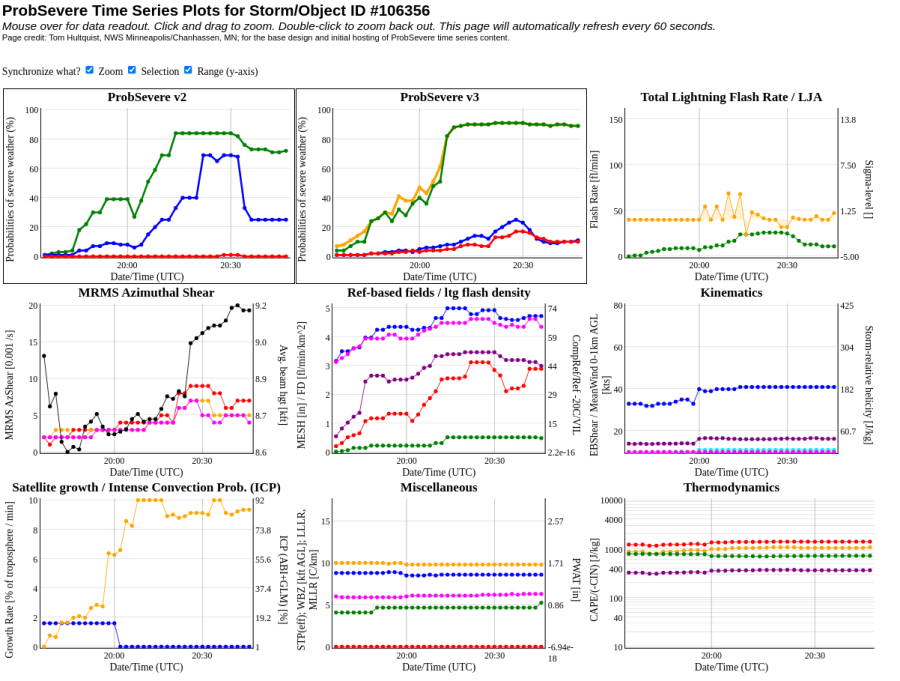
Shown is the progression of developing tower to severe storm with strong storm top divergence on the thunderstorm over the Colorado/New Mexico border. From around 1940Z to 1955Z the Octane Speed showed the development of storm top divergence while both versions of ProbSevere increased in severe probabilities. The Octane Speed product then showed the upshear side of the storm become "stationary" as the storm top divergence strengthened even further after 20Z, lining up with ProbSevere V3's signal that the storm had become severe.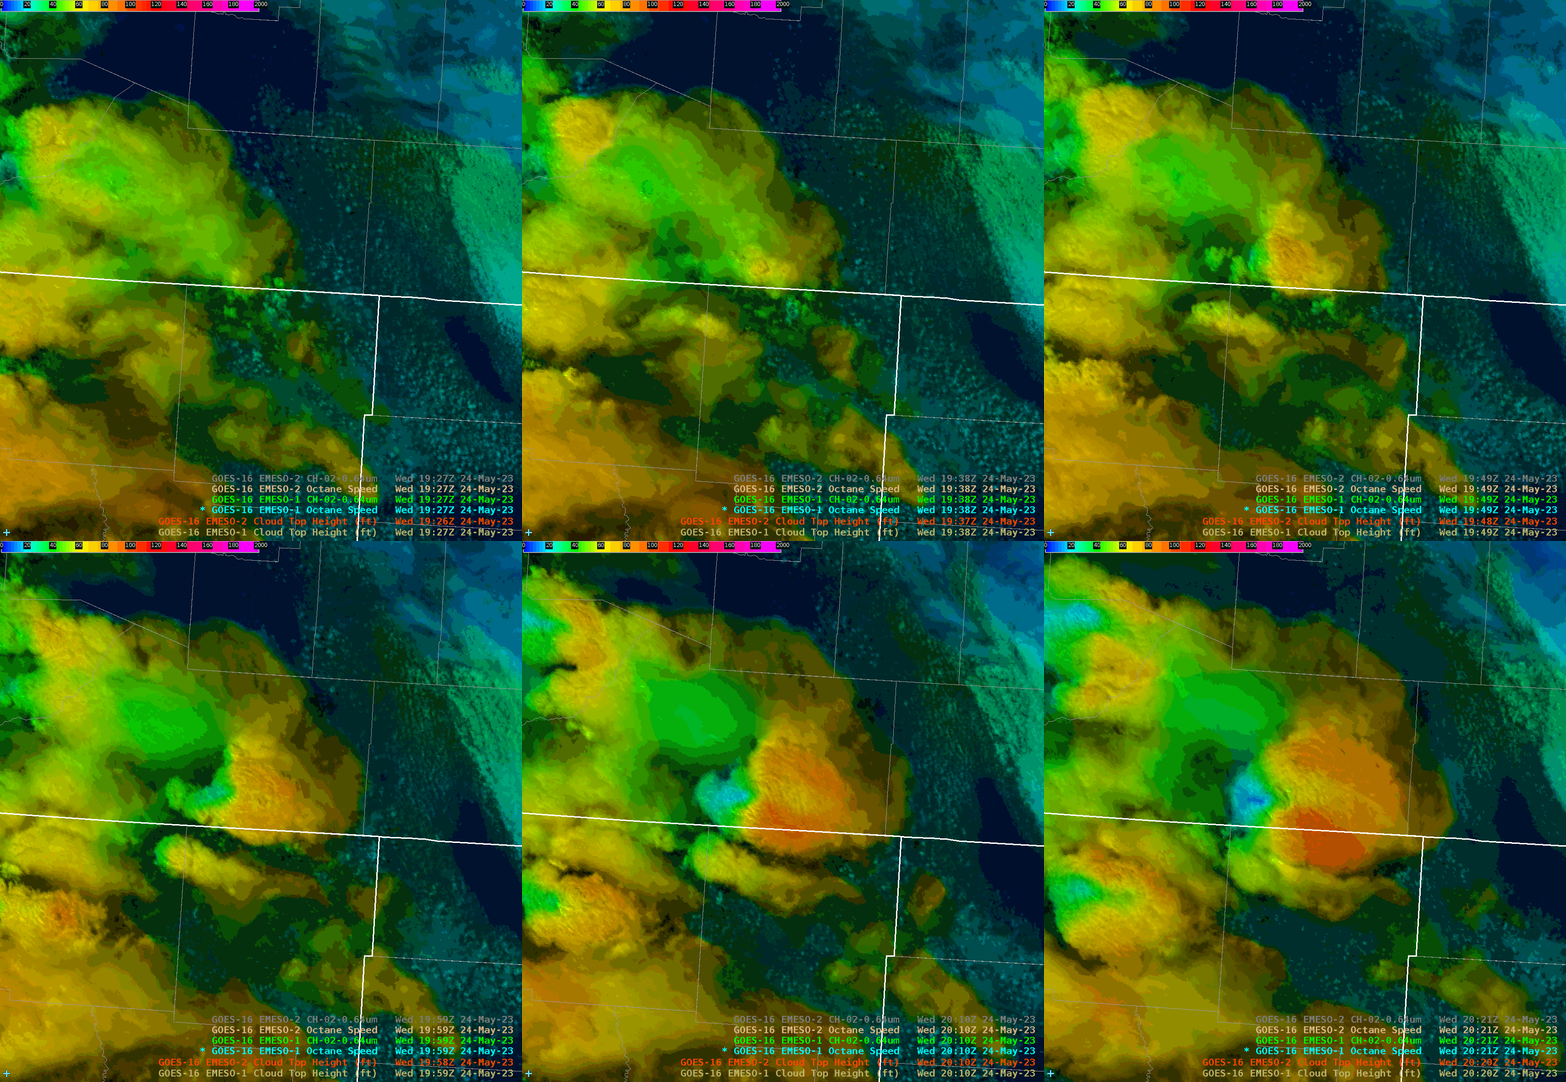
-Joaq
Differences in low level moisture between NUCAPS and guidance
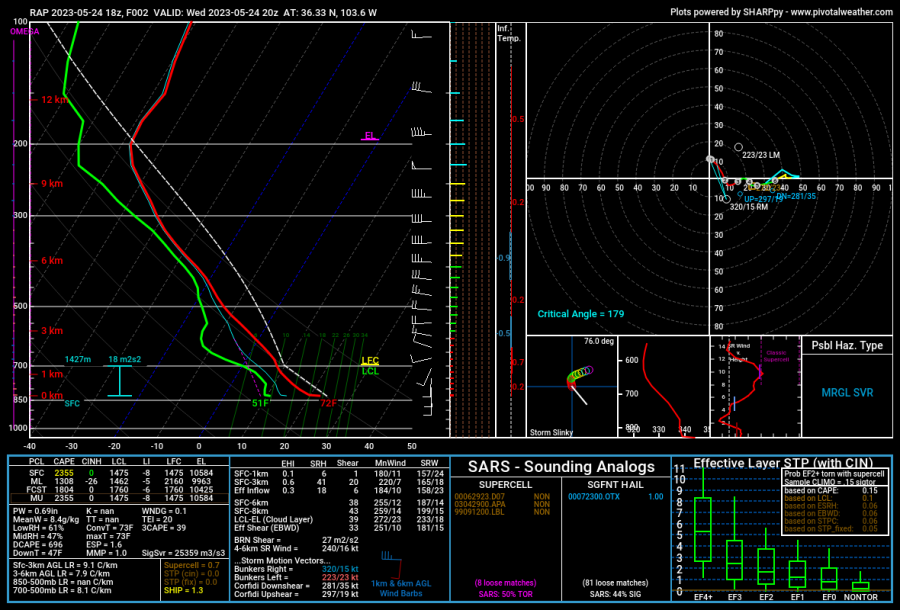
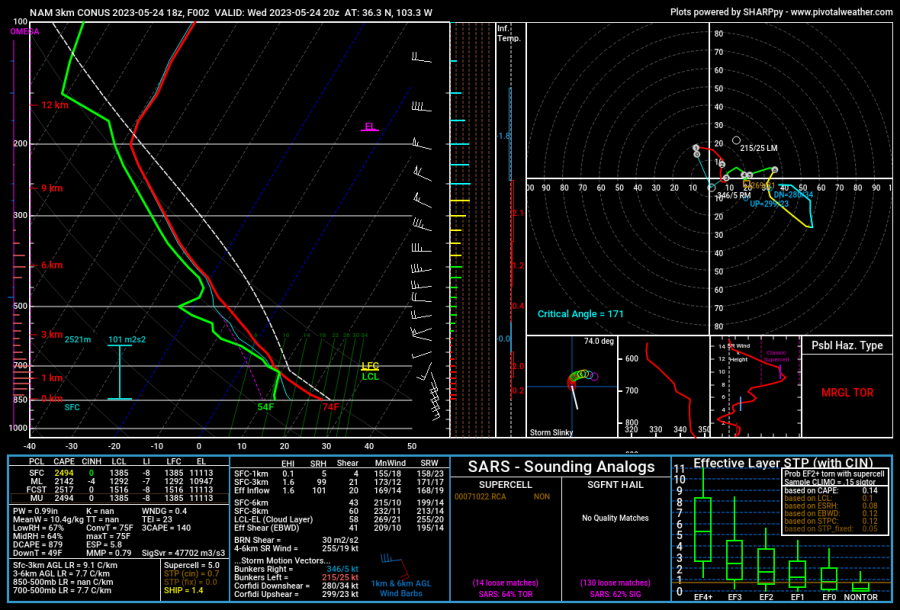
The NUCAPS sounding pass showed greater MLCAPE than the RAP sounding shown as well as the RAP output on the SPC Mesoscale analysis. A difference may be how the RAP is mixing out low level moisture, as it has a lower mean mixing ratio (8.4 g/kg) than both the NUCAPS pass and the NAM forecast sounding at the same point (10.1 g/kg and 10.4 g/kg respectively). The NAM is known to have an undermixing bias but may be closer to reality in situations like this where the surface isn't quite so hot and dry, giving more confidence to the NUCAPS instability. Convection this afternoon is building into this area of instability, which makes the analysis important as it could play an impact on the magnitude of severe hazards.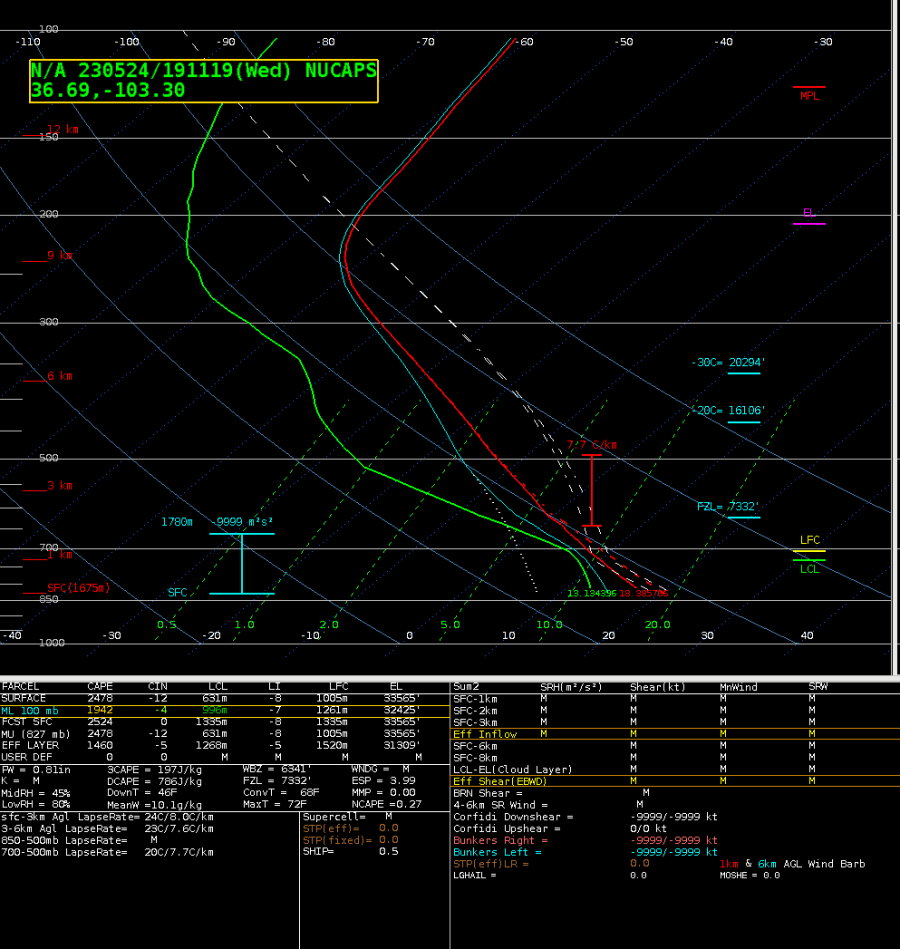
-Joaq 
Octane Captures Intense Updraft Over NV
Here is a 1 hour loop (1-minute increments) of strong convection over NV. The top image is Octane Speed with DMW overlayed. The bottom image is MRMS 0.5 km MSL Composite Refl. Notice an intense updraft develop in the center of the screen. The blue indicates lower winds while green/yellow are higher. Winds get as low as 2 kt in the anvil, while just downstream of it they are 30-40 kt!!! The DMW confirm this as they are generally within 5 kt of the Octane speed. Shortly after this happens, reflectivities rapidly increase. 
-Champion
PHS PreStorm Environment
Looking at the pre-storm environment using PSH we can see higher MUCAPE in the eastern most portion of ABQ CWA. We also looked at the SHIPS model on the PHS website and saw high number also in the eastern region of the CWA. That indicated to use the best chance of storms would be in the eastern most half of New Mexico and the biggest threat would be hail. PHS did excellent in this event. We have been seeing a few good hail cores in the area of the highest CAPE while areas to the west of of higher CAPE has see a storm or two but nothing close to severe. 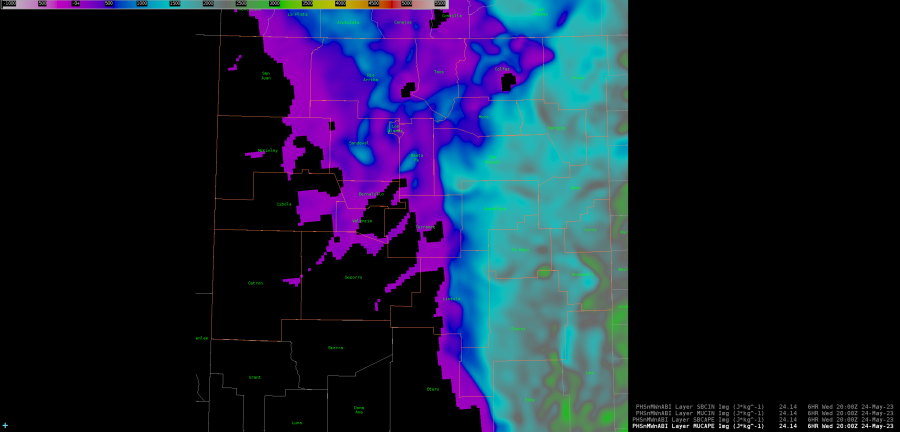 .
.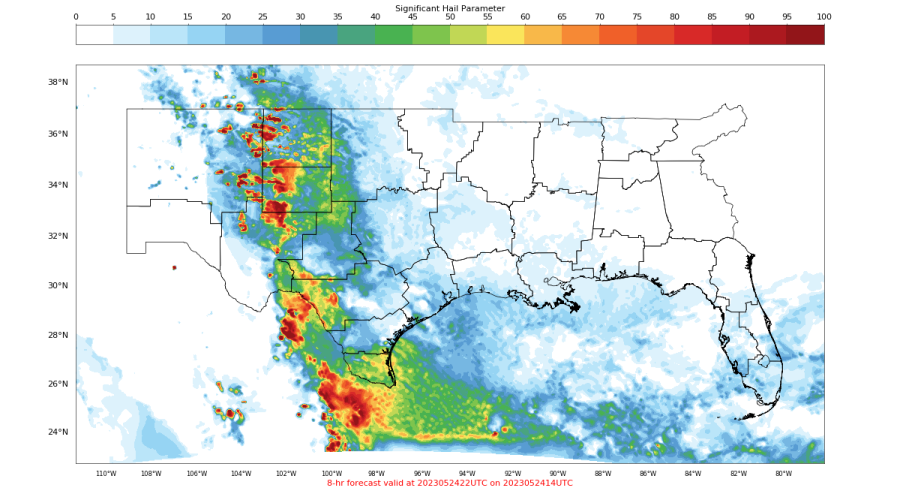 -Thunderstruck
Octane and ProbSvr Highlight Elko County Supercell
Octane and Prob Severe Highlight Elko County Supercell
As thunderstorms continued to mature through the afternoon, the Octane speed sandwich continued to highlight an increase in downwind velocities from an isolated supercell across central Elko County. In tandem with the increased downwind velocities, a minimum in velocities occurred on the opposing upwind side of the strengthening supercell.
ProbSevere v3 highlighted the increasing trend in severe probabilities and in tandem with the Octane speed sandwich product, and solidified the decision to keep a severe thunderstorm warning in effect for the central Elko County supercell. Prob severe values were quite a bit higher with v3 compared to v2 (see details below). The decision to not issue a tornado warning was due to the high LCL values in the region (>1,800 m AGL), despite increased ProbTor values maxing out around 17% for this supercell.
Octane speed sandwich for severe-warned storm across central Elko County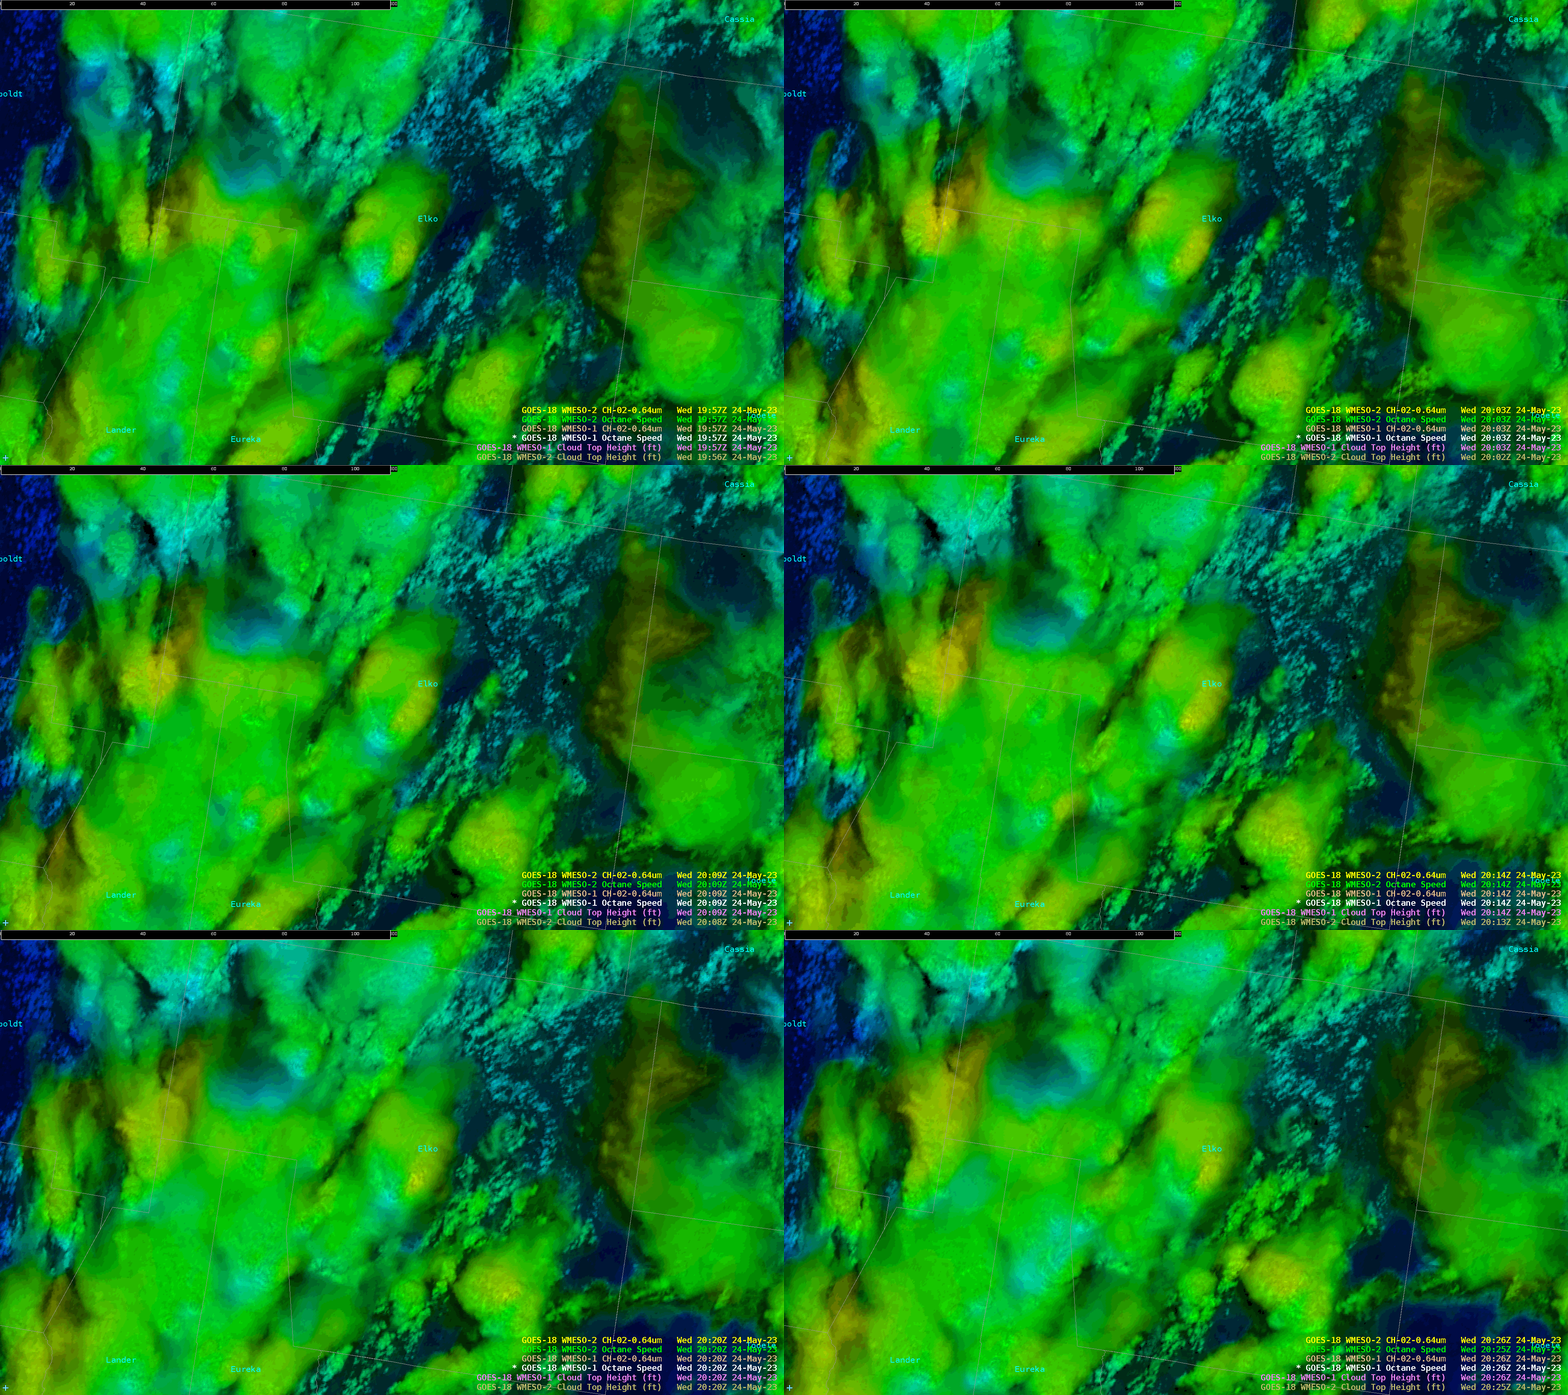
Prob Severe v3 at 2028Z for severe-warned supercell across central Elko County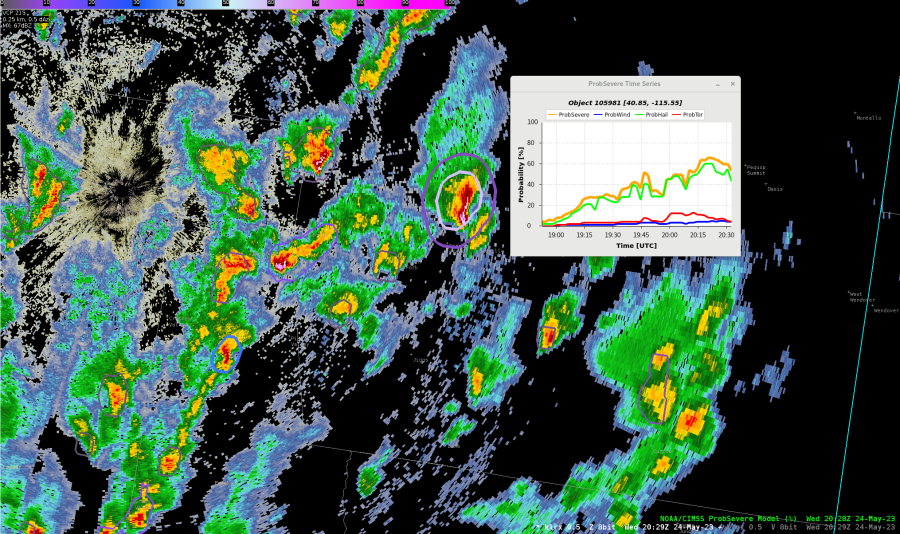
V-SRM-HC-SW at 2110Z for central Elko County severe-warned supercell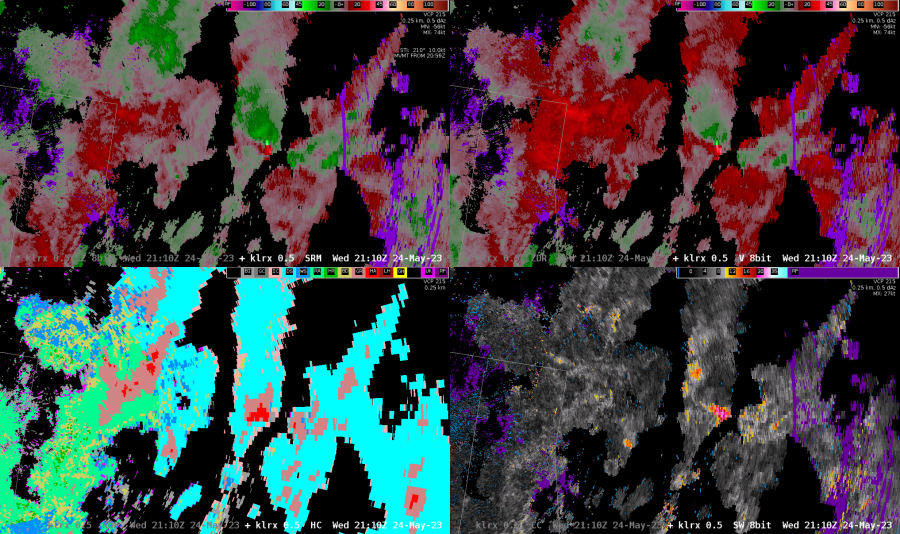
ProbSvr v3 at 2116Z for central Elko County severe-warned supercell - 82% v3 vs 37% v2 Probhail 73% v3 vs 30% v2; Probwind 14% v3 vs 42% v2; Probtor 17% v3 vs 2% v2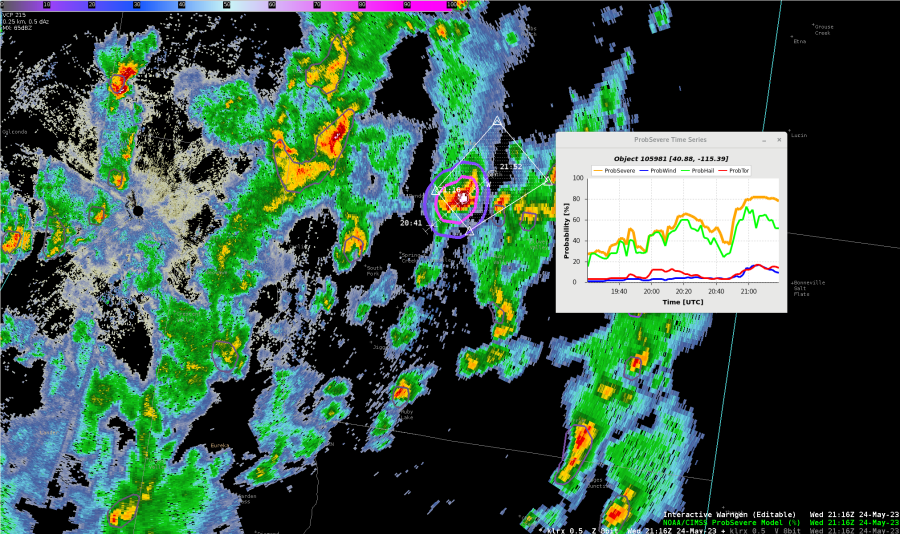
Octane Speed and GLM Act as Nudgers for west central Elko County Severe Warning
Octane Speed and GLM Act as Nudgers for west central Elko County Severe Warning
The Octane speed sandwich product highlighted a minimum in velocity in a rapidly developing thunderstorm across west central Elko County, NV, an indicator of strong outflow in the anvil on upwind side of the developing cell. An analysis of 1-minute GLM data also indicated a rapid increase in flashes for the same storm. These indicators acted as strong nudgers for the severe thunderstorm warning decision making process.
Octane Speed Sandwich indicates explosive convective development in west central Elko County. 2027Z to 2054Z
Visible satellite imagery coupled with 1-minute GLM depict rapid increase in lightning in west central Elko County. 2012Z to 2054Z
- Rain-Free Bass Guitar
PHS Highlights Instability Axis - Elko, NV
PHS Highlights Instability Axis - Elko, NV
High resolution thermodynamic parameters from PHS appeared to be in line with meso-analyzed products from the RAP (SPC Mesoanalysis). The benefit with PHS is the 2km resolution output, highlighting terrain features in the CWA. Composite reflectivity product performed well with expected convection through the afternoon, and helped with the creation of a mock DSS graphic that included up to 3 hours of lead time for an airshow in Wells, NV.
PHS SB CAPE at 19Z prior to CI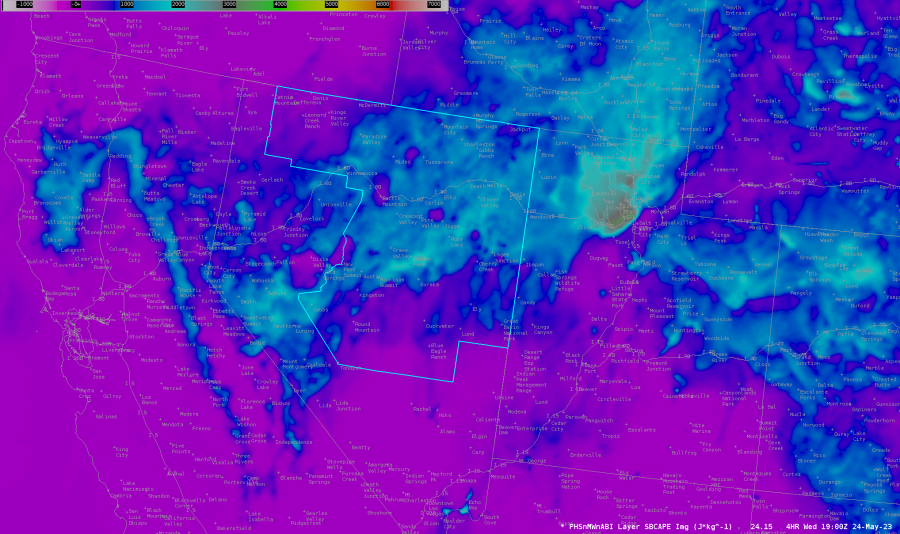
PHS Comp Refl at 18Z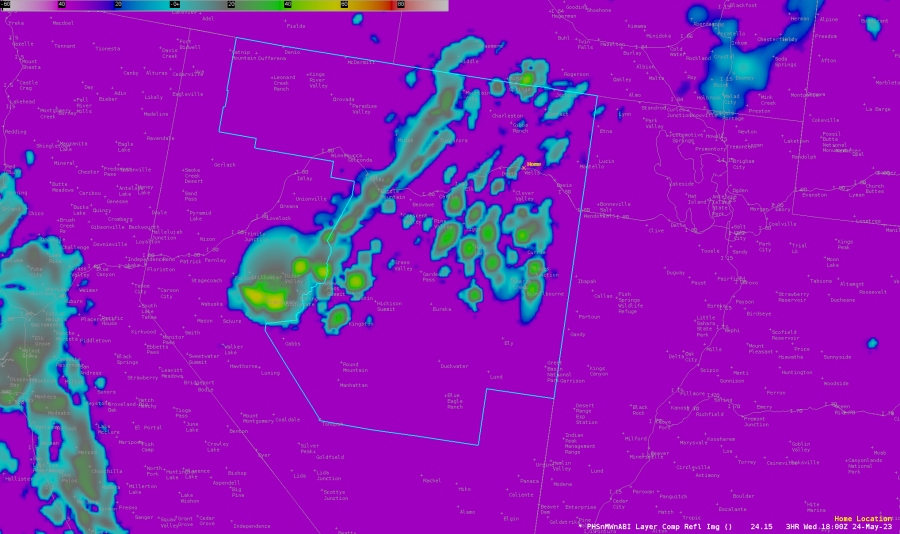
PHS Comp Refl at 20Z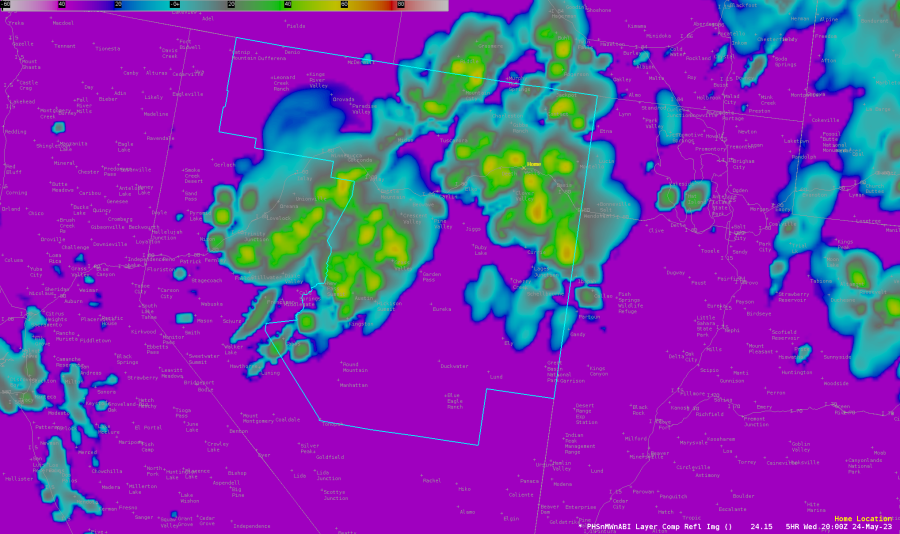
LightningCast Over Eastern MT
This image shows Day Cloud Phase Distinction, LightningCast, and 5 Minute CG Flash Lightning Plots for NLDN and ENTLN across Eastern MT. While LightningCast provides a lot of information, it's easy for it to overwhelm forecasters in situations like what's shown, especially if other colorful imagery is included. A suggestion is to give forecasters the option to load LightningCast in 10% increments from 10-90% (10, 20, 30, etc). Then, forecasters can turn the individual increments on or off depending on the situation (i.e. lots of severe weather can prompt the lower values to be turned off, or partners concerned with the initial start of lightning can prompt lower values to be turned on). Having the ability to change the color, line style, and line width for each increment would also be nice.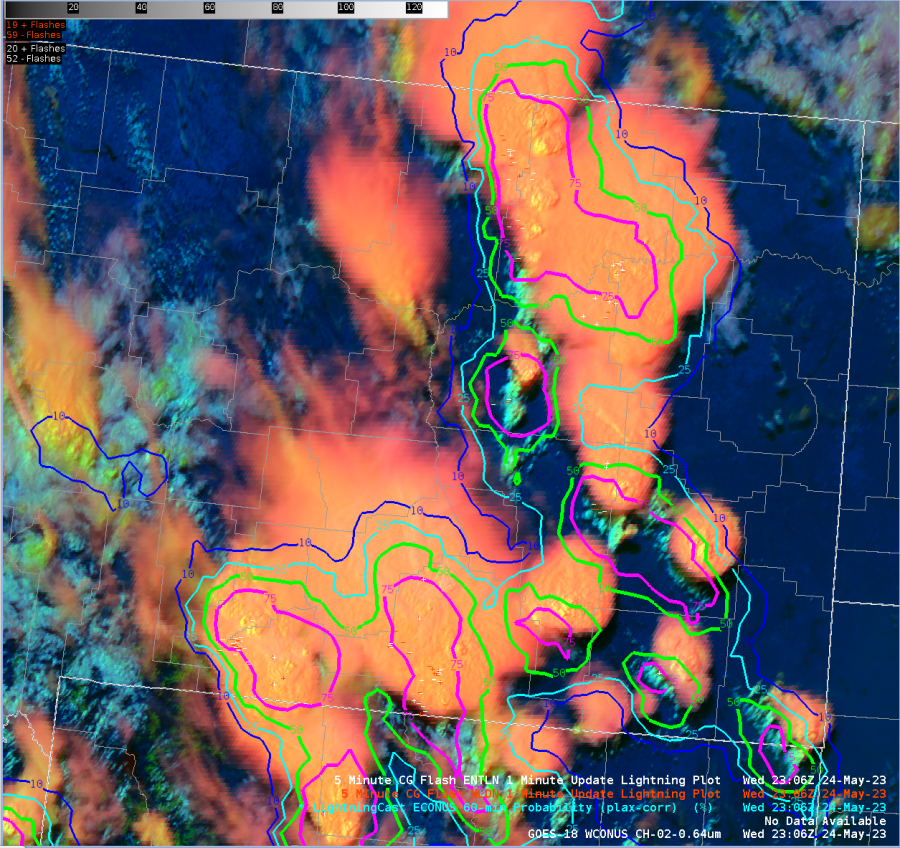
-Champion
Subscribe to:
Posts (Atom)