Tuesday, May 23, 2023

Analyzing Mid Level Lapse Rates Between NUCAPS and Model Guidance

Mid-level lapse rates are important in judging instability when combined with boundary layer moisture content in the lower levels. With boundary layer moisture being poor for much of the MAF CWA today, the low to mid level temperature profile may be even more important, as it will define both convective inhibition and CAPE potential with a greater potential for inhibition with such a dry moisture profile. The convective forecast in MAF for the day featured generally weak forcing mechanisms, focused on orographic lift and a moisture gradient on the eastern side of the CWA. With any sort of convective inhibition, it would be difficult to forecast convective initiation away from the strongest forcing points until later in the day when convection is forecast to move in from outside the CWA.

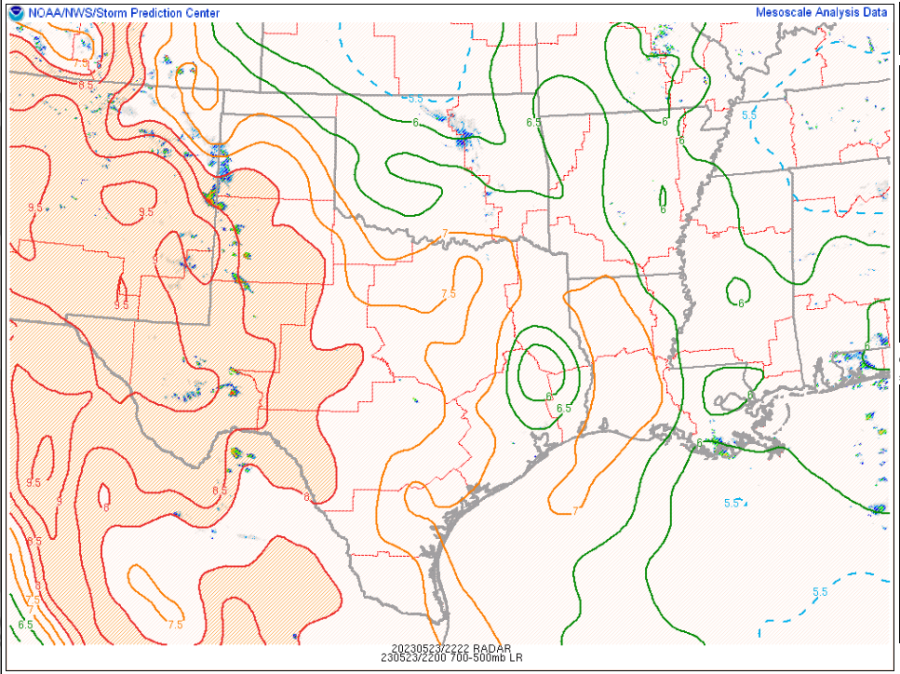
Shown below is the SPC mesoanalysis page depicting this afternoon’s 700-500mb lapse rates. The RAP guidance driving this page is showing very steep mid-level lapse rates of 8 to near 9.5 degrees/km over the MAF CWA. While steep mid-level lapse rates (indicative of cooler temperatures atop a warmer lower level air mass) are important for instability, very steep mid-level lapse rates could be due to a very warm low level air mass potentially creating a convective “cap” which may inhibit convection. With the very low surface dew points (into the 30s in some spots), a mid-level lapse rate exceeding 8.5 should mean convection struggles to initiate outside of areas of strong forcing.
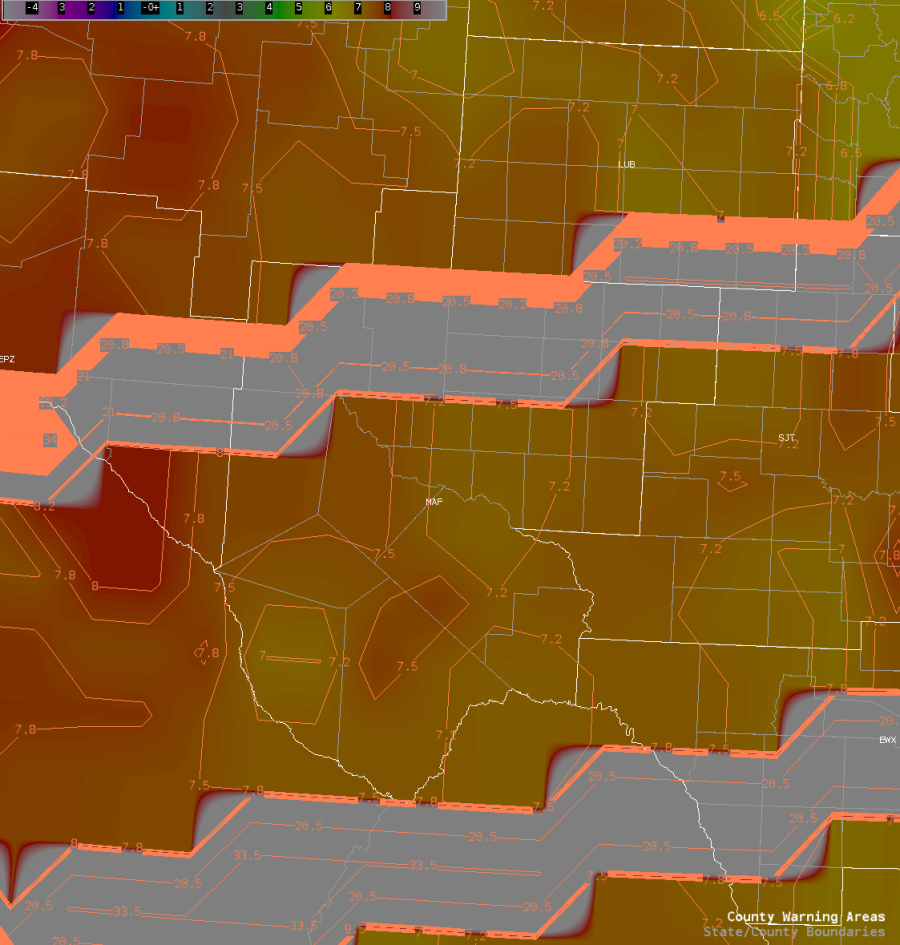
Looking at the afternoon NUCAPS satellite pass, it shows a fairly different picture for mid-level lapse rates over the MAF CWA. The observed lapse rates of 7 to near 8 degrees here are more normal for a convectively active environment compared to the 8.5 to near 9.5 degrees given by the RAP guidance.  It’s worth looking into how NUCAPS and guidance is handling temperatures at different levels to understand the differences between the lapse rates.
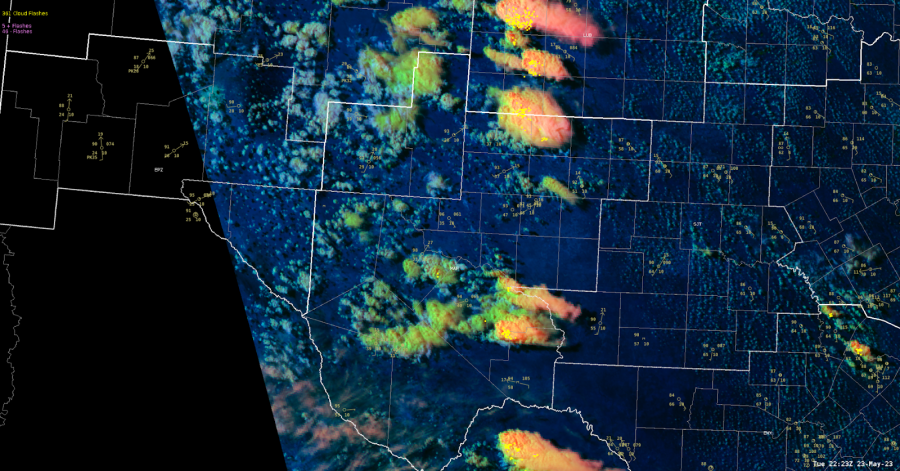
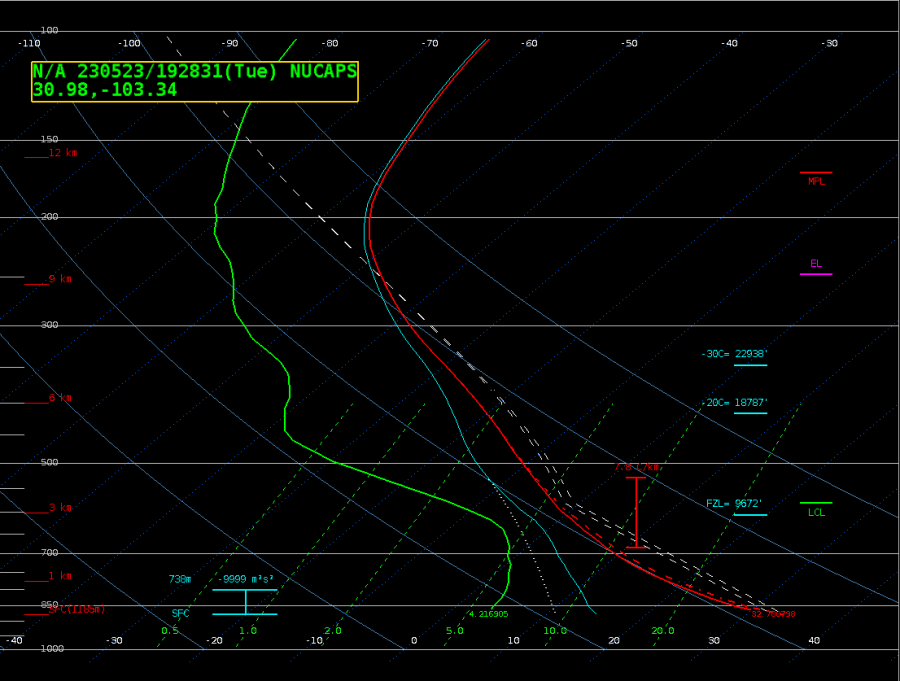
Shown below are both the NUCAPS sounding (first) and then the RAP sounding for a similar spot near the center of the MAF CWA. It’s interesting to note that it isn’t actually the 700mb temperature that is the main difference between the two soundings, but the 500mb temperature, with a 2-3 degree difference at 500mb. This could explain why there is still convection away from the previously discussed initiation points (such as out in the Fort Stockton area), however the warmer than forecast 500mb temperatures could be indicative of an environment that isn’t quite as unstable as forecast, and why the central MAF convection is notably weaker than convection well to the north in the Lubbock CWA. There are other contributing factors of course (weak surface convergence, very dry low to mid levels), but this is a major factor in judging updraft strength potential, and today lines up with where updrafts have develop but struggled to truly develop into strong or severe thunderstorms. The late afternoon Day Cloud Phase Satellite product shown below includes the non-severe convection in the south-central portions of the MAF CWA with the severe convection to the north (and their noticeably better defined anvil clouds).

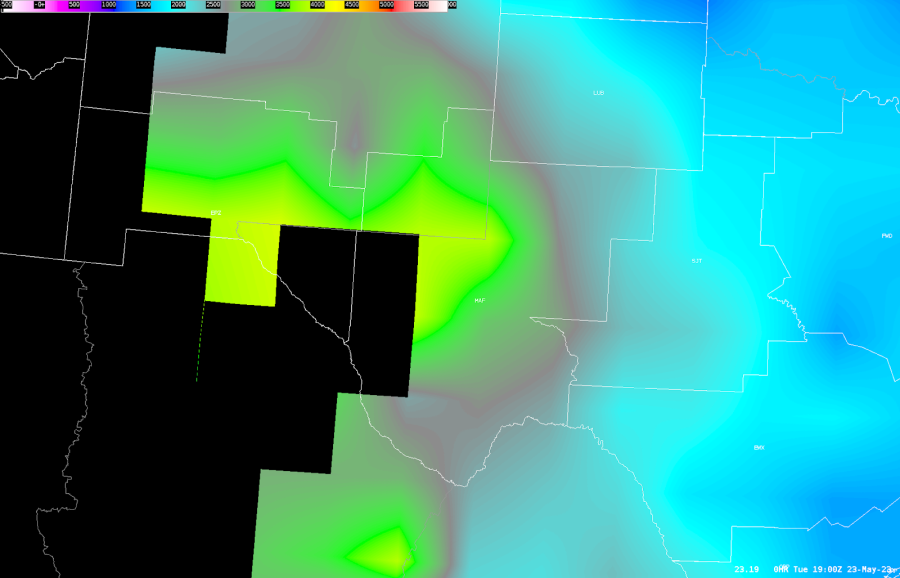
One quick screenshot to show is the NUCAPS LCL product, highlighting the better moisture on the eastern and northeastern edge of the CWA, lining up with the higher SPC risk.
-Joaq

Taking a look at LightningCast in West-Central Florida.

 Thunderstorms have been gradually increasing this afternoon along the west coast of Florida, and wanted to take a look at the evolution of the LightningCast product vs when flashes were first reported. Want to note upfront, there was an issue with GLM data, so used the 5-min (1-min update) CG/Cloud/Pulse ENTLN1 lightning plots to see when activity developed.

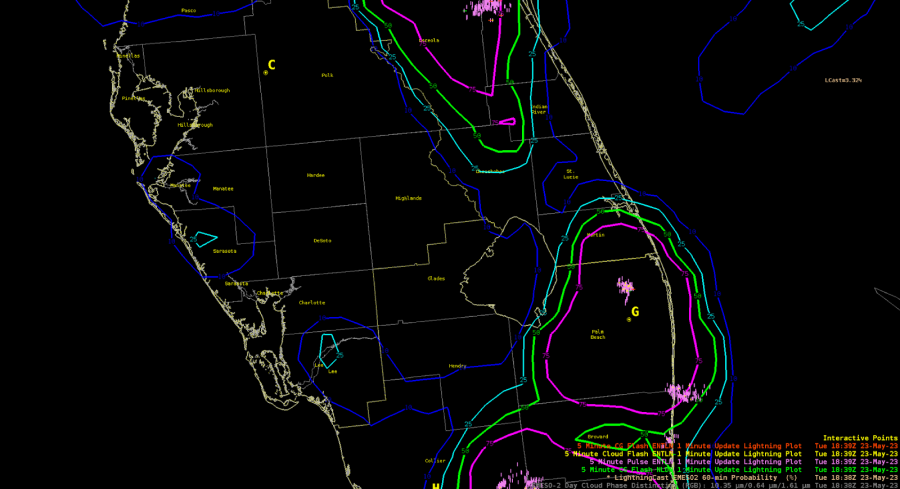
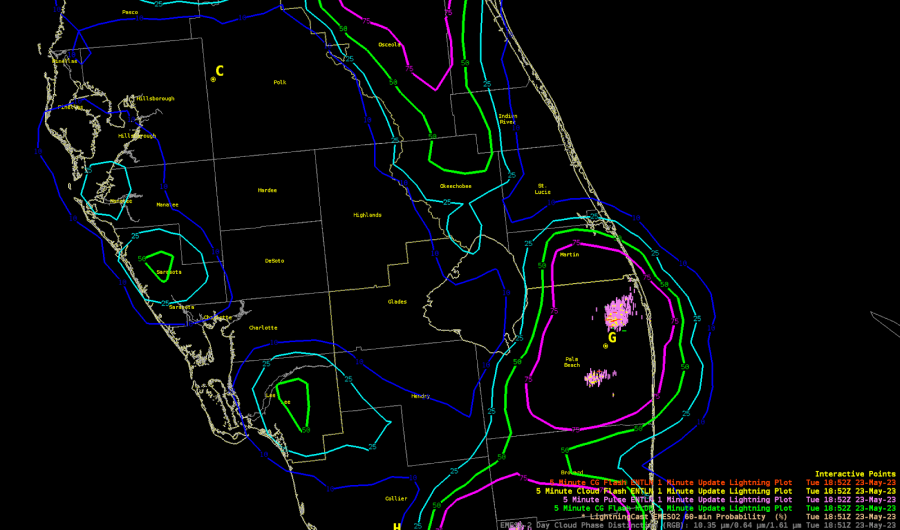
Below are images showing when the 25, 50, and 75% probability contours of lightning occurring in the next 60 minutes appeared, focused on Sarasota and Lee counties. For both counties, the 25% probability contour first appeared at 1838Z, 50% contour at 1851Z and the 75% contour at 1854Z. The first lightning strikes appeared in Lee County at 1858Z (a 20-min lead time from the 25% contour). The first strikes appeared in Sarasota County at 1906Z (a 28-min lead time from the 25% contour).

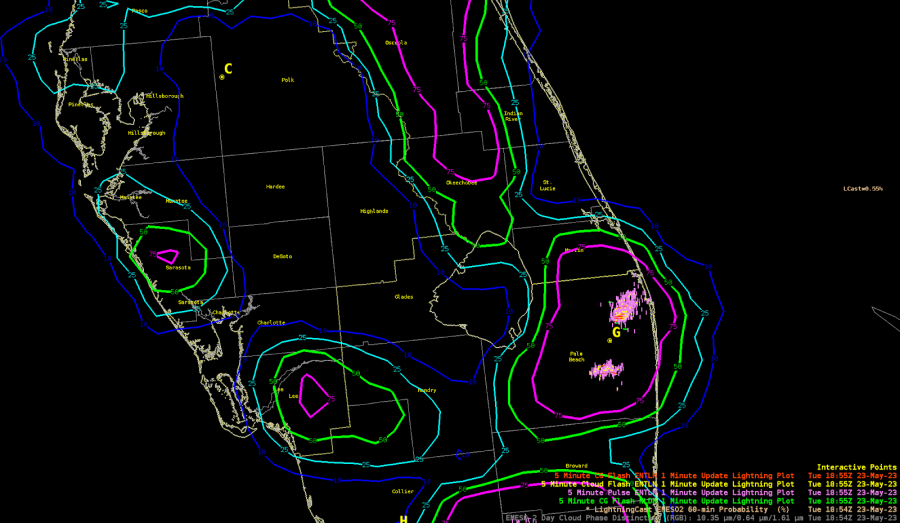
The image below shows the 25% probability contours showing up in the Sarasota and Lee Counties at 1838Z.

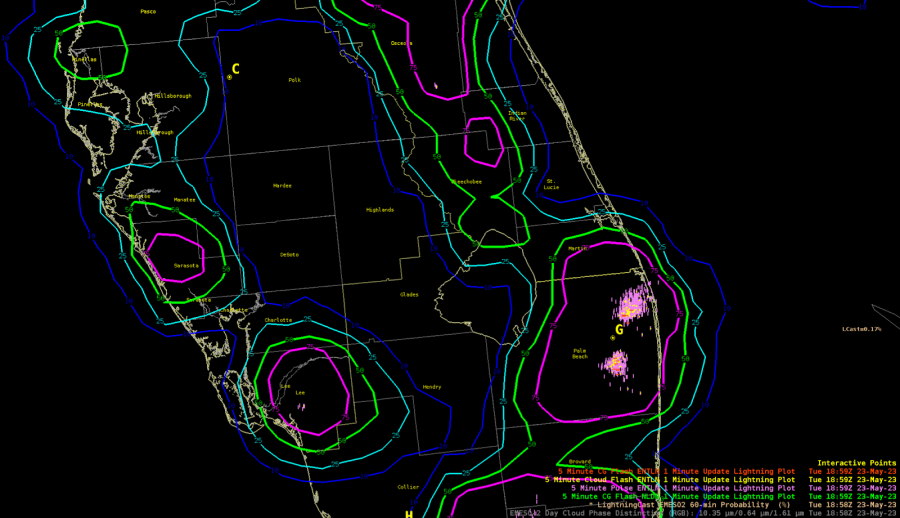
The image below shows the 50% probability contours showing up in the Sarasota and Lee Counties at 1851Z.

The image below shows the 75% probability contours showing up in the Sarasota and Lee Counties at 1854Z.

The image below shows the first lightning strikes showing up in Lee County at 1858Z.

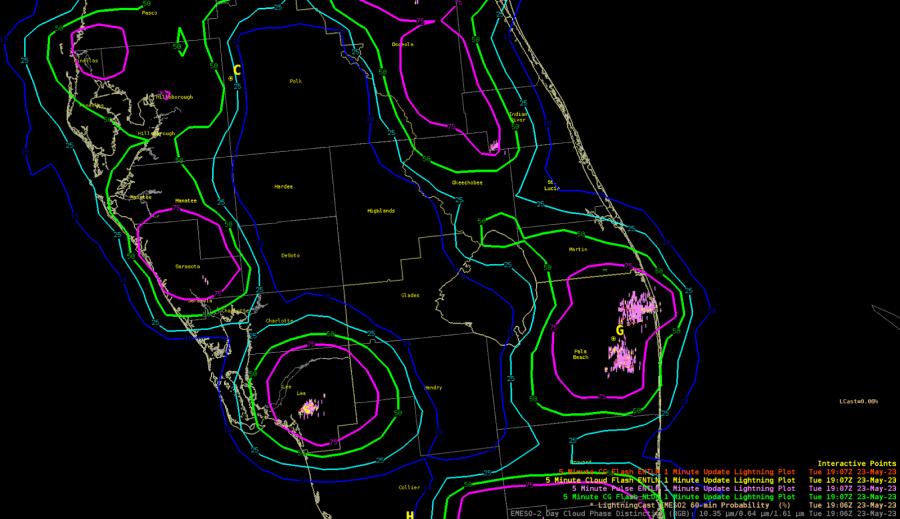
The image below shows the first lightning strikes then showing up in Sarasota County at 1906Z.

- Bubbles

Brief Thought About Octane Speed-Direction

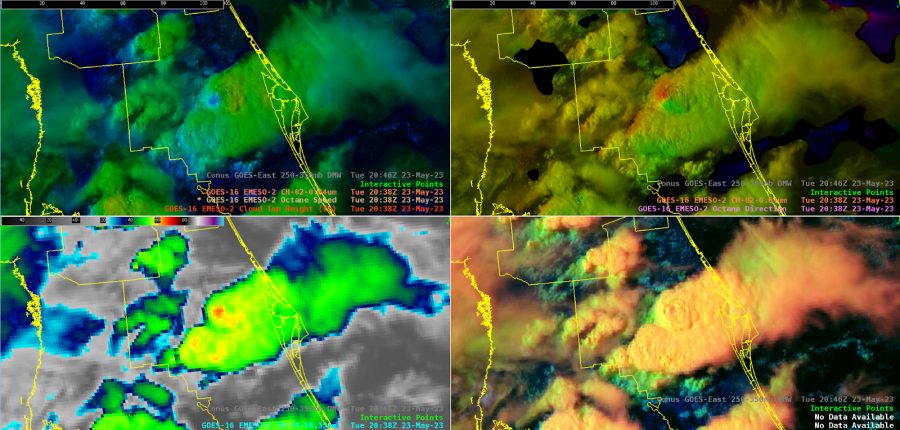
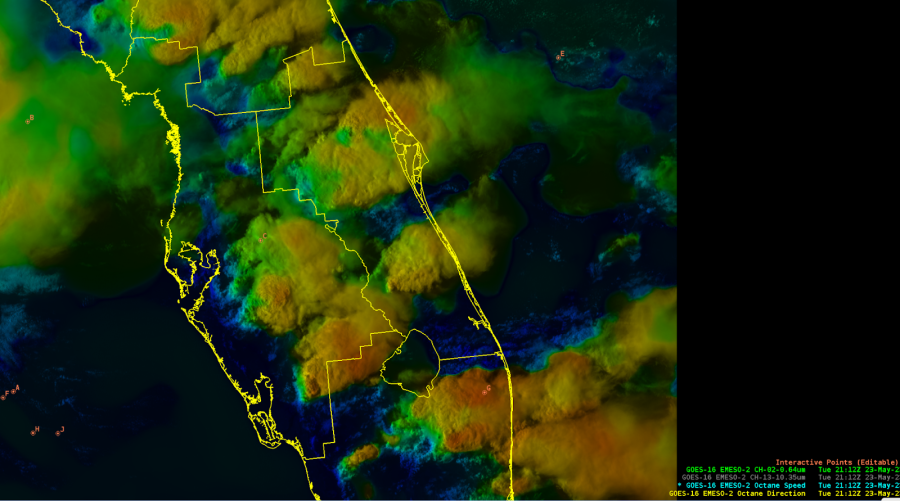
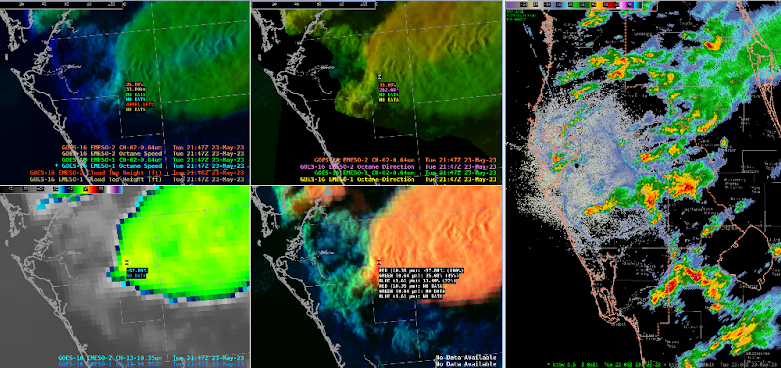
 Below is an image showing the default 4-panel procedure provided. The upper level is the Octane Speed product on top of the Red Visible Band (Channel 2), the upper right is the Octane Direction product on top of the Red Visible Band (Channel 2), the lower left is the Clean IR Band (Ch. 13), the lower right is the Day Cloud Phase Distinction RGB.

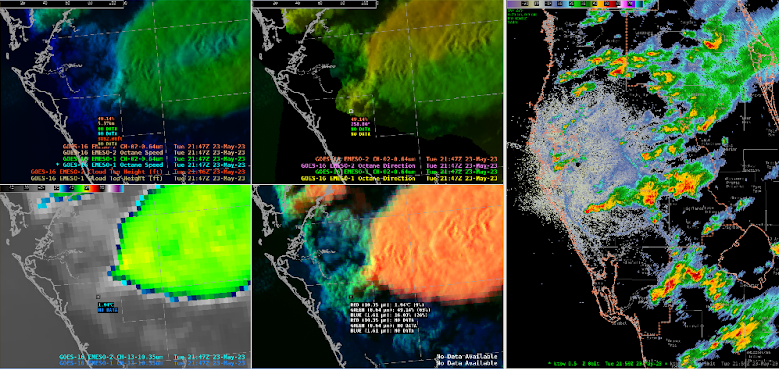
Personally, have at times struggled with what exactly the speed and direction products are showing…but especially the direction. Decided to plot the GOES East Derived Winds onto the imagery, as I am used to looking at wind direction with vectors/arrows/etc. Below is the same Octane image with the 250-350mb wind barbs. When comparing the sampling/data readout of the Octane direction and the derived winds, they were within a few degrees.

Perhaps an option going forward would be to have a single panel Octane procedure with the speed shown as the color, continue to have the direction in the background that shows up when sampling the data (image below), but then at least have the option to load the the direction data as an arrow/barb/etc. Having the barbs show up as the default in a dense enough of a manner that it’s useful may use up too much AWIPS power and drag it down.

- Bubbles

Challenge With A DSS Event With Scattered Thunderstorm Development…focus on LightningCast.

 Sea Breeze and outflow boundaries in place over the Florida Peninsula made for a tricky forecast during the afternoon hours, as thunderstorms could and would quickly develop just about anywhere along that boundary. Lightning up to this point by far was the main threat from these storms…as most storms were not strong long enough to cause notable hail to be a concern, but with storms having the potential to “die off” quickly as well, wind was more of a concern.

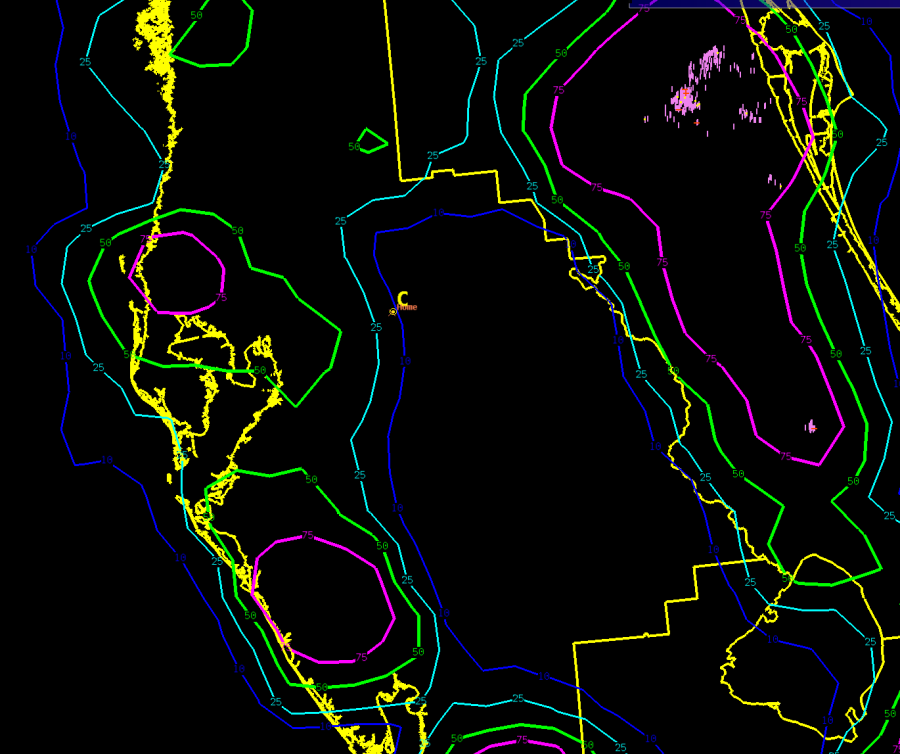
With the initial onset of early afternoon activity, providing DSS support and giving the local contact more detailed information was on the ‘easier’ side. LightningCast around 19Z was showing increasing probability contours of lightning within 60 mins at the DSS site (image below was at 1901Z. The DSS event is noted by the yellow “C”.

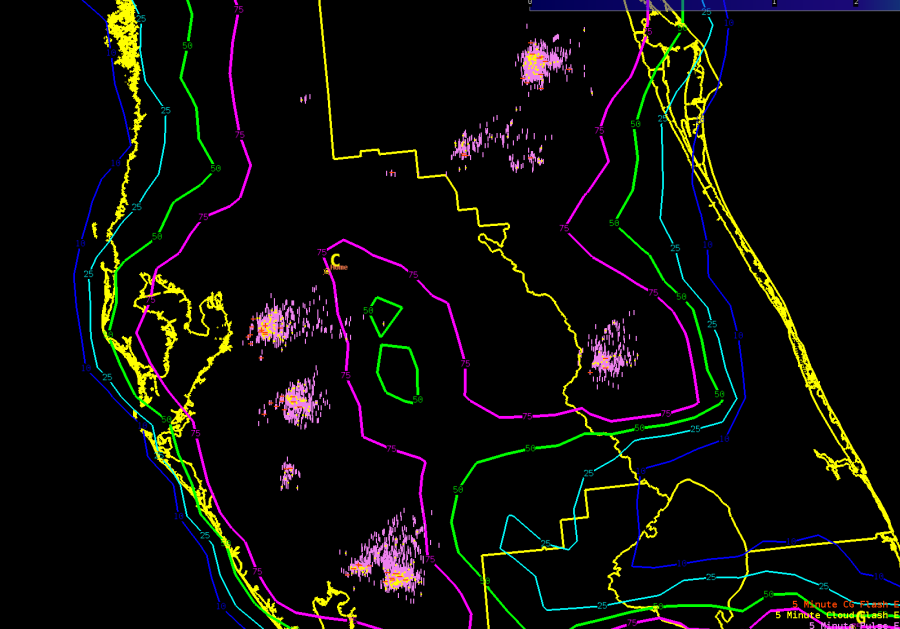
By around 2035Z, activity had increased in coverage and drifted northeast, closer to the DSS event, shown below by the increased coverage of ENTLN lightning plots and the 75% probability contour in the area.

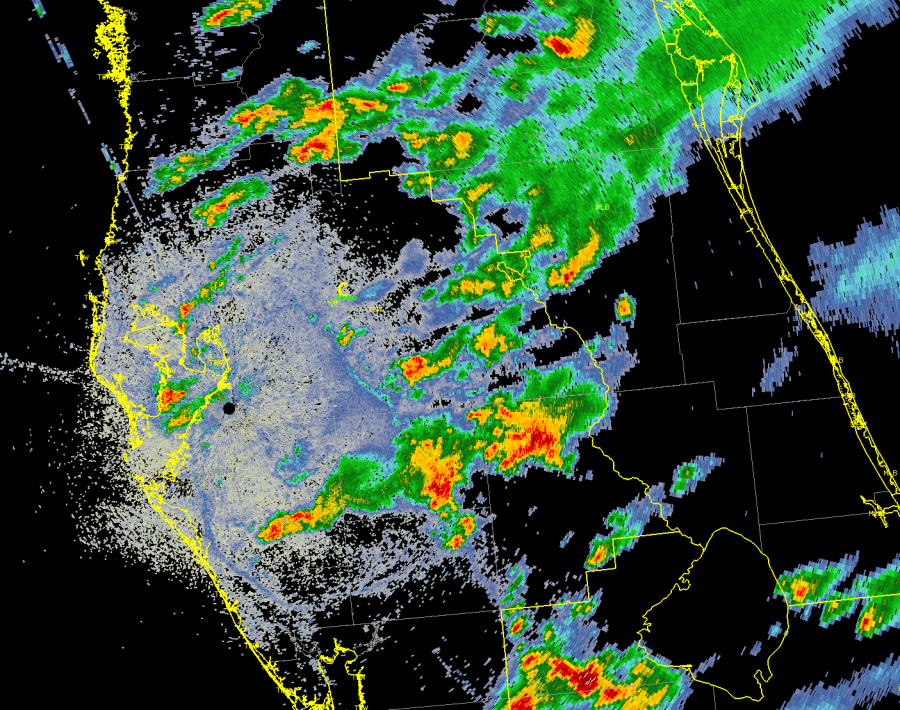
The challenge since then is that more scattered/widespread activity has developed (and died off), in what seems at times to be in fairly random areas…but are for the most part tied to the moving outflow boundaries from previous storms (seen in radar image below at 2203Z).

Not surprisingly, as a result of all of this activity, LightningCast over this entire area has been remaining mostly around-above 50%, with many spots at/above 75%.

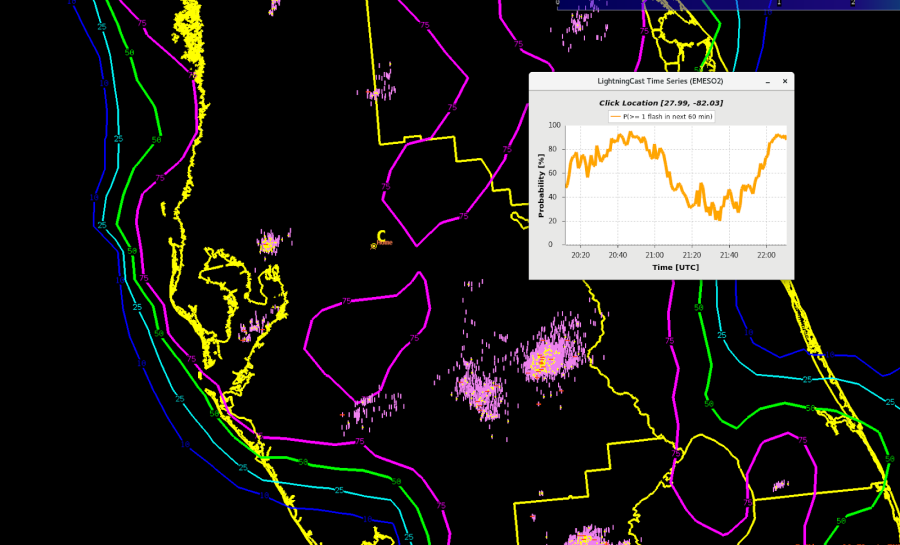
The challenge is what is the best way to convey this information to the DSS point of contact? Below is an image showing the LightningCast probability contours at 2212Z, along with the LightningCast Time Series for the DSS site (noted with the yellow “C”).

There is an overall lull roughly between 2110Z-2150Z (probability is closer to/lower to 50%)...but it never drops below 20%.  

Personally, looking at this time series and given the environment/set up and evolution of storms so far, I would have a difficult time calling the DSS point of contact and saying the threat of lightning is low…as another storm could develop as soon as I hang up. You don’t want to totally shut an event down, or be constantly calling the point of contact with updates (unless you know the contact likes that much communication). I don’t claim to have the answers, just thinking out loud, but it’s something to think about if using this product to communicate with DDS contacts.

-Bubbles

HWT Day 2 Tuesday Thoughts


OCTANE

Interesting case to the north of the CWA today showing different layers that were flowing near surface and aloft. Was able to use the estimated motions to get a quick idea of how quickly the airmass over the Atlantic was moving to the SE. Could use this to get a quick estimate for when this airmass may clash with the seabreeze front which could lead to additional convection that fires near my CWA (TBW).

ProbSevere v3

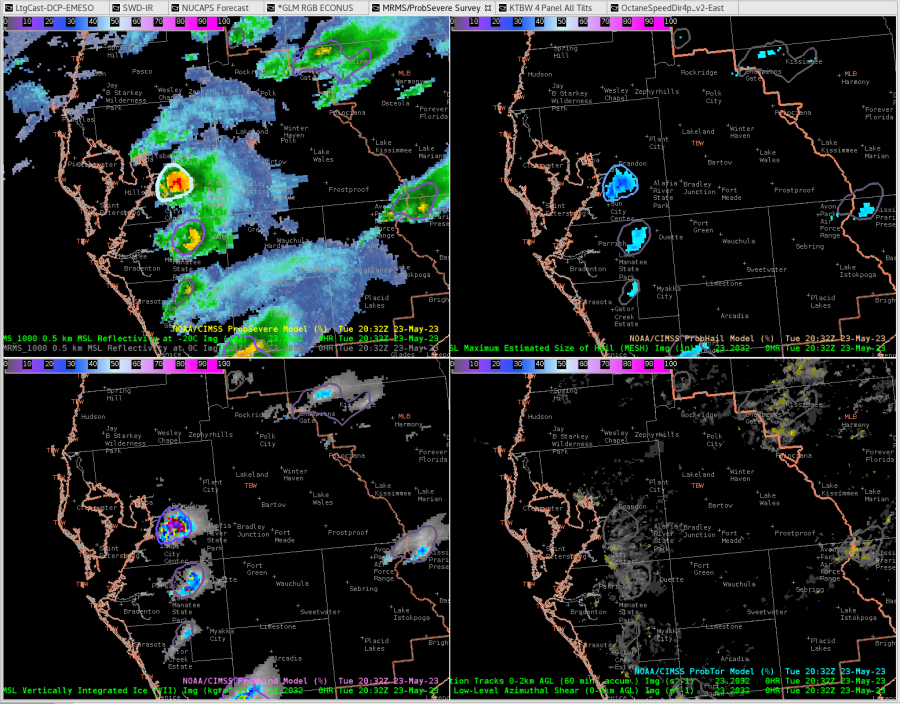
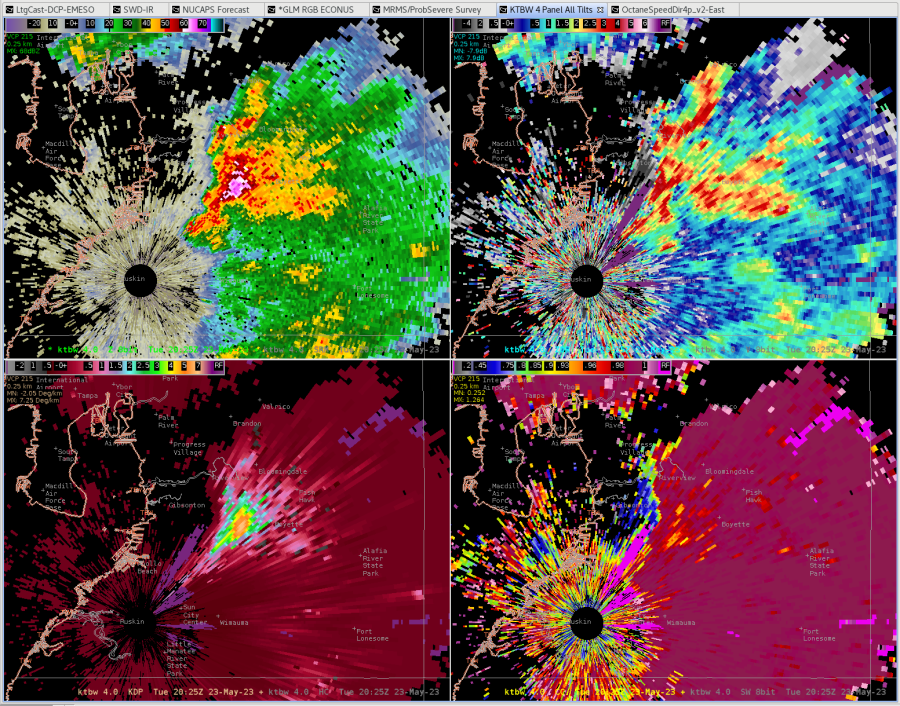
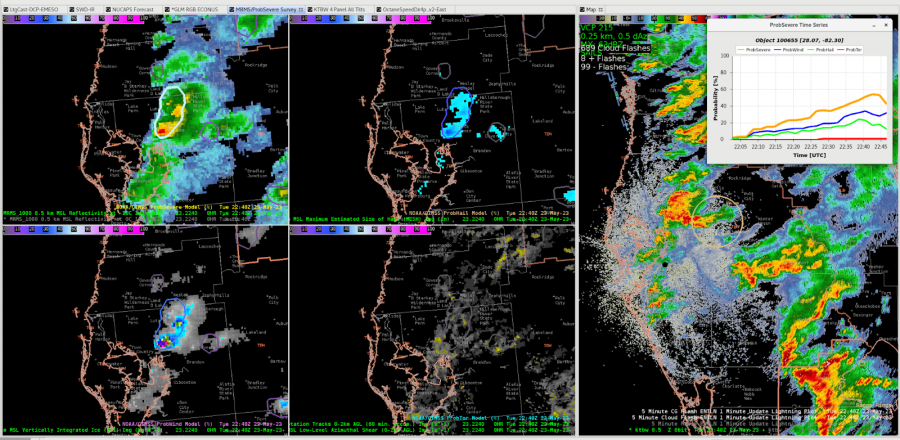
Great example of a marginal case where I considered issuing a severe thunderstorm warning. Core had pulsed significantly, showing 50-60 dBZ at the -20C isothermal layer. MESH was showing upwards of 1” of hail, but my experience in the south tells me that MESH will overestimate hail size. VII had a decent burst at one point, but biggest question mark to everything was how long core could hold together to keep hail aloft, especially given lack of shear (generally <30 kts EBS, little to no storm relative helicity or chance for any updraft organization or rotation). My bigger concern for warning was derived from the potential wind threat of the core falling out quickly, with DCAPE values analyzed between 5-700 J/kg.

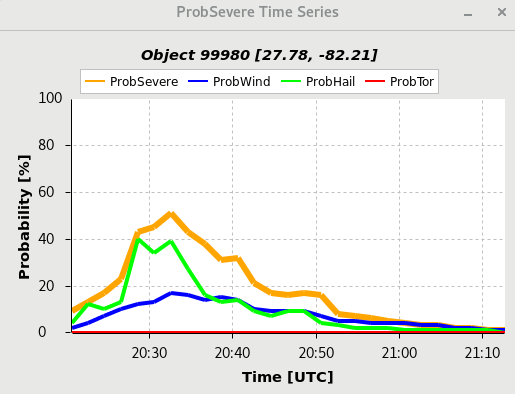
Probseverev3 topped out around 51%, which matches pretty well with my overall feeling of the situation, where I was already on the fence. Hail was the primary driver however, where I would have been a little bit more concerned with winds. That said, being right by the radar gave a good sample of winds as the storm fell, and they topped out at a whopping 32 kts. Hail was eventually reported at 0.5” near Riverview.

Otherwise, was using ProbSevere in combination with the OCTANE speed products for triage of storms, using the divergent signatures in OCTANE to pick out storms to quickly monitor and ProbSevere for continued development.

GLM Outage and ProbSevere

Due to a software error during an update, the GLM data dropped out for a few hours, which is an input into the ProbSevere model. It was good to see that ProbSevere seemed to remain well calibrated despite losing the data. I observed no large spikes or increase in the overall probabilities when the data was added back in - just a few small increases in some places. Data outages are not uncommon, so I think it is good that the model continues to perform well in the absence of a product.

Octane View of an Updraft

The sequence of pictures above show the speed and height of clouds within the updraft core of a thunderstorm that was moving slowly along the sea breeze front at the surface but was encountering faster winds aloft, giving a bit of a picture of the hodograph.

ProbSevere High Overall Prob with lower hail/wind

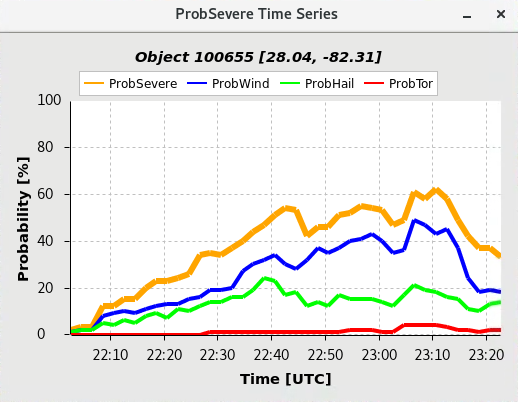
Interesting case where this storm ended up having one of the highest ProbSevere thresholds on the day I saw (54%) despite having both wind and hail thresholds that remained well below 40%. It makes sense that these probabilities would “combine” in a sense in the overall probability, but this definitely was not the “storm of day” or anything, with a less powerful overall updraft and core when compared to several others.

This continued to have relatively higher probabilities as shown below, especially in the wind, despite once again looking less impressive than others. While these cores did produce some 30-35 kt winds per radar, they never really approached severe limits (IRIS obs showed peak winds of 30-33 mph at various stations around the area). Wondering if the unique set-up, which led to some pretty high EBShear values that may not be truly realized by the updrafts, was leading to some higher values in the model.

The overall theme of today is that convection in the south is hard.

- Carl Coriolis      

Utilizing Octane in Pre-Lightning Convective Initiation

 Growing TCU was noted in the Octane Speed product around 2030Z (1530 CDT). While no lightning was detected by ENI, the Octane product indicated a growing trend in CI.

Octane Speed (Top Left), indicates a growing trend in cloud speed at the cloud top, indicating these cu are growing into a more strongly sheared environment.

- Rain-Free Bass Guitar