Monday, May 22, 2023

ProbSevere_V3 Captures Hail

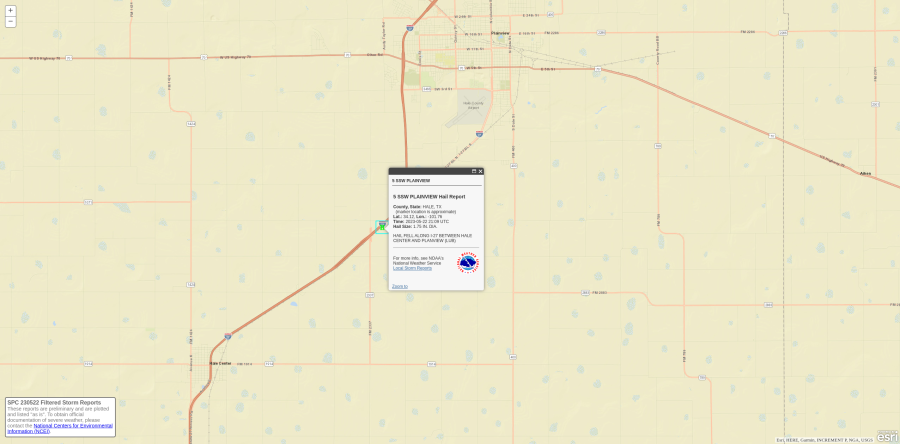
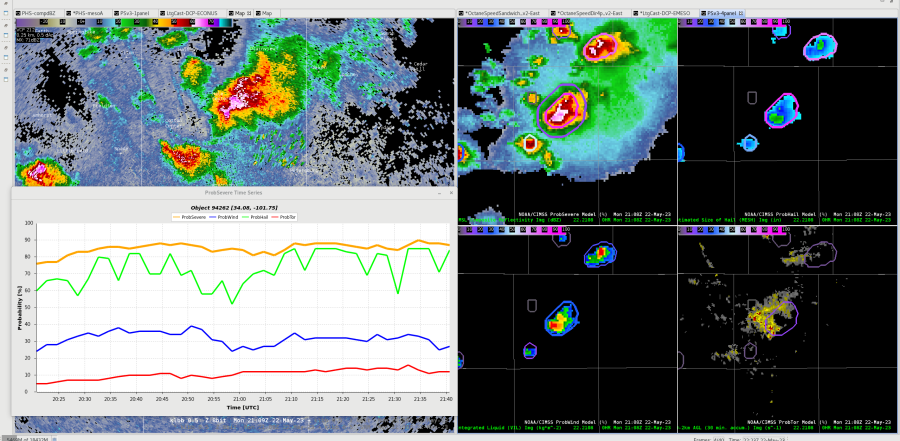
 Severe storms developed over Hale County, TX on the afternoon of 5/22.  KLBB 0.5 Z reflectivity at 2109Z (top left image) indicated intense convection, especially just southeast of Hale Center.  ProbSevere V3 (the 4-Panel) did well at 2108Z.  The upper left has the ProbSevere Model at 84% with the MRMS 0.5 Comp Reflectivity peak value of 66 dBZ.  The upper right has ProbHail at 85% and MRMS Maximum Estimated Hail Size (MESH) peaking at 1.85".  The lower right has ProbTor at 12% and MRMS Low-Level Rotation Tracks.  The lower left has ProbWind at 35% and MRMS Vertically Integrated Liquid (VIL) at 55.  Notice how the ProbSevere Time Series ProbHail was at 60% at 2020Z, nearly an hour before this.  What happened?  Here is the LSR...

SSW PLAINVIEW Hail Report
County, State: HALE, TX
(marker location is approximate)
Lat.: 34.12, Lon.: -101.76
Time: 2023-05-22 21:09 UTC
Hail Size: 1.75 IN. DIA.

HAIL FELL ALONG I-27 BETWEEN HALE CENTER AND PLANVIEW (LUB)

Since forecasters should consider warning with lower ProbSevere values for V3 compared to V2, these high values supported a warning.

-Champion


Satellite HWT Day 1 Analysis Carl

PHS Model Analysis

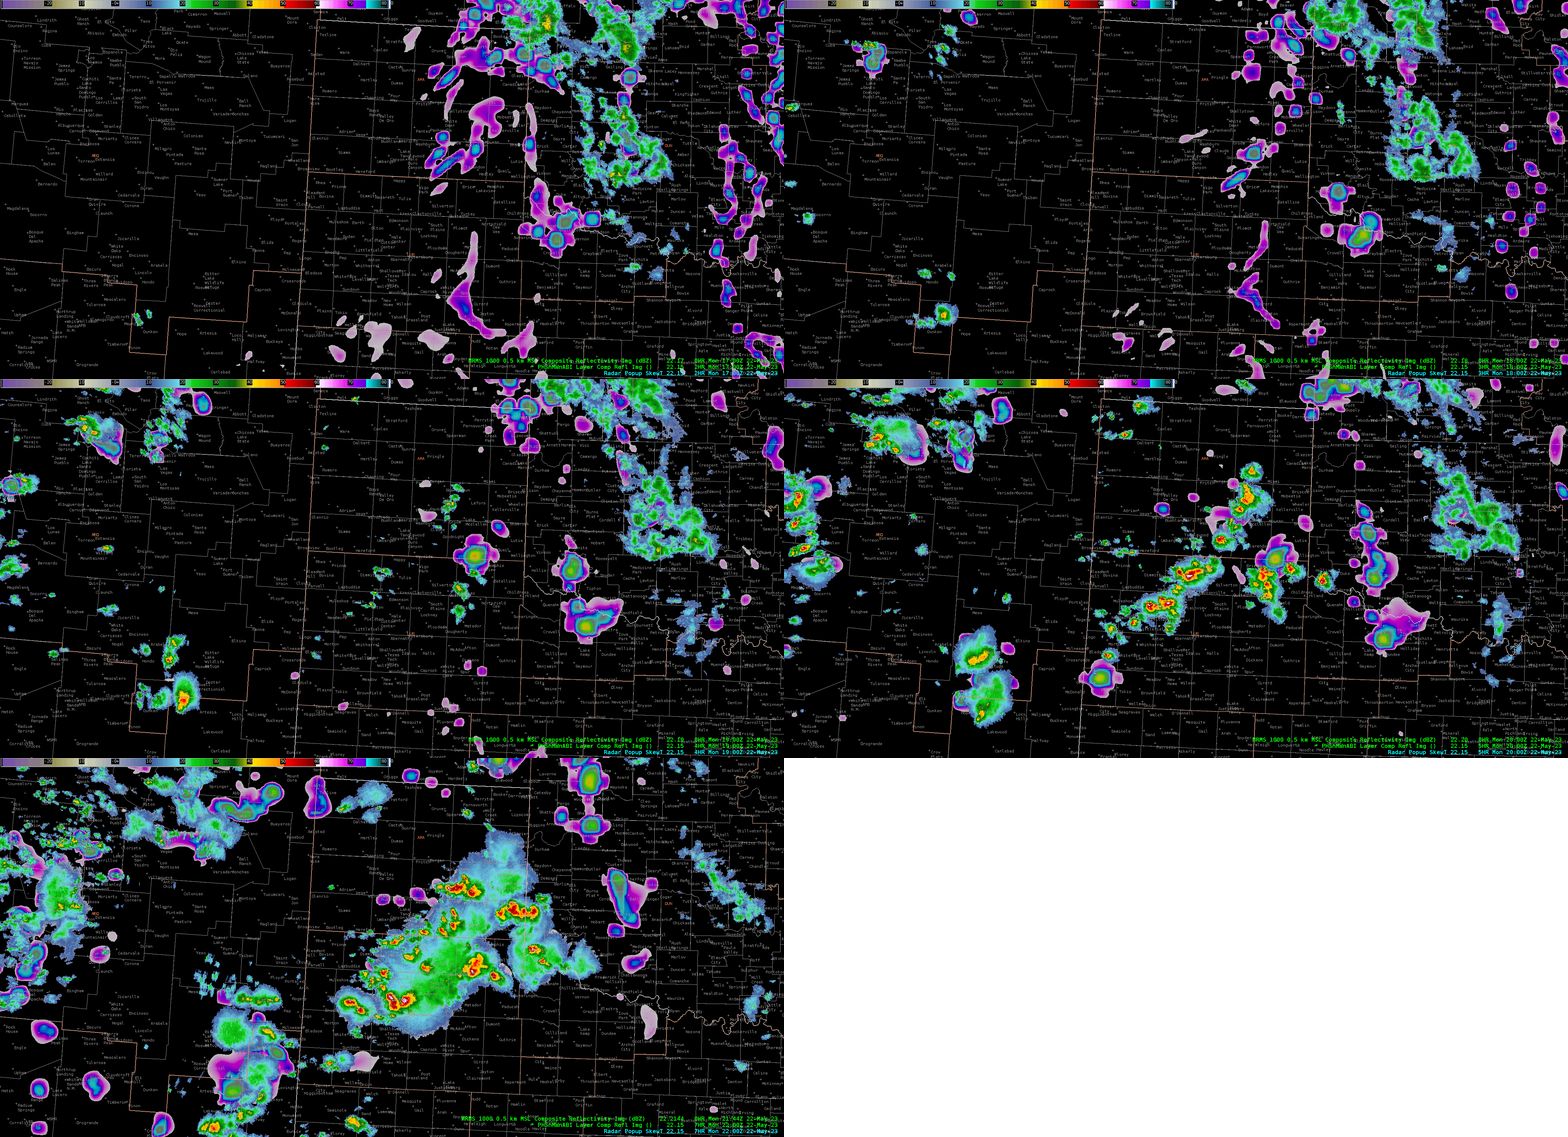
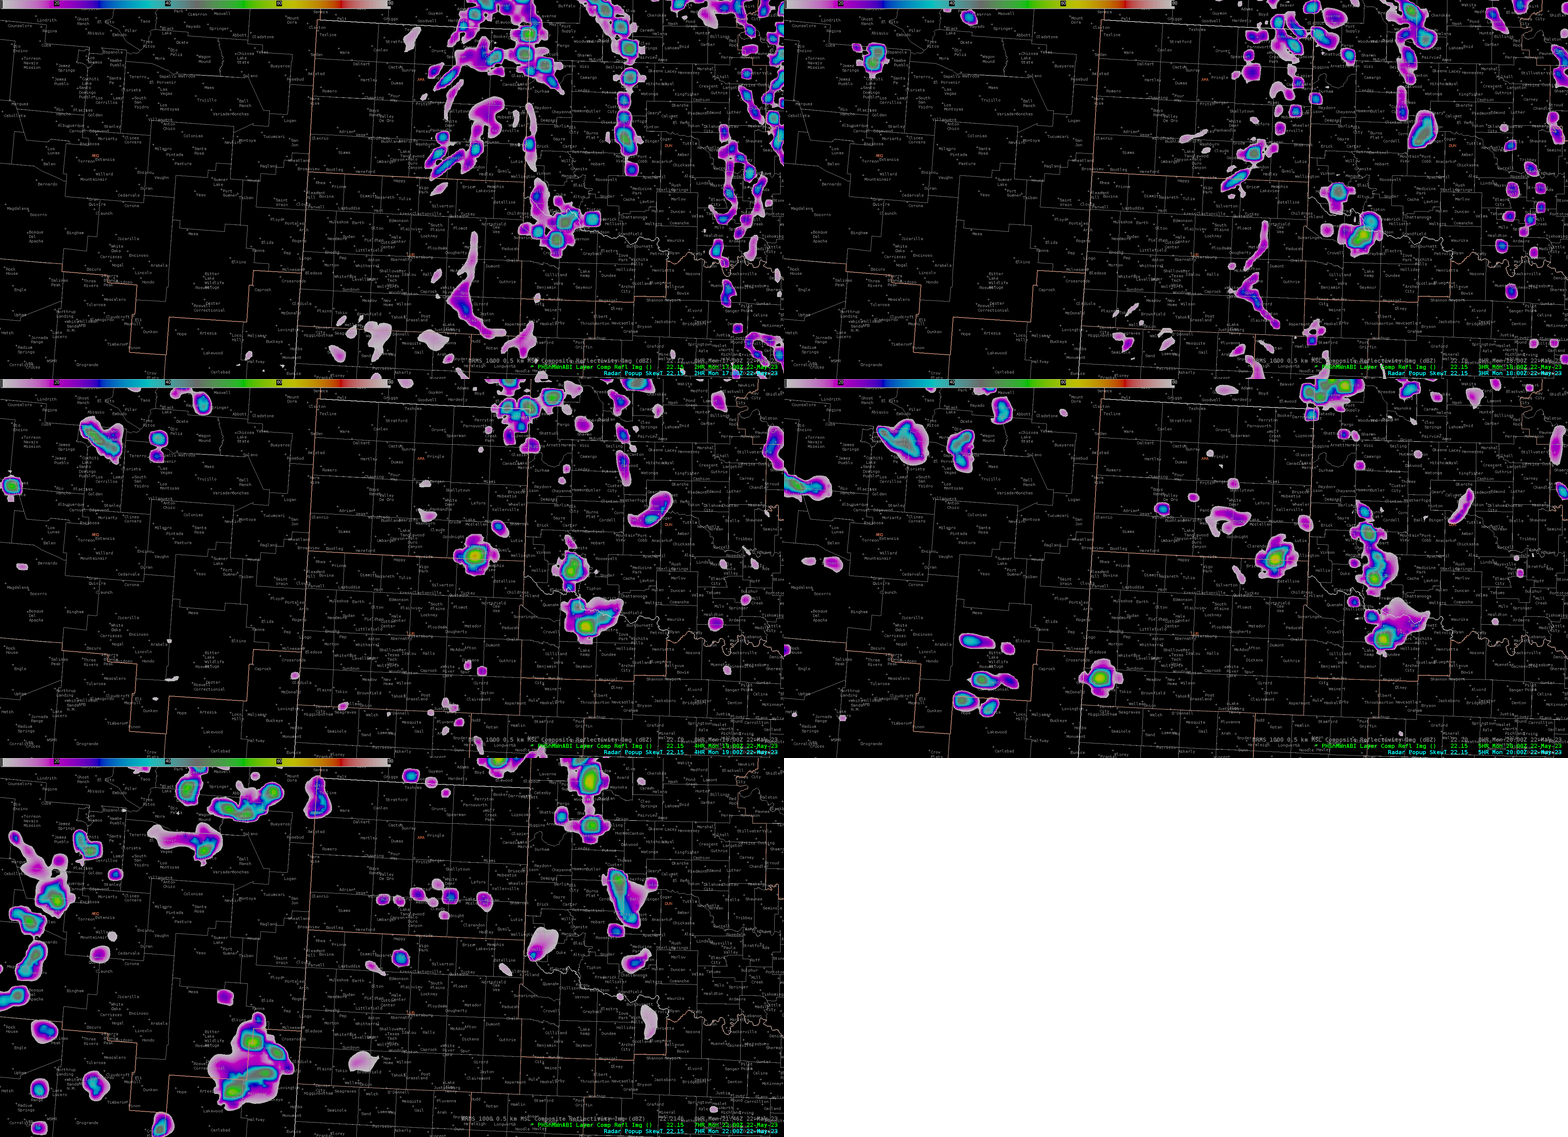
PHS model struggled to properly capture convective initiation within the Texas Panhandle on the day. While it did see a few cells possibly starting, overall coverage was significantly underdone with many of these storms reaching severe thresholds including numerous reports of hail over 1". The overall output shared many of the same struggles as the HRRR model on the day. Unclear what the exact problem was, but dry line convergence may have been better than in models on this day.

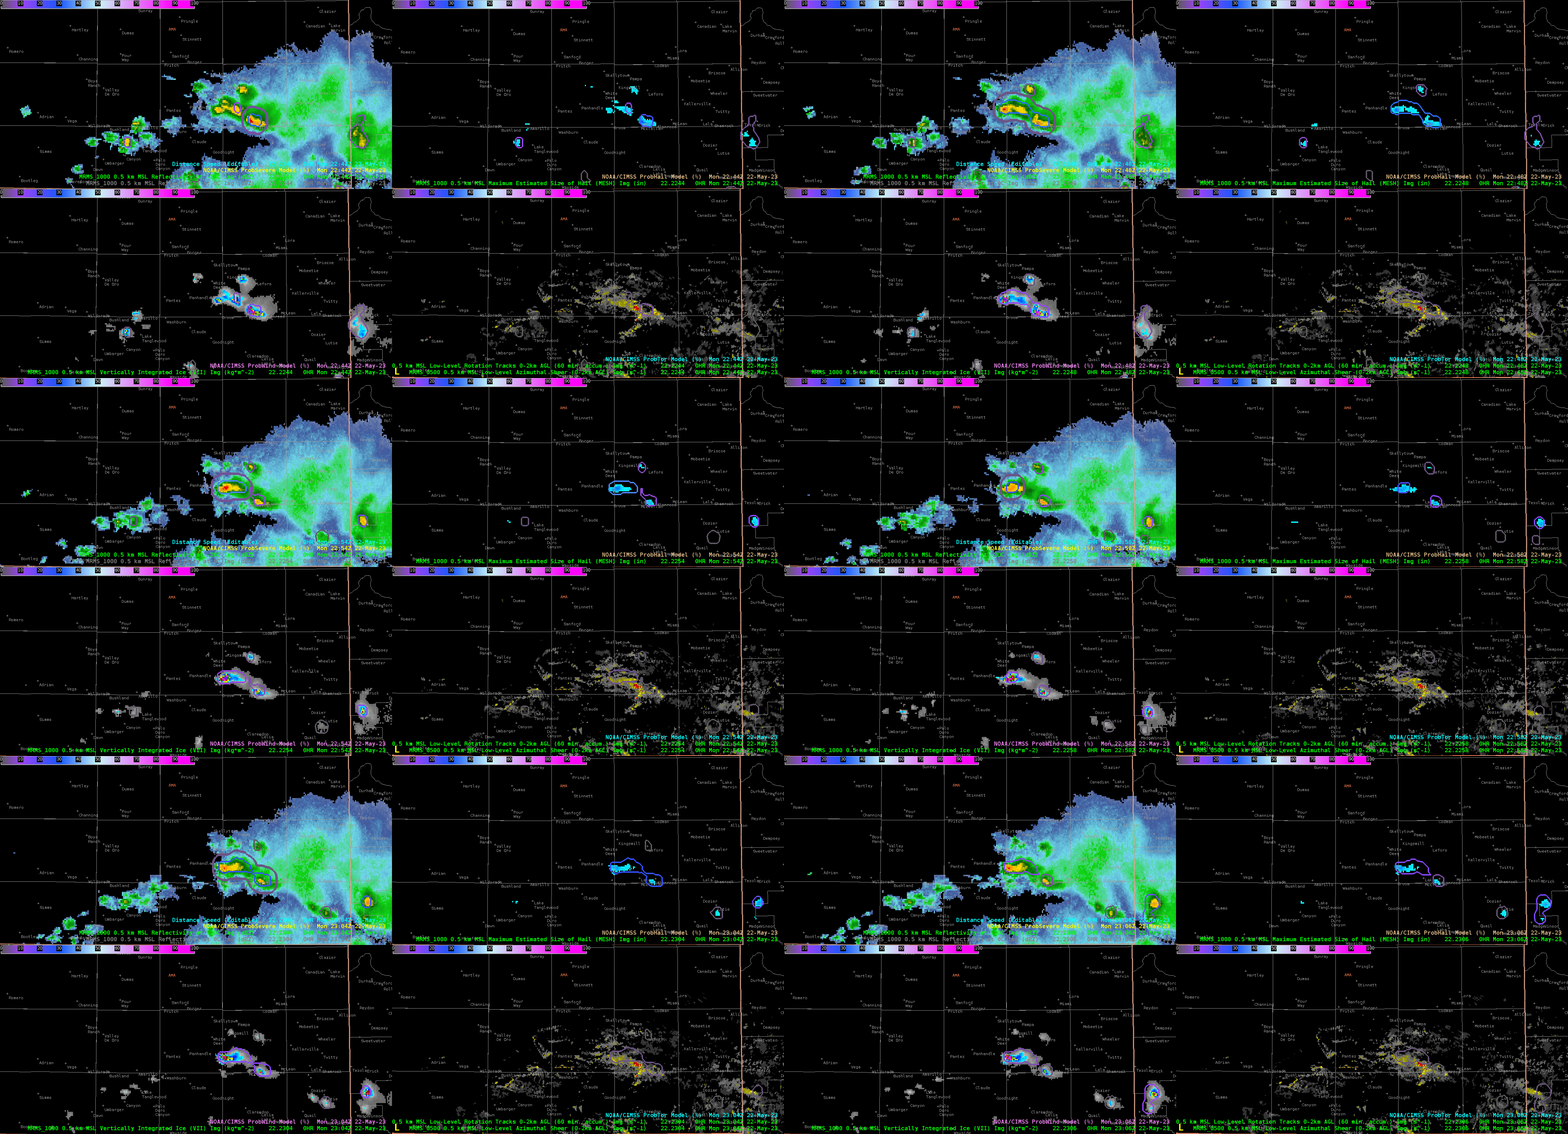
Above: 15Z PHS model output forecast for 17Z to 22Z from 5/22 with MRMS Reflectivity overlaid.

Below: 15Z PHS model output for 17Z to 22Z from 5/22.

NUCAPS Forecast

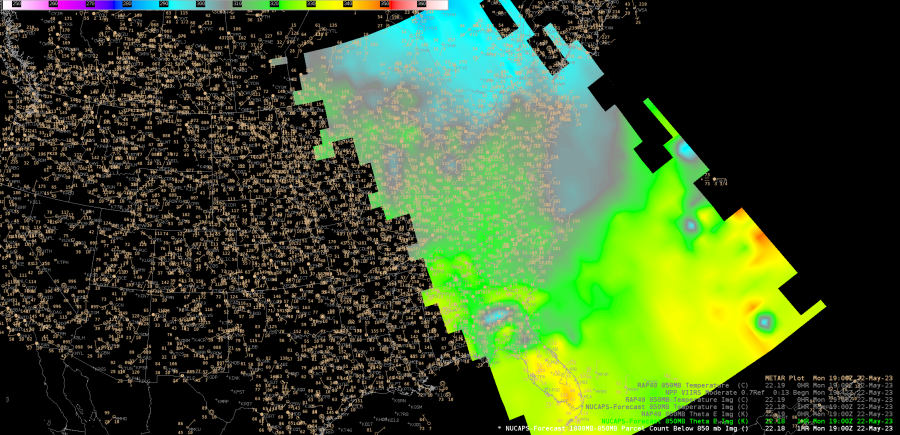
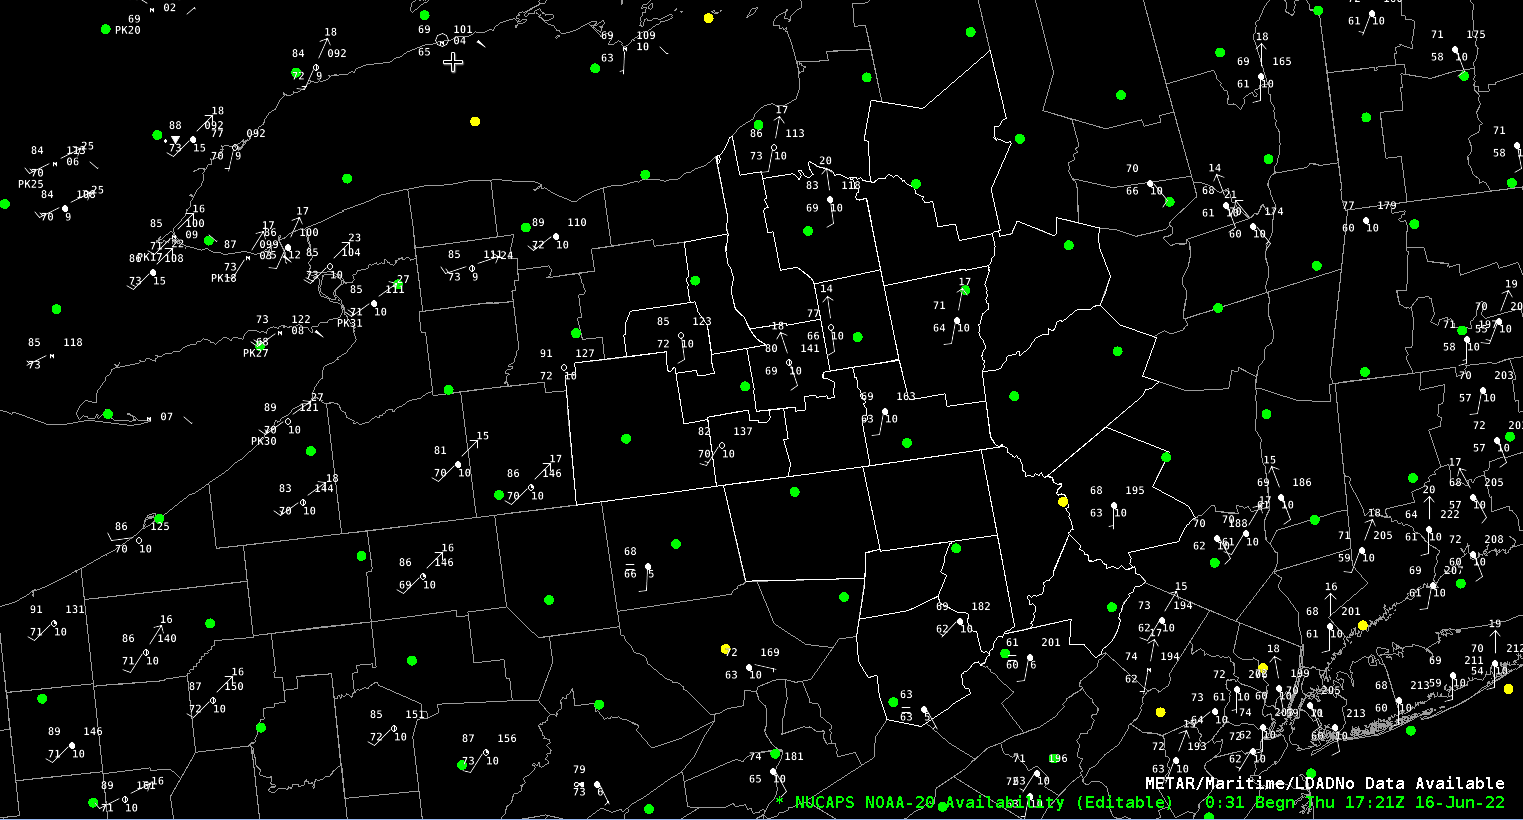
As I was beginning to test out these products, this caught my eye as a forecaster on the east coast that regularly deals with Cold Air Damming along the Appalachians. Models regularly struggle with multiple aspects of the dam, including extent, depth, and actual temperature and strength. Additionally, one of the most common pathways for large winter storms in the southeast is when low pressure passes across the Gulf Coast and into the Atlantic while an Arctic high in the northeast helps drive cold air damming into the area. Models again struggle with the dam, but also with strength of the warm nose aloft. I would love to see how this system performs in these scenarios - I know it isn't "convective", but it still is an incredibly impactful event, where the strength of the warm nose can be the difference between a few inches of snow or half an inch or more of ice. We regularly attempt to send up special soundings to get the best sample we can, but since GSP does not do a sounding, we rarely get a meaningful sample of the cold air damming in the SE states.

Above: NUCAPS Forecast from morning pass over east coast showing CAD feature over the east coast.

Octane Speed and Direction

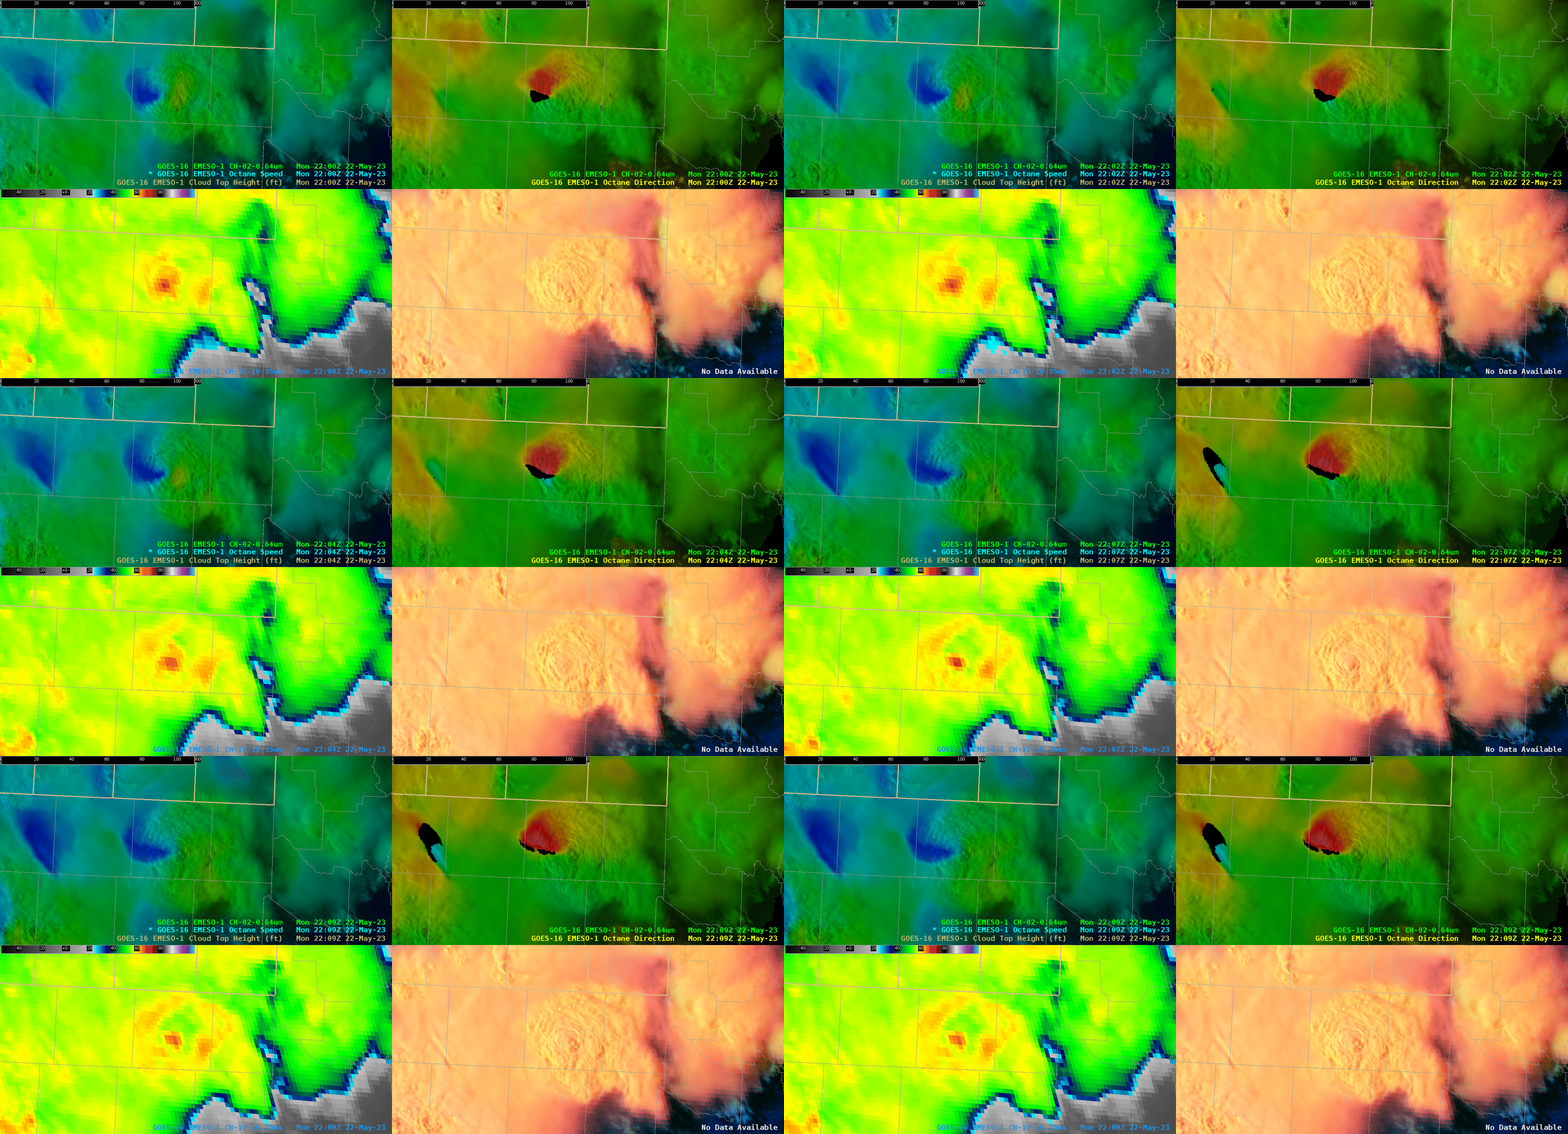
Above: Octane image around 22Z for storm just south of AMA.

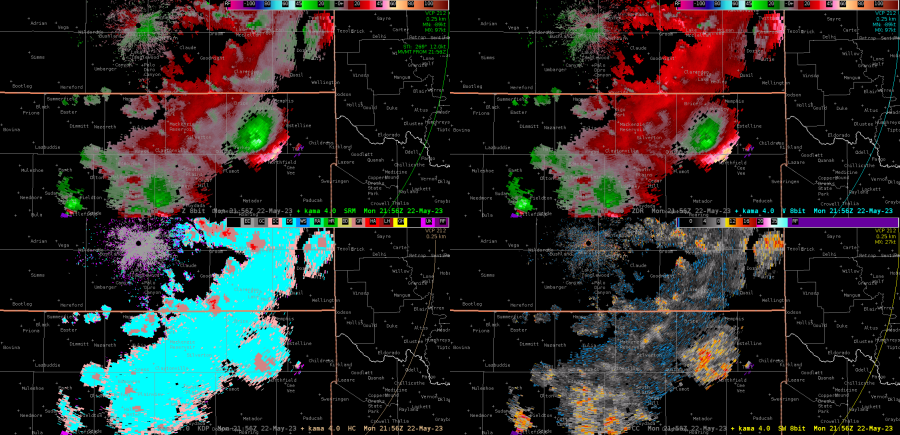
The Octane product was extremely useful in seeing when updrafts were really "taking off" and hitting the tropopause, immediately highlighting storms which require quick attention. Another extremely useful feature is sampling the actual speed, which gave a potential proxy for storm top divergence. Noticed that the Octane product gave a value around half of what the radar was measuring on this storm - ~50 kts on the Octane product vs ~100-110 kts on the radar. I'm assuming the resolution combined with some of the smoothing within the algorithm may be playing a role here, but it would be interesting to see if there is a consistent way to match the two up, even if there is just a "rule of thumb" or something. This would be huge in areas of sparse radar coverage (portions of the west or the ocean, for example).

Below: Radar image of storm top divergence near 22Z from KAMA.

ProbSevere v3

Noticed an interesting time period where two close updrafts - one fading, one picking up, resulted in some jumping of the ProbSevere product as it would sometimes combine the objects and then sometimes track them separately. I think this shows the importance of pairing the algorithm with analysis - just looking at the time series of the product could lead to misinterpretation of what was happening.

-Carl Coriolis

Friday, May 19, 2023

ProbSevere v3 less affected by meager flash rates and effective shear

A number of severe storms on May 17, 2023 illustrated improvements of ProbSevere version 3 (PSv3) over version 2 (PSv2). 

Several storms in South Dakota exhibited low total-lightning flash rates (6-10 fl/min). The dearth of lightning greatly diminished the PSv2 probability of severe weather in the next 60 minutes, while not hurting the probabilities for PSv3 nearly as much.

In this storm near Rapid City, SD, PSv3 = 48% while PSv2 = 17%. This was shortly after the first 1-inch diameter hail report. The low effective shear (21 kt) was also diminishing the probability for both models.  The MESH (1.62"), VIL (40 kg/m^2), ENI flash rate (6 fl/min), and lapse rate 0-3 km (9.3 C/km) were the strongest contributors here. One observation we've noticed repeatedly is that total lightning information is still important in PSv3 (even low flash rates), but does adversely diminish the probability of severe to nearly the same degree as PSv2. 

Figure 1: ProbSevere, MRMS MergedRef, and NWS severe thunderstorm warning for a storm near Rapid City, SD.

Further south, the effective shear was a bit more favorable (33 kt). At this time (see Figure 2), PSv3 = 73% and PSv2 = 41%, and a 1-inch diameter hail report was recorded. More hail reports were recorded an hour later. The main difference between this storm and the storm in Figure 1 is that the effective shear was slightly favorable, while the low ENI flash rate was unfavorable in PSv2 (but not so in PSv3).
Figure 2: ProbSevere, MRMS MergedRef, and NWS severe thunderstorm warning for a storm west of Pine Ridge, SD.

Traveling eastward, another severe storm produced a 60-mph wind gust at 21:46 UTC (Figure 3). At this time, PSv3 was 23% higher than PSv2 (though PWv3 was only 11%). The high MESH (1.37") and composite reflectivity (70 dBZ) help compensate for the very low shear (18 kt), while again we see that the low flash rate does not harm PSv3 as much as PSv2. 

Figure 3: ProbSevere, MRMS MergedRef, and NWS severe thunderstorm warning for a storm near Belvidere, SD


Heading to the eastern U.S., numerous trees were reported down at 18:55 UTC in eastern Alabama (Figure 4). At this time, PSv3 = 21% and PSv2 = 2%. The flash rate was decent (25 fl/min), with a MESH of 0.57" and VIL of 31 kg/m^2. The environmental flow, however, was quite poor (eff. bulk shear = 19 kt; mean wind 1-3 km = 16 kt). An enhanced low-level lapse rate (7.5 C/km) and lower wetbulb 0C higher (11.1 kft) also nudged up the probability of severe in PSv3. Even though PSv3 was only 21%, that is a marked improvement over PSv2, and could have helped forecasters identify a possible severe weather threat sooner, while a PSv2 value of 2% would likely be ignored. 

Figure 4: ProbSevere and MRMS MergedRef for a severe storm near Mount Olive, AL.


A storm near Waynesboro, MS was increasing in probability prior to a hail report at 22:08 UTC. At this time, PSv3 was 31% higher than PSv2 (though v3 was highlighting wind as the main threat). The MESH, flash rate, and VIL were the main contributors here, while the paltry effective shear was the top detractor (Figure 5). 

Figure 5: ProbSevere and MRMS MergedRef for a severe storm near Waynesboro, MS.

Finally, in Charleston, SC, this storm produced a hail report and multiple wind reports from 21:40 to 21:50 UTC. At this time, PSv3 = 45% and PSv2 = 17%. Again, the flash rate, MESH, and lapse rate 0-3 km were the top contributors, whereas the lack of satellite growth was the main detractor (Figure 6). 

Figure 6: ProbSevere and MRMS MergedRef for a severe storm over Charleston, SC.

Overall, we've found that PSv3 improves severe weather detection and prediction over its predecessor, often highlighting threats sooner. For mature severe storms with very strong storm attributes, PSv2 is often higher than PSv2, sometimes by 20% or more (e.g., 95% vs. 75%). However, we believe that a little worse performance on the "high end" of storms is a good trade-off for being able to capture severe weather in more marginal (but still impactful) situations, and doing so sooner, overall. 
Friday, May 5, 2023

ProbSevere v3 in west Texas

Severe convection was rather marginal and sparse on 3 May, 2023. However, a few storms of note demonstrated better predictions for ProbSevere v3 (PSv3) over ProbSevere v2 (PSv2). 

A storm in the Texas Panhandle, southwest of Dumas, TX, was in an environment with moderate MLCAPE (1200 J/kg) and low-to-moderate effective bulk shear (30 kt). This storm was around for over an hour before it finally produced severe hail reports (up to 1.5" in diameter). Approximately an hour prior, however, PSv3 was much greater than PSv2; 62% vs. 4% (see Figure 1). In this case, PSv2 was too reliant on the ENI flash rate, which was only 4 fl/min. While lightning is important in PSv3 models, it is less affected by storms with a dearth of lightning than version 2, especially when other parameters show increased severe potential (in this case, MESH and mid-level azshear). 

Figure 1: ProbSevere contours, MRMS MergedRef, and NWS severe thunderstorm warning for a storm near Dumas, TX.

Figure 2: Time series of PSv3 and PSv2 probabilities for the storm near Dumas, TX, which produced 1.5" hail. 

The 00Z sounding from Amarillo, TX (Figure 3) might be able to shed some light on why the MESH was so high (up to 1.6") yet lightning was quite low (~6 fl/min) from both ENI and GLM sensors. In this case, the precipitable water in the column was quite low (about 0.68"). This, combined with the low environmental RH in the mixed phase region of the troposphere probably combined to produce relatively few collisions of liquid and frozen water particles needed to produce charge separation necessary for lightning production. Ice nuclei, on the other hand, seemed to accrete supercooled droplets efficiently, producing large hail stones.

Figure 2: Observed sounding from Amarillo, TX at 00Z on 4 May 2023.

Another storm in southwest Texas, near Pecos, also produced severe hail (1" diameter).  The lightning was also low for this storm, though PSv3 had 51% while PSv2 has 37%. The MRMS azimuthal shear parameters were zero here. This was likely because the average beam height of the lowest tilt of the closest radar was 10-11 km above ground level! The MRMS products compute azimuthal shear between 0-2 km and 3-6 km AGL. The missing azimuthal shear values for this storm reduced the probabilities of severe, but not quite as much in PSv3 as in PSv2. 

Figure 3: ProbSevere contours, MRMS MergedRef, and NWS severe thunderstorm warning for a storm near Pecos, TX.

Tuesday, May 2, 2023

East Coast Tornadoes

The past few days have seen several strong tornadoes along the U.S. east coast. A shortwave trough with ample upper-level diffluence provided a forcing mechanism for severe storms from Florida to Virginia.

Near Juno Beach, FL, a tornado damaged power lines, homes, buildings, and cars. Maximum wind speeds were estimated at 130 mph (rated EF2). Oddly enough, this tornado was only about 20 miles north of a weaker tornado from the day before.

Figure 1: ProbSevere v3 contours, MRMS MergedReflectivity, and NWS severe weather warnings for a storm near Juno Beach, FL. Outer contours on ProbSevere objects are colored by the probability of tornado.

ProbTor v3 (PTv3) is better calibrated than its v2 counterpart. There was a distinct ramp up in the tornado probability for this storm prior to tornadogenesis, compared to PTv2 (Figure 2). Part of this ramp up was due to higher 0-1 km storm-relative helicity depicted in the HRRR (~160 J/kg), which was much higher than the RAP. Storm rotation was also slowly increasing. Interestingly, this occurred at the same time that lightning and reflectivity-based parameters were decreasing. Despite low overall probability for tornado (20-30%), the ramp up, coupled with the fact that PTv3 remains on the low end overall (max of ~60%) could perhaps have tipped off users to look more closely at this developing storm.

Figure 2: Time series of PTv3 and PTv2 for a tornadic storm on the Florida coast, along with severe reports and NWS severe weather warnings.


The next day, Virginia Beach, VA was hit with an EF3 tornado, with peak winds estimated between 140 and 150 mph. Remarkably, no injuries were reported despite damage to 100 homes. In this case, PTv3 exceeded PTv2, and even hit 60%, which is a very high value for v3. The dip in probability shortly before the tornado was likely due to a pronounced reduction in mid-level azimuthal shear, which quickly rebounded (the 1-3 km mean wind also dropped from 37 kt to 30 kt during that time). 

Figure 3: ProbSevere v3 contours, MRMS MergedReflectivity, and NWS severe weather warnings for a tornadic storm near Virigina Beach, VA. Outer contours on ProbSevere objects are colored by the probability of tornado.
Figure 4: Time series for ProbSevere v3 probabilities, along with reports and NWS severe weather warnings.

Eastern Oregon storm

An elongated trough drew in enough elevated CAPE for a few storms to pop up in eastern Oregon. Very strong lapse rates (≥ 8-9.5 C/km) mixed down strong momentum from roughly 4-5 km AGL, producing downed trees and measured gusts to 65 mph. ProbSevere v3 (PSv3) showed rapid increases in the probability of severe at around 00:20 UTC and 00:50 UTC (Figures 1 and 2). 

Figure 1: ProbSevere v3, MRMS MergedReflectivity, and NWS severe weather warnings for a storm in eastern Oregon.


Figure 2: Time series of PSv3 probabilities for the eastern Oregon storm


The increasing MESH (up to around 1"), composite reflectivity (up to 63 dBZ), and ENI lightning (up to 10 fl/min) contributed to the first rapid rise in the probability of severe. A very strong satellite growth rate at 00:46 led to the next jump, up from 49% to 67%. One can see the cooling cloud tops in the GOES-18 visible/IR sandwich imagery that preceded 3 of the 4 severe wind reports (the first wind report was recorded at 00:41 UTC). 

Figure 3: GOES-18 10.3-µm brightness temperature and 0.64-µm reflectance for the storm in eastern Oregon.

In this example, the probability of severe hail seemed to be the strongest value; however, wind was the only hazard reported. While PSv3 generally has improved discernment among severe weather hazards, this would be a good case to look into to see if we can better incorporate model predictors in PWv3 that take into account the mixing of momentum very high in the atmosphere down to the surface, which is relatively common in the western U.S. 


Wednesday, April 19, 2023

Elevated hailers

Some elevated storms in Wisconsin have been producing one-inch-diameter hail today. One such storm traveled just west and north of Madison, Wisconsin (Figure 1).

Figure 1: ProbSevere contours and MRMS MergedReflectivity for an elevated storm in Dane Co., Wisconsin.

The storms have been forming in a low-CAPE environment (all of the CAPE is from the most-unstable parcel), with decent effective bulk shear. In ProbSevere version 3, ProbHail has been handling this event better than version 2. While ProbWind v2 is elevated (40%), this isn't really a wind threat, but solely a hail threat. We've seen that ProbSevere v3 consistently discerns the most prominent hazard type better than v2, generally speaking.

One-inch-diameter hail was reported at 15:28 UTC, just a few minutes after a large increase in ProbHail v3 (Figure 2), which was partially due to an increase in the maximum composite reflectivity.


Wednesday, June 22, 2022

GLM and Lightning Cast

The GLM parallax showed up again Thursday, June 16th, over the PBZ area. This was even more evident than yesterday’s event in WI that was written about in a blog post.  Figure 1 has ProbSevere, LightningCast, GLM Flash Extent Density, and ENTLN data overlaid in a 4-panel.  This case was fairly simple to “self correct” the parallax as the GLM was clearly displaced to the north of ProbSevere (as well as the base reflectivity).  Really once you get a few cases under your belt recognizing the parallax, it’s not too challenging to keep that “self correct” in the back of your mind.  One interesting thing to note about Figure 1 is the storm just outside the PBZ CWA just south of Mount Veron, Ohio (See bottom left in Figure 1).  The ProbSevere and GLM FED are lined up perfectly and this is a great example of utilizing the lower threshold in the colormap. The bullseye shows up much nicer than the larger thresholds in the top two images.

Figure 1: GLM with ProbSevere and LightningCast

- Podium

Friday, June 17, 2022

What’s the best way to look at NUCAPS?

So far this week, I’ve been impressed with the performance of NUCAPS and for the most part Modified NUCAPS with providing thermodynamic profile information in areas that there are overpasses.  However, what would be the best setup to figure out how well NUCAPS is doing.  Let’s dive in:

Today we’re located in Binghamton, NY (BGM) office with a Enhanced risk over the region.  We’ve also got a NUCAPS sounding directly over the region which can help us with evaluating how well things like the SPC Mesoanalysis graphics or other models are doing:

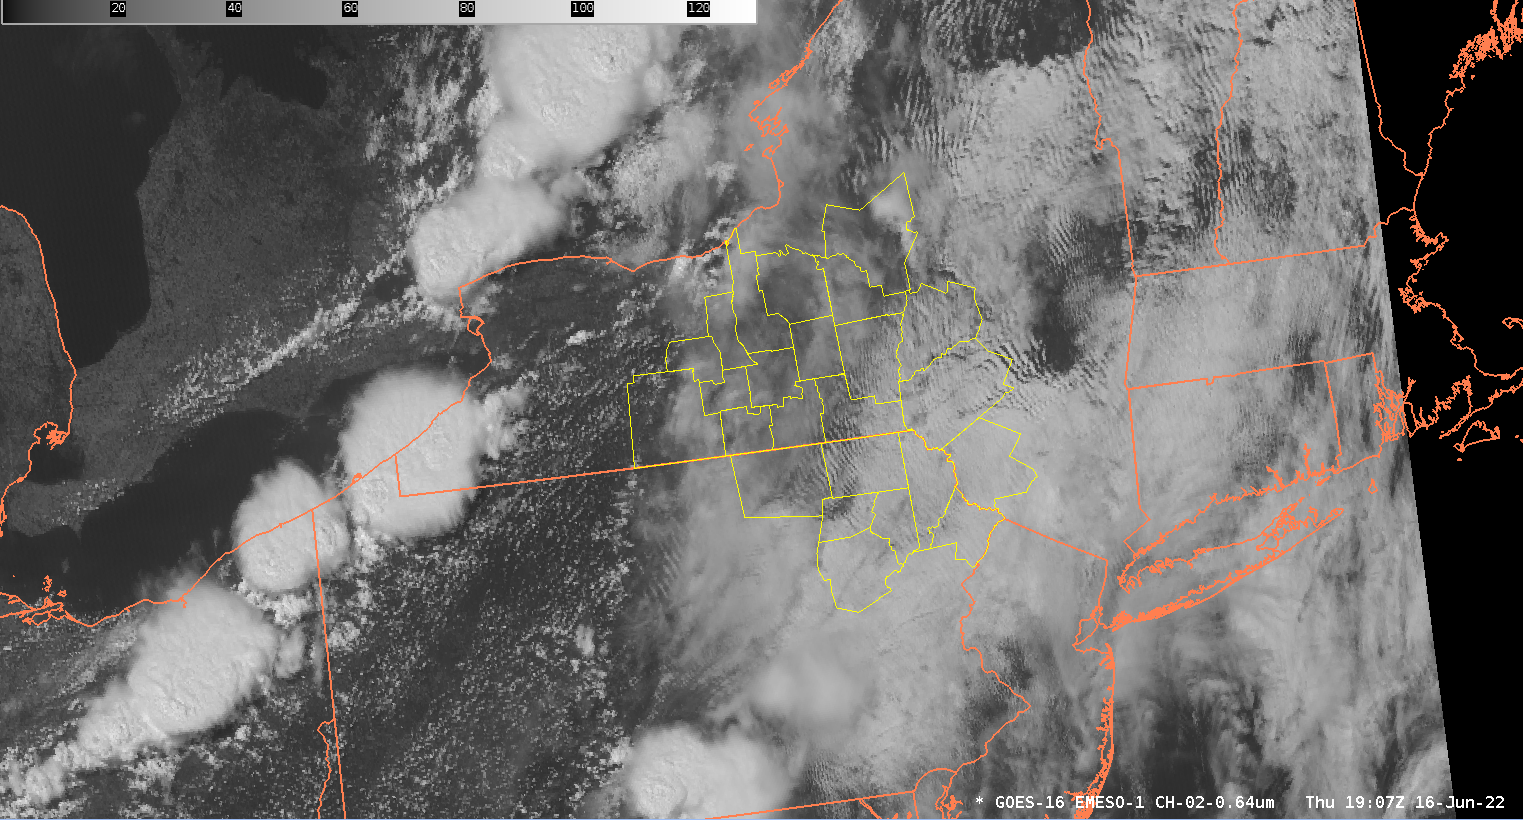
But, visible satellite shows that there are some clouds that could be interfering with the retrievals:

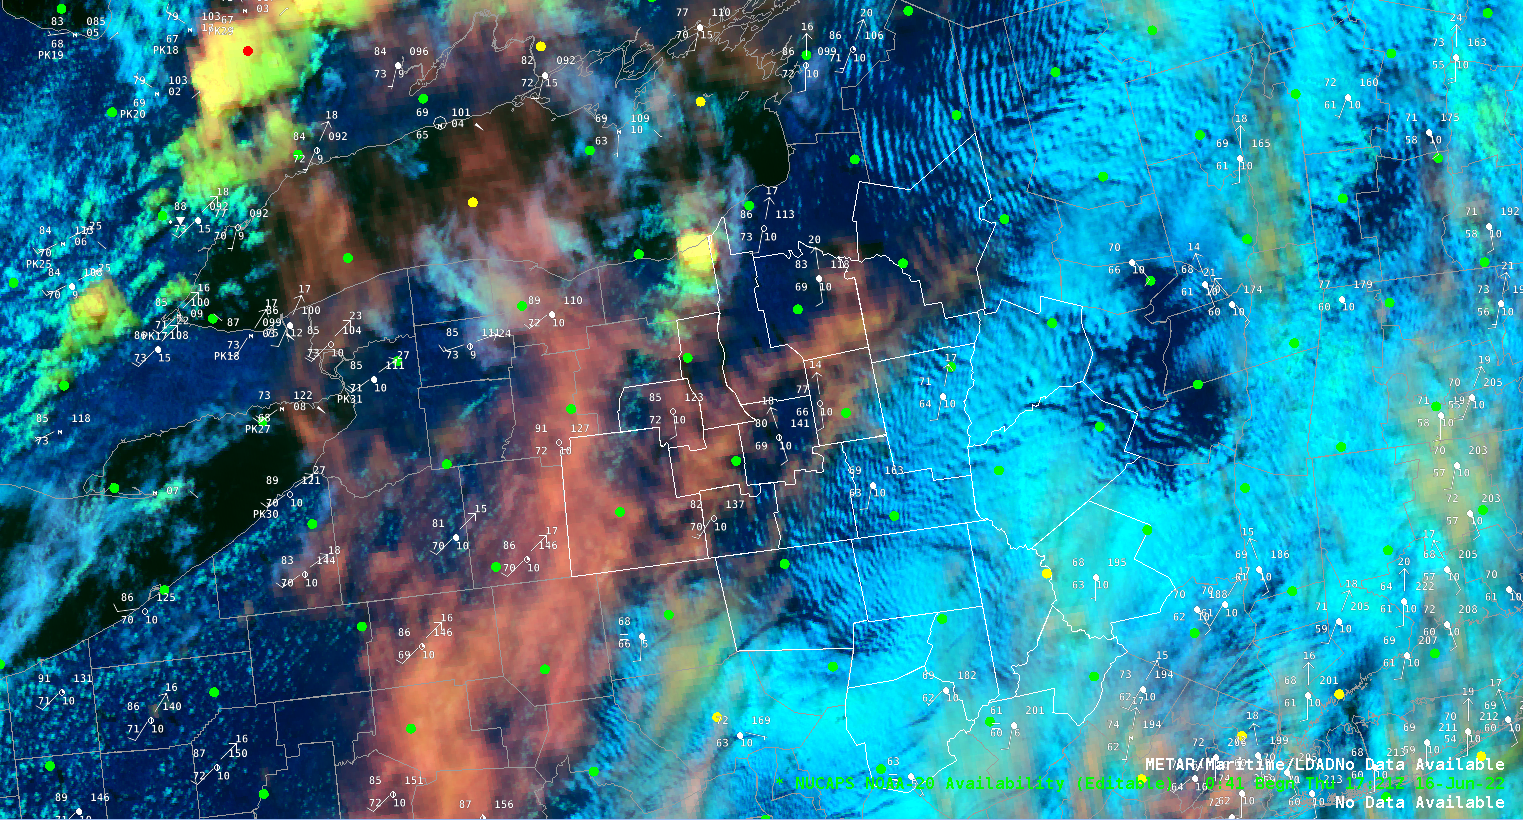
After playing around a bit, it may be a good idea to load the Day Cloud Phase RGB, NUCAPS points, and surface observations into one pane:

This is useful for three reasons:

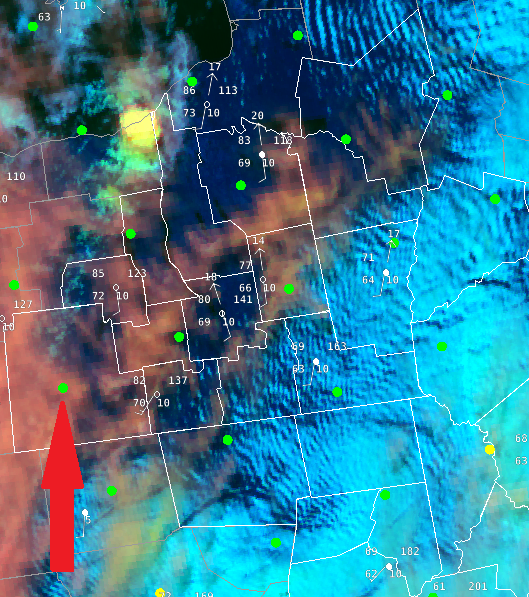
  1. We can see that the red in the Day Cloud Phase are mainly high clouds that are pretty thin and has enough gaps to allow for good retrievals underneath the cirrus.
  2. The low clouds are pretty thin except over the southern part of the CWA where some of the retrievals are yellow indicating that caution should be taken when looking at the profiles
  3. The surface observations can be used to give an idea of how well the surface T/Td are in the soundings which will impact all of the convective parameter calculations (especially CAPE/CIN)

So what about the soundings?  Looking at the NUCAPS and Modified NUCAPS here:

We can see how things are handled by the soundings.

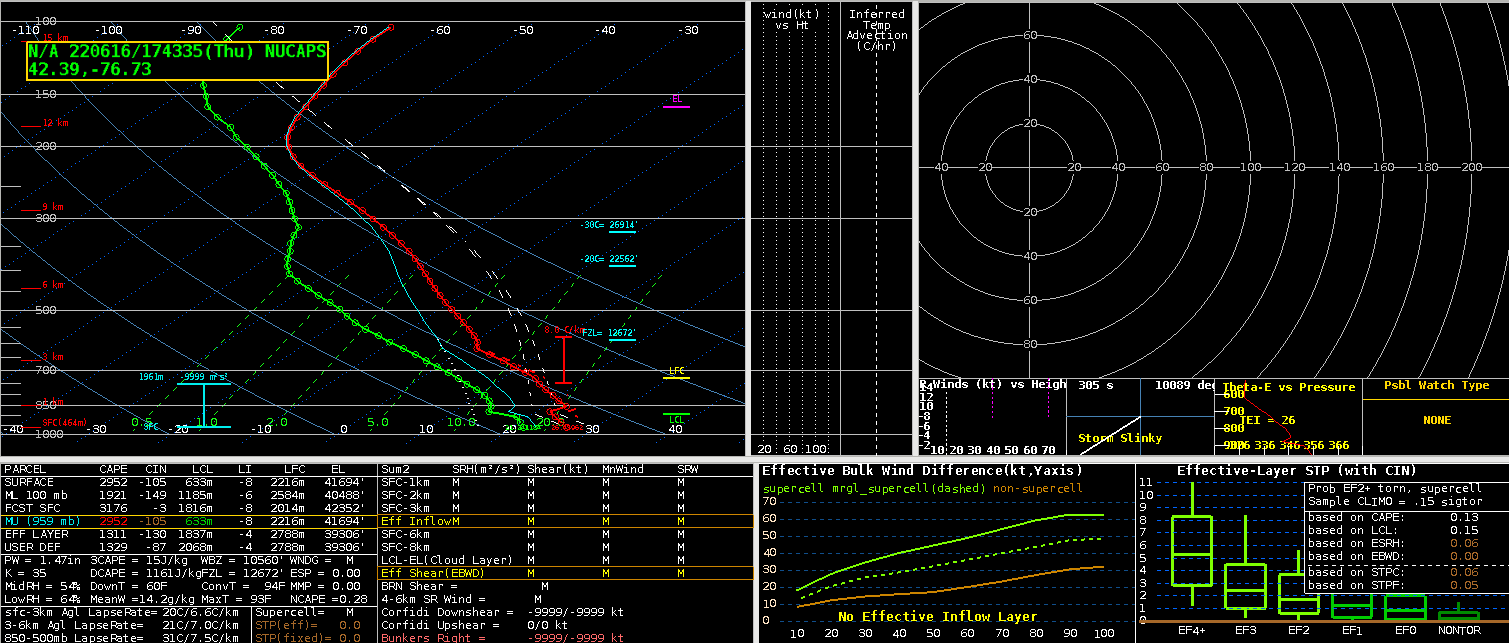
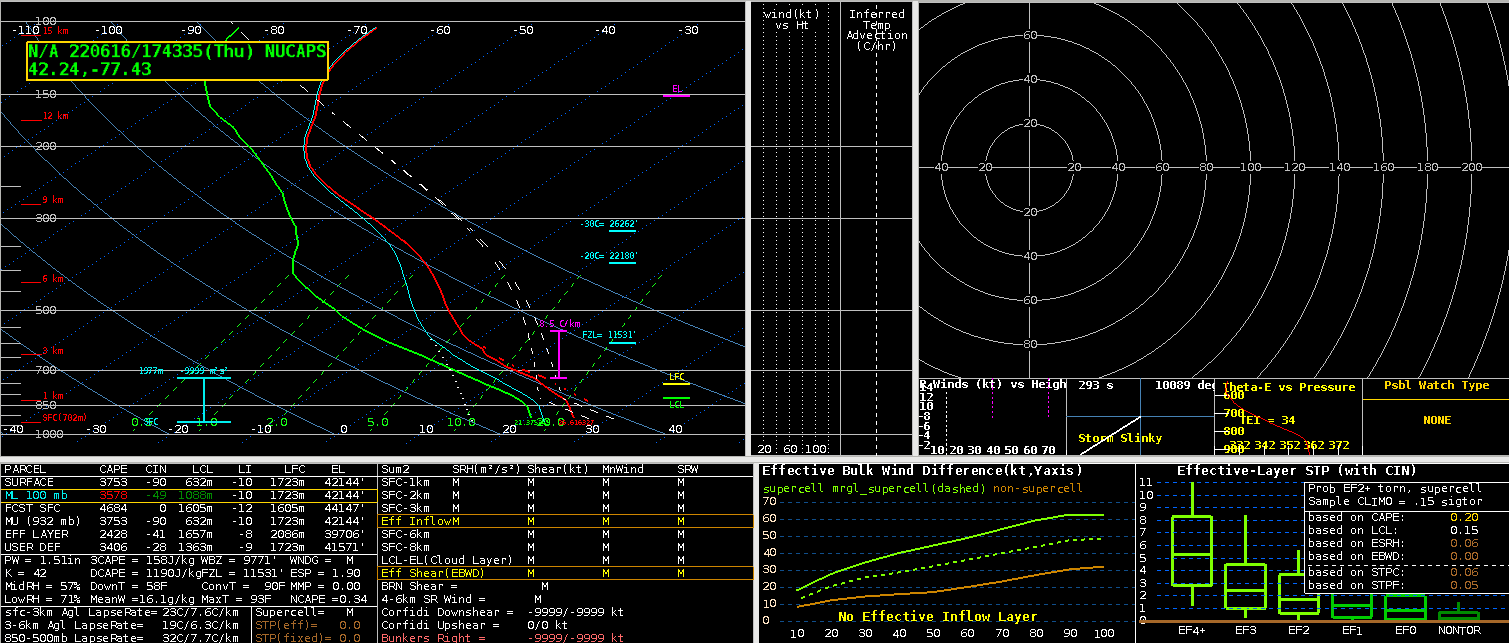
Here is the original NUCAPS sounding at this point:

Of note, the surface conditions in the NUCAPS sounding is too warm (85 vs 80 at the nearest ob) while the Td were fairly close 69 vs 70.  How did the modified NUCAPS do?

80/70 in the sounding which is a much more likely scenario based on surface observations closest to the time of the overpass/sounding.

Why is this important?  Well, all your convective parameters are based on these two conditions.  MLCAPE drops by around 400 J/kg (~3900 J/kg vs ~3500 J/kg) AND CIN increases from -19 J/kg in the unmodified to -49 J/kg in the modified NUCAPS.  This too lines up with what the visible satellite shows; a lack of boundary layer CU potentially meaning the CAP is holding strong.  

-Pym

ProbSevere V3 Adjusting During New Cell Formation

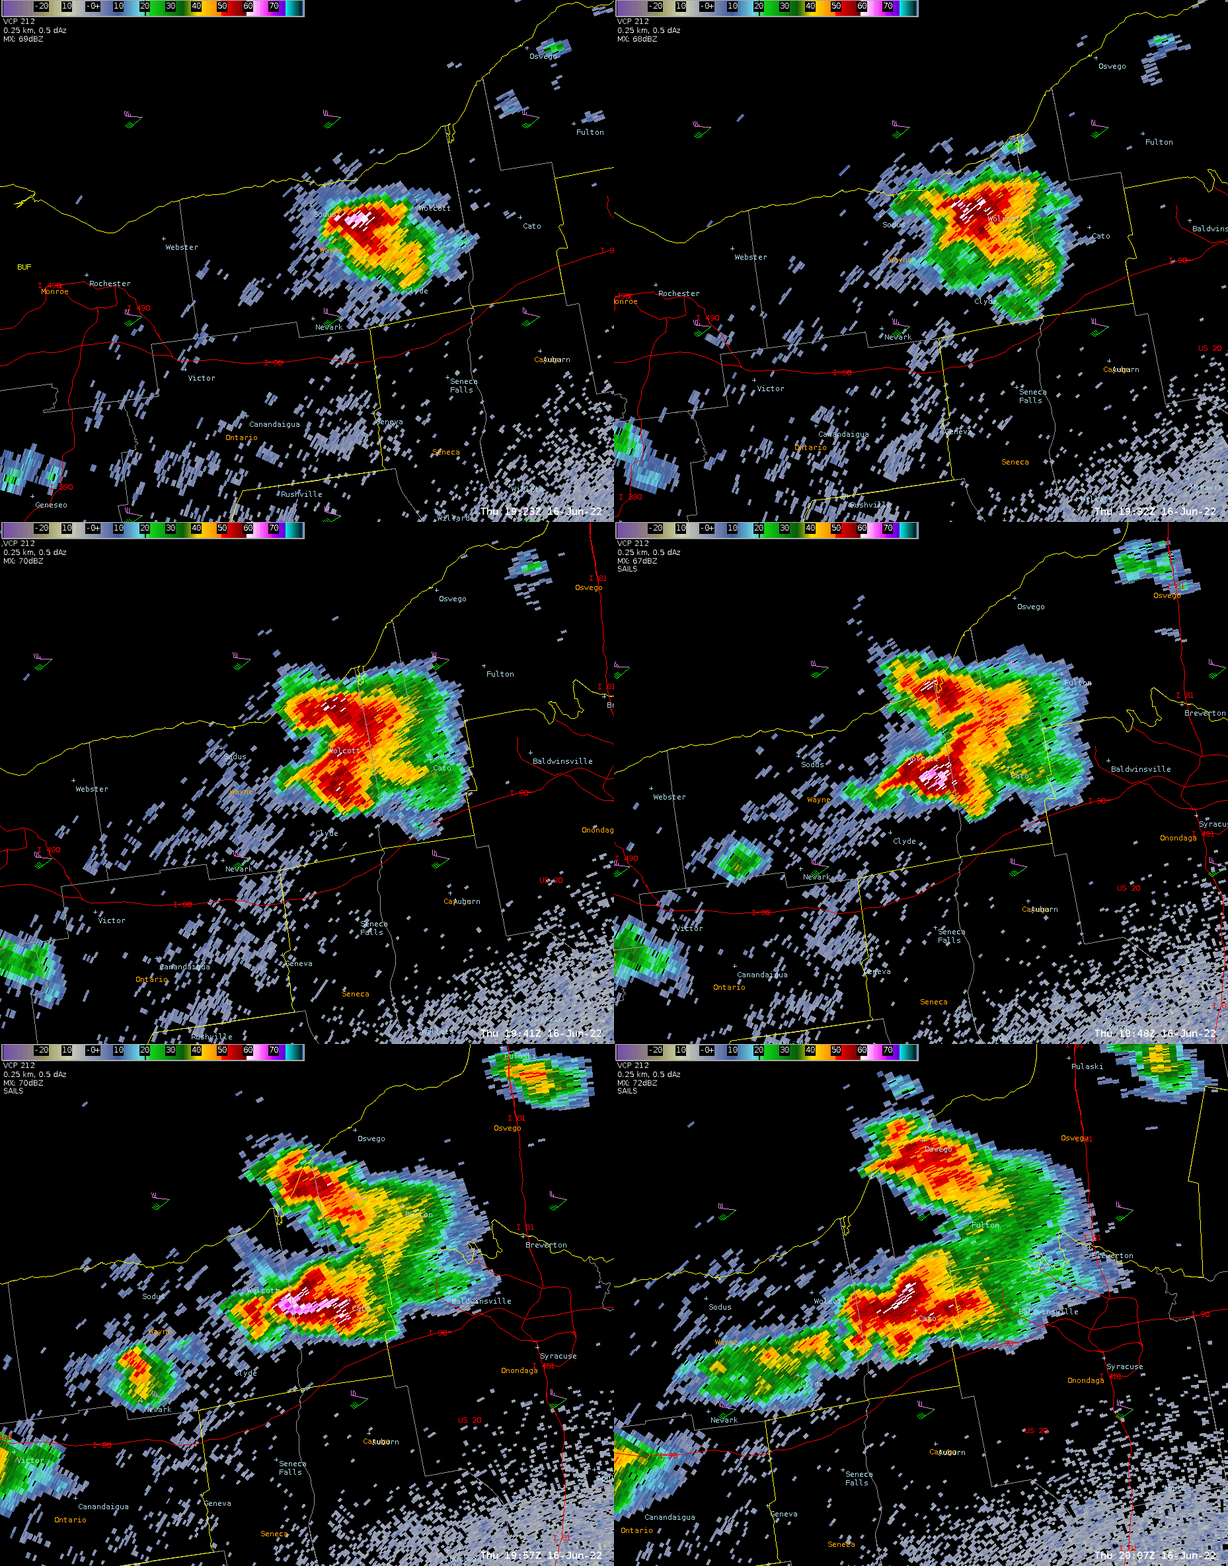
 ProbSevere V3 has been showing much improvement over version two, with this particular day featuring somewhat pusley mixed-mode storms across upstate New York. This particular group of cells had habitual new updraft development, with storms nearing or briefly becoming severe as high dBZ cores develop aloof then make their way downward. These particular cells were able to form 1.00” hail. The ProbSevere V3 time series reflected the marginally severe nature of these storms very well, with values peaking at 60 to 65%. The very encouraging sign was the peaks and valleys in the ProbSevere V3 time series that showed this group of cells peaking at over 50% severe probabilities, dipping below 50% as the new updraft takes over, and then once again peaking above 50% once the new updraft strengthened. I’d definitely recommend forecasters to take a look at the timeseries to build confidence in cell trends during warning applications.

Shown above is the group of cells, with the initial one showing a core of 60+ dBZ that begins to drift off to the northwest while a newer updraft takes over and moves more east-northeast.

- aerobeaver