Thursday, June 9, 2022

Comparing NUCAPS Soundings along Warm Front Passage


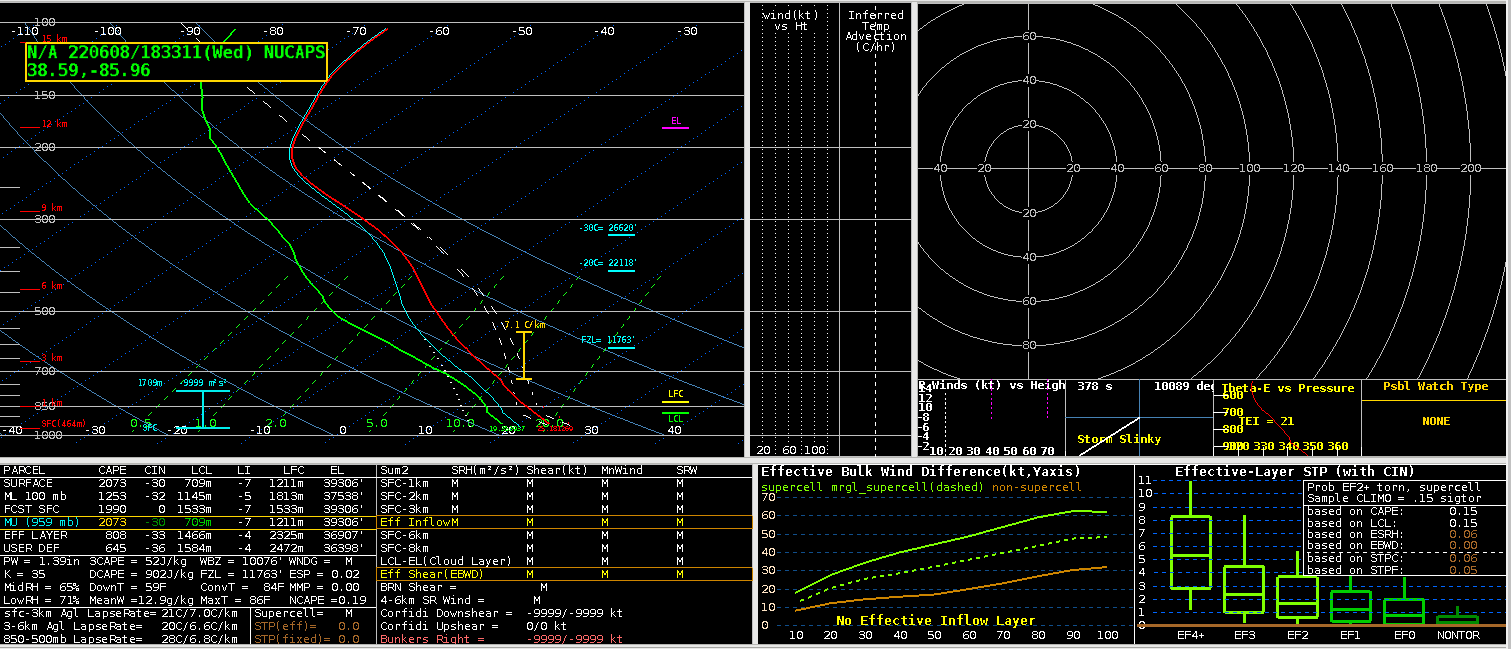
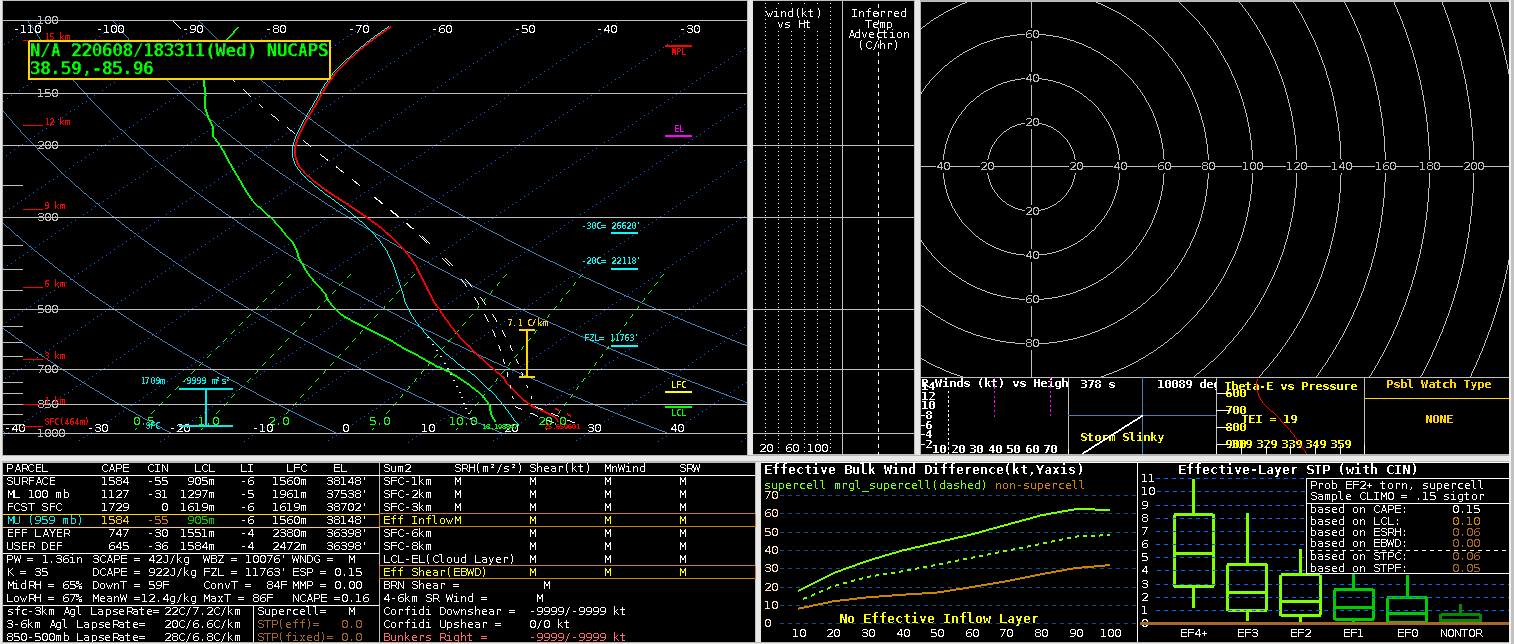
NUCAPS Sounding (1832 UTC)

NUCAPS Modified Sounding (1832 UTC)

NUCAPS and NUCAPS Modified soundings displayed were along a warm frontal passage lifting south to north across southern Indiana. The modified NUCAPS sounding provided a more realistic depiction of the environment with higher levels of instability (CAPE and DCAPE). Furthermore, the LCL values represented in the modified sounding were lower; depicting an environment more favorable for tornadoes along the warm front.


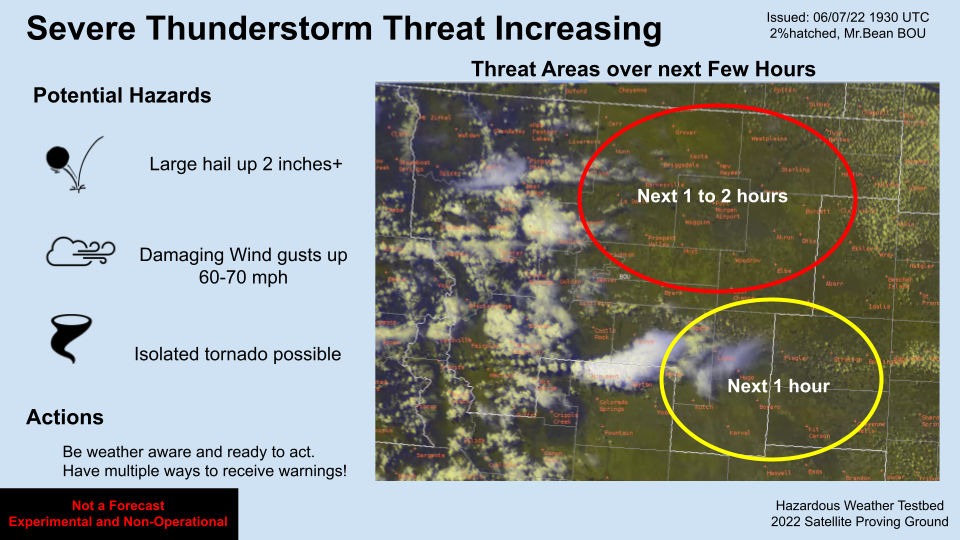
- 2%hatched

Wednesday, June 8, 2022

LightningCast out west

One team of HWT forecasters is in Midland, TX, monitoring convection and serving DSS for the Midland Rockhounds Triple-A baseball team. As we got started, LightningCast for the GOES-17 mesoscale sector is already showing some initiation on the high terrain. However, an outflow boundary heading south-southwest is undercutting some convective cells. LightningCast has higher probabilities, but very few flashes so far behind the outflow boundary. We'll see how the outflow boundary interacts with the rest of the convection.

Figure 1: LightningCast contours and the day-land-cloud RGB from the GOES-17, and GLM flash-extent density from GOES-16.

Two Storms GOES 16 v 17

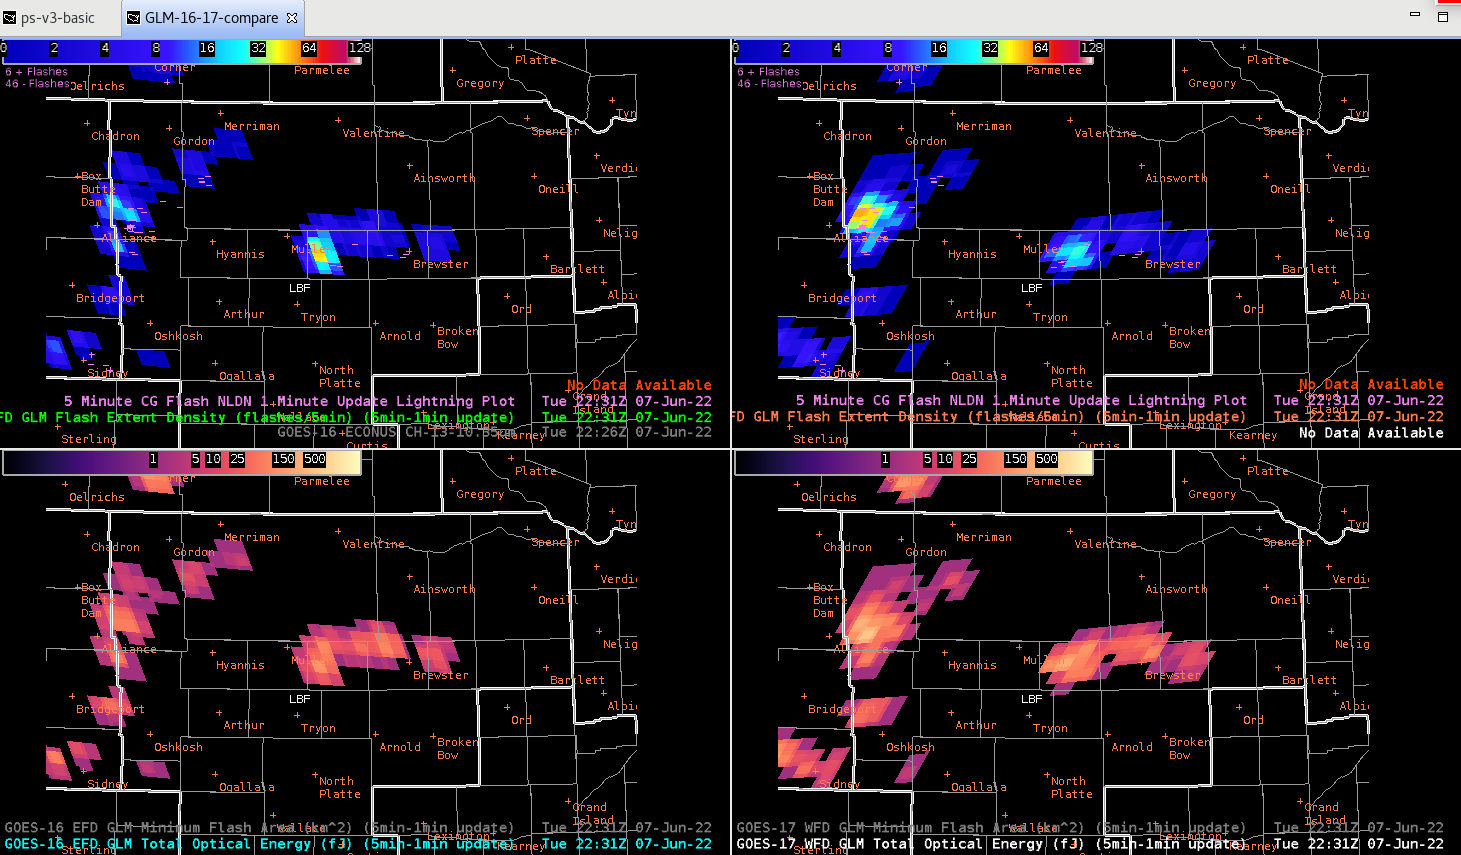
 Being on the western edge in the North Platte County Warning area we did a comparison versus GOES 16 and 17 with the GLM Flash Extent Density. At first there wasn’t much of a difference, but when storms started to ramp up more and we had a decent eastern and western storm there was a difference.

As you can see our eastern storm shows up better on GOES 16 and not as good on GOES 17. Meanwhile the western storm there is a much greater difference in the Flash Extent Density (and Total Optical Energy) on GOES 17. This matches with what was stated at the initial discussion this morning that GOES 17 may work better with western storms.

-Noctilucent

Northeast Colorado Supercells


Nowcasting Supercell storm entering CWA: The loop of instability and SigTor highlight the southeast/south central CWA east of Colorado Spring, ahead of an already ongoing storm. North of this storm an environment of favorable instability exists up to about the latitude of Denver, with a significant drop off to the north.

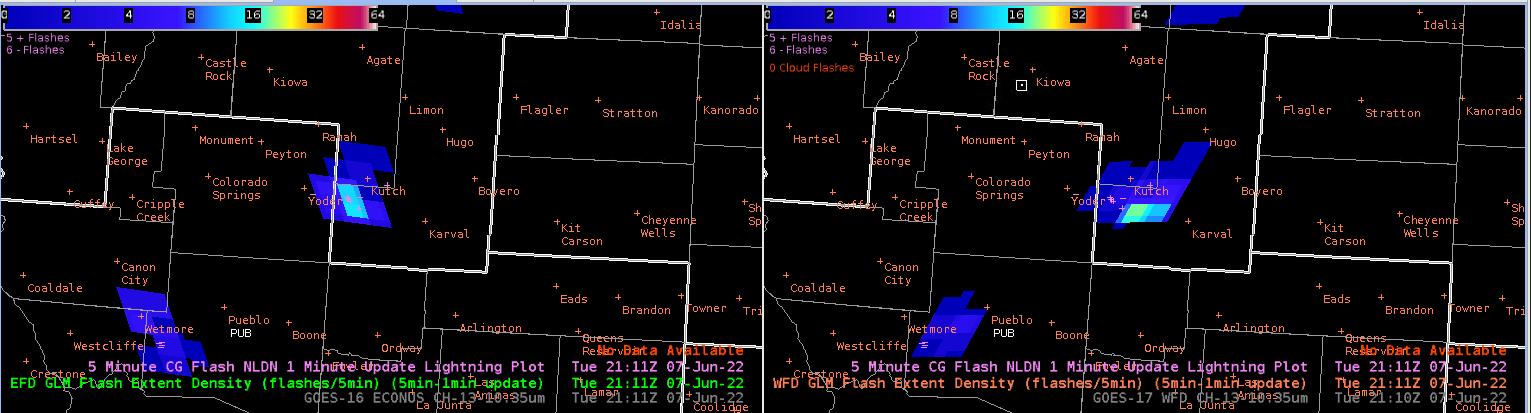
When it comes to high and northern plains - parallax becomes an issue. In this case lighting was occurring just on the other side of the border with the CWA, so here are the two LightningCasts (with/without parallax correction) for comparison:

ProbSevere v3 increases correlating to entering a favorable environment

PHI localized CAPE corridor

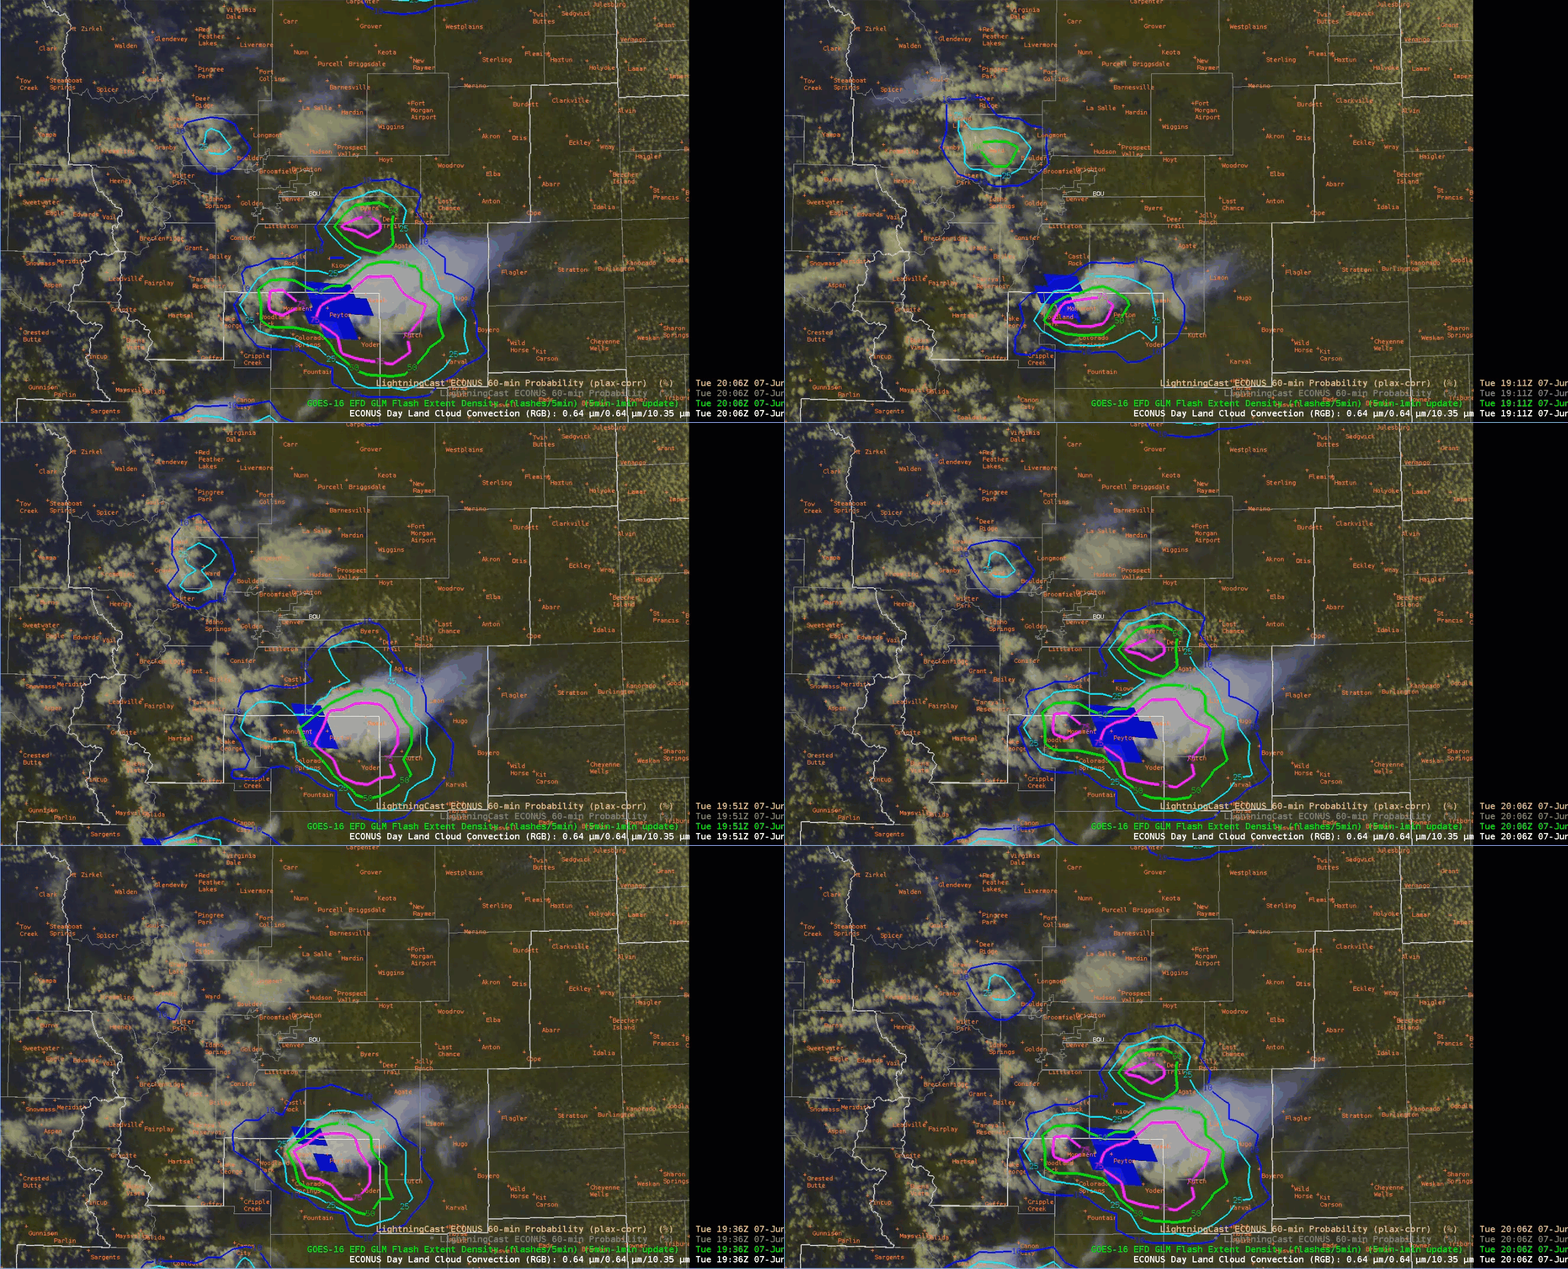
New area of MFA suggesting spitting storm with new updraft core of the established cell. (1950 UTC)

Storm cell split denoted by MFA with two distinct areas of MFA in upper right panel. (2000 UTC)

Focused on the cell east of Denver - this cell and subsequent others that developed are in the favorable area of instability. Just to the north of Boulder we spotted a few cells that attempted to develop, however in the lower instability environment movement off the higher terrain resulted in these cells falling apart. Through the rest of the afternoon this area remained convection free.

Sig Tor blip. A SRVE like feature was observed but at this time convergence associated with this feature wasn’t favorably located under the updraft.

Cell developing east of Denver, noted by the MFA  in the upper right panel. (2020 UTC)

Cell rapidly develops in an area of localized higher instability denoted by the PHS values discussed earlier on.(2034 UTC)

The LightningCast has identified the left turning nature of the storm(s) east of Denver

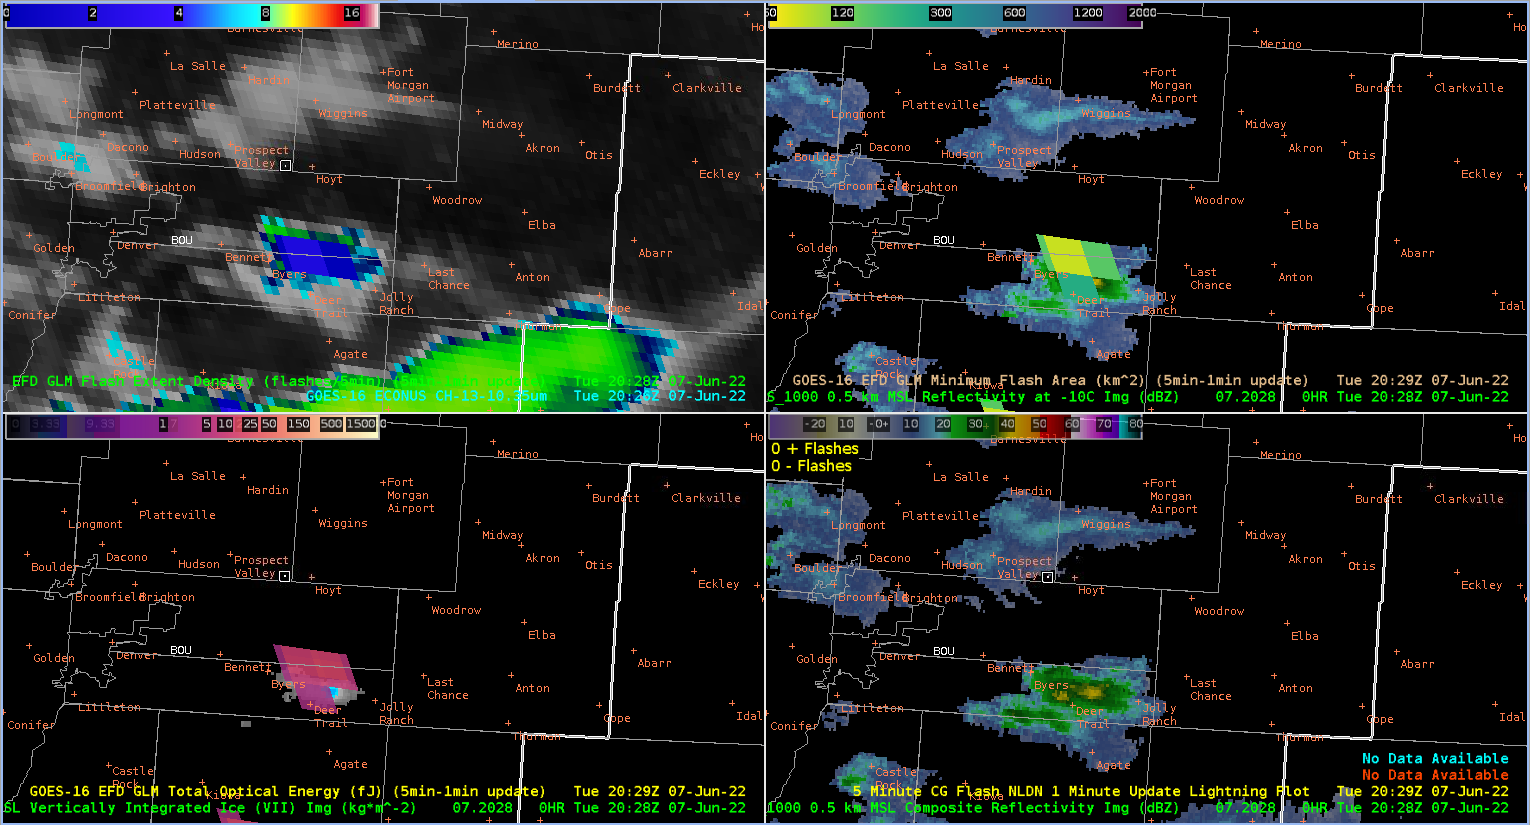
An interesting note was comparing the differences between GOES East (left panel) and GOES West (right panel). These subtle differences can  be effective in analyzing the strengthening of a thunderstorm.

In the middle of METWATCH - NUCAPS became available (about 1 hour latency). The sounding below is a modified NUCAPS profile, depicting the environment in which our storms developed. Storm mode was supercellular with frequent spitting of cells.  


-Mr. Bean

-2%hatched


CYS HWT BLOG Day 2

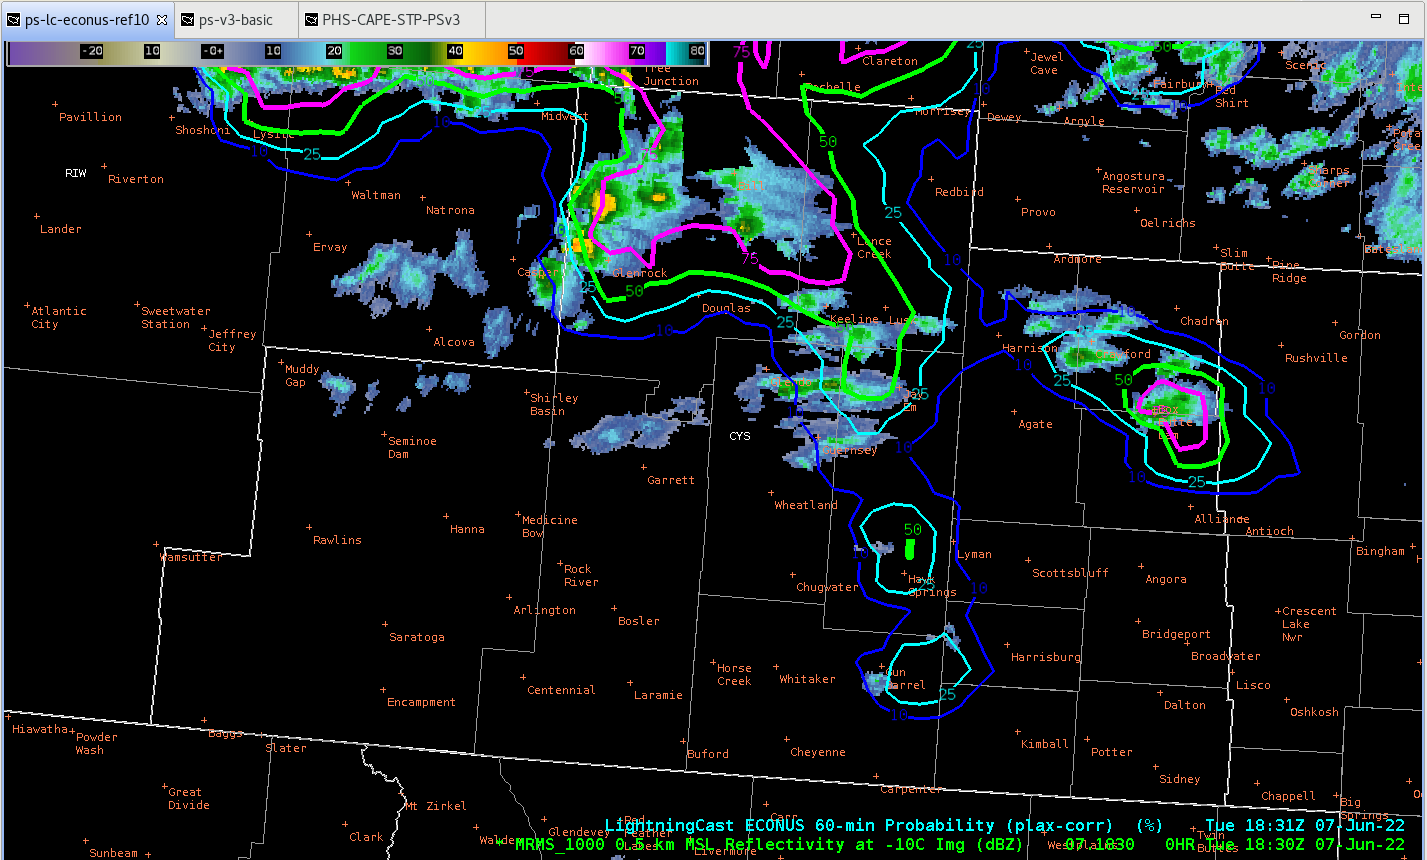
LightningCast for storm approaching Scottsbluff

First instance of 50% contour 1831 Z
The lightning cast did build before backing off for a few frames, dropping below 50%, but jumps back up above at 1851 Z. From then until the first flashes of lightning, the probabilities continued to increase.

First instance of 75% contour 1906 Z

GLM denotes flash 1915 Z
So, lightningcast was able to indicate well ahead of time that we needed to keep an eye on that storm for lightning production as it approached the city.

GraphiCasts with ProbSevere and PHS

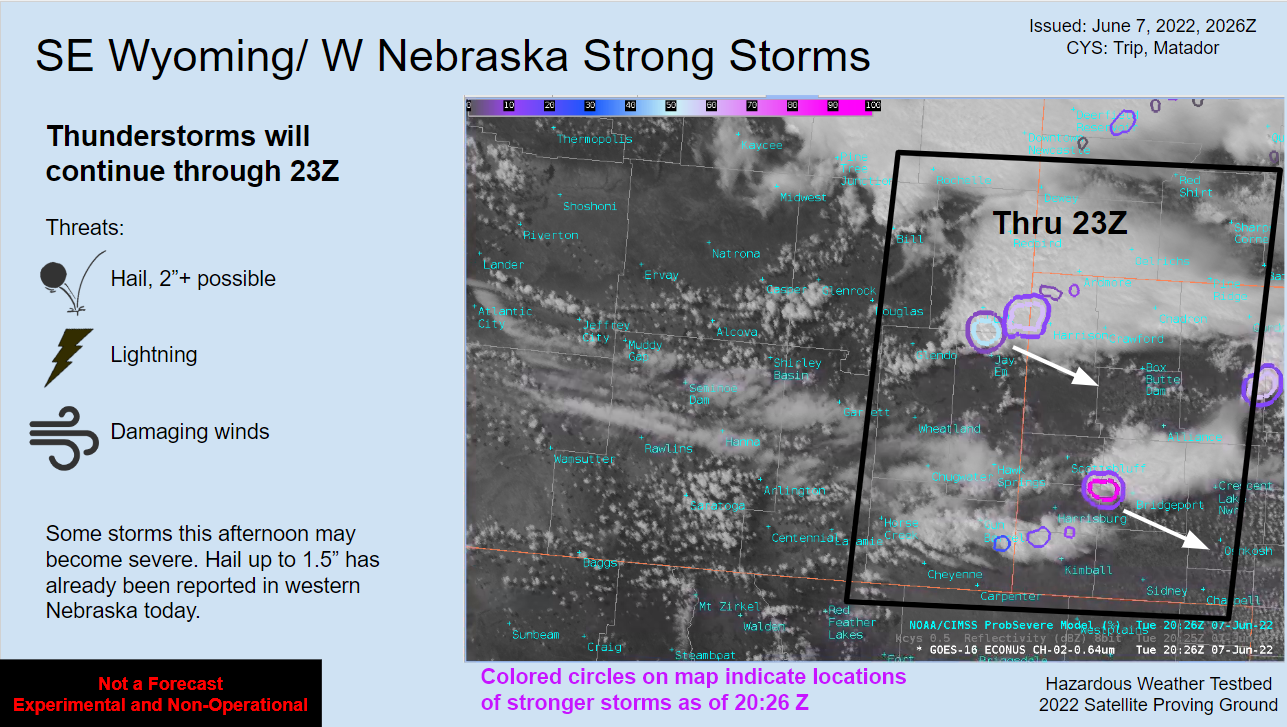
For today’s GraphiCast, decided to overlay ProbSevere V3 over visible satellite data to indicate the location of the stronger storms amongst all the clouds. The concern with using it for public graphics is whether the public will understand it. Went with a brief description that it indicates stronger storms for today, but would be curious to see how others message what probsevere means and then how the public may respond to it. I do like how it clearly shows the cells to watch out for.

To determine the time that storms would continue through, I only used the hourly PHS data which dropped off at 23Z. The images below show 20Z PHS vs 23Z. This timing for storms ending for the CYS CWA worked out well as the strong to severe storms exited the CWA by 2256Z with only a few isolated showers remaining for a short time afterwards.
20Z:
23Z: 

- Matador


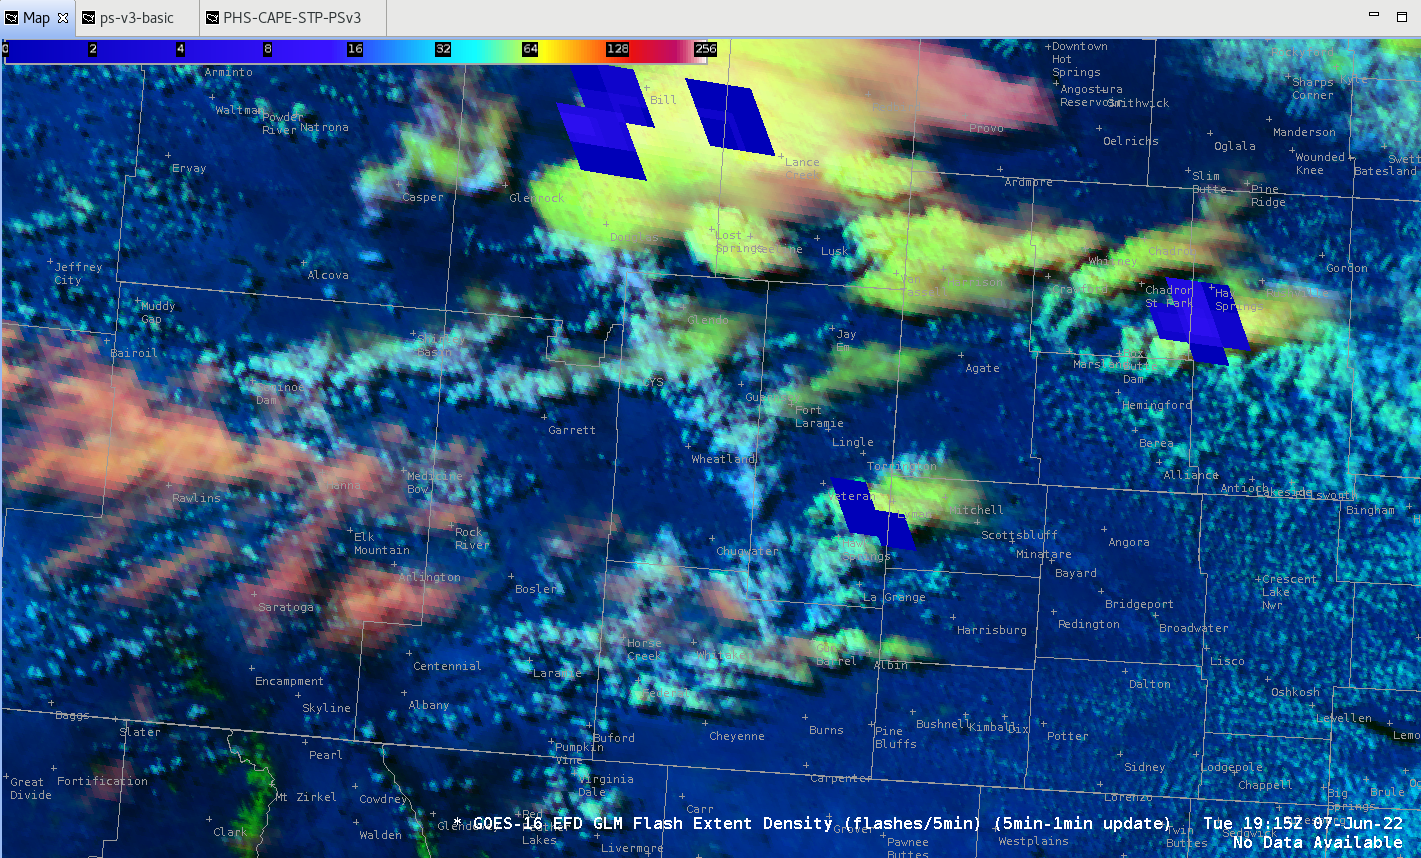
GLM – GOES-16 vs GOES-17

 Differences between the GLM Flash Extent Density products from GOES-16 and GOES-17 were quite stark for convection occurring over the Cheyenne, WY CWA on June 7th.

The two animated gifs below highlight the difference in lead times for an observed uptick in lightning activity within a cell near Scottsbluff, NE. The first animation is of GOES-17 showing the uptick in lightning activity beginning at 1939Z. The second animation from GOES-16 shows the same uptick in lightning activity, except beginning ~5mins later at 1945Z. Interestingly enough, both satellite perspectives show the downtrend in lightning activity occurring at 1950Z.

GOES-17 GLM FED Scottsbluff 5-min improved lead time.
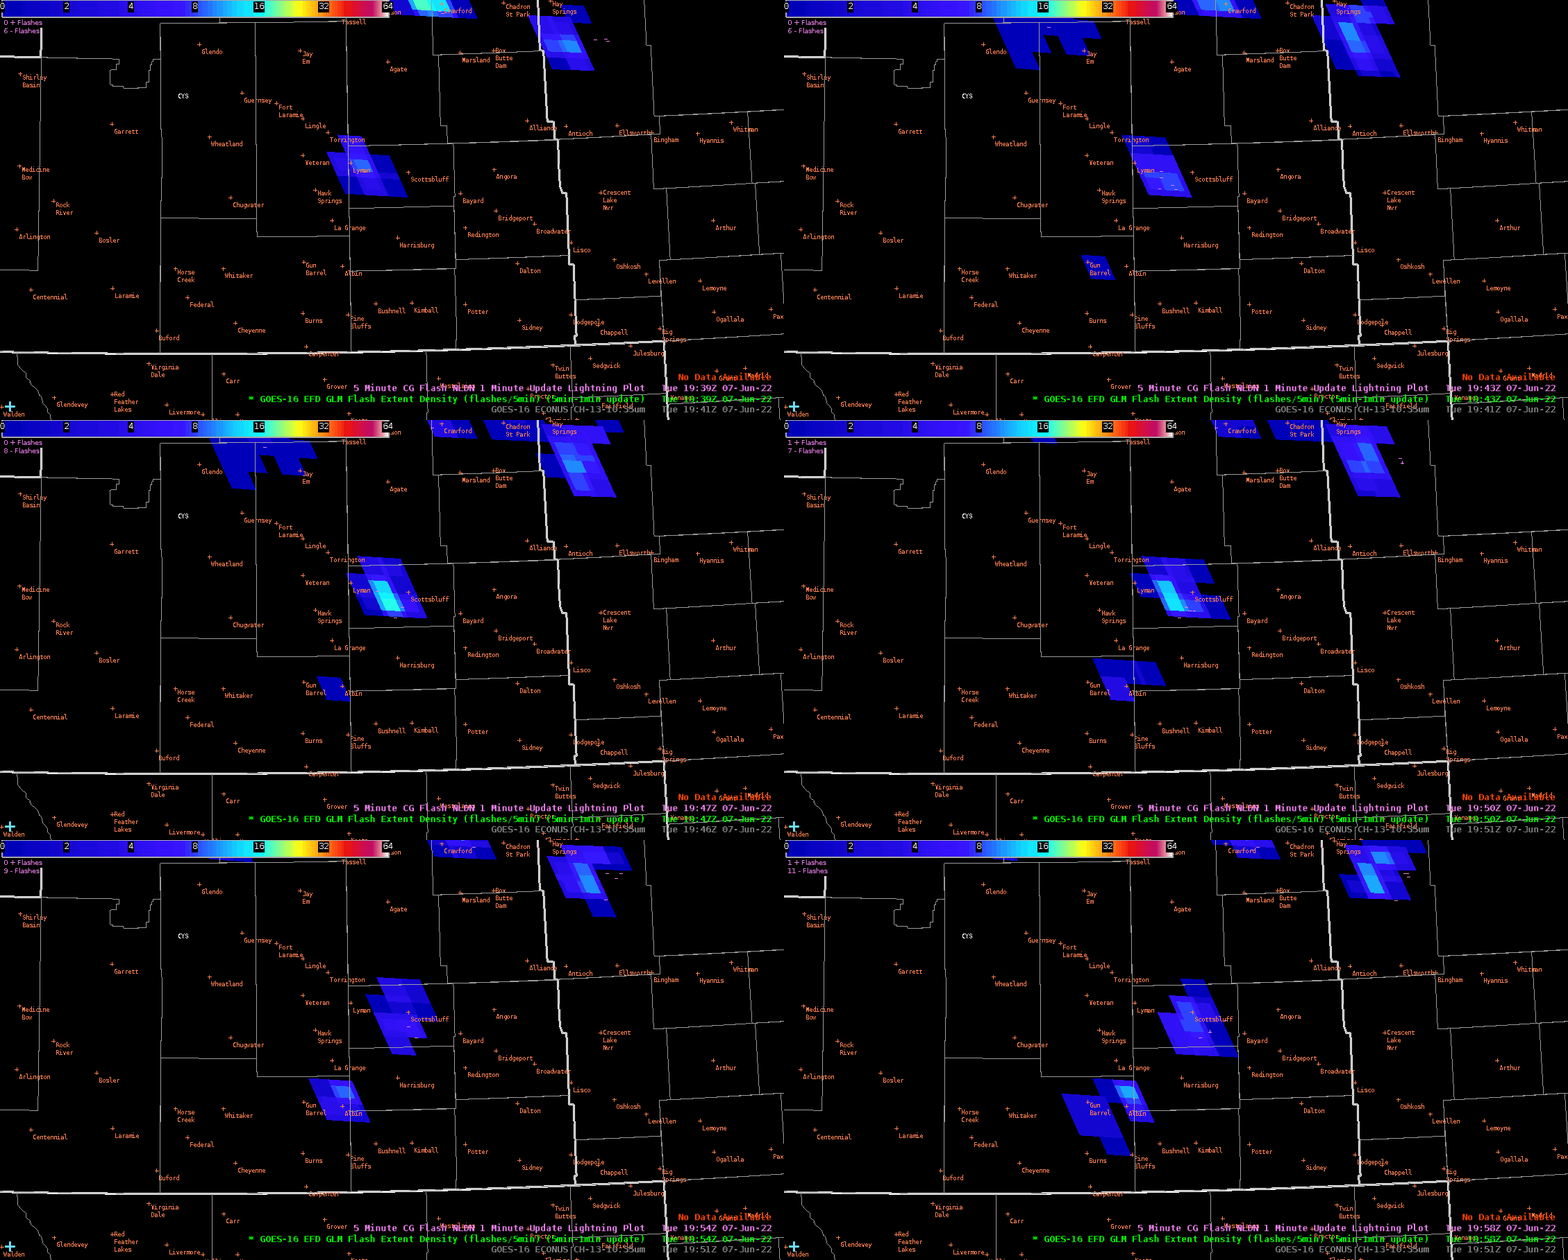
GOES-16 GLM FED Scottsbluff

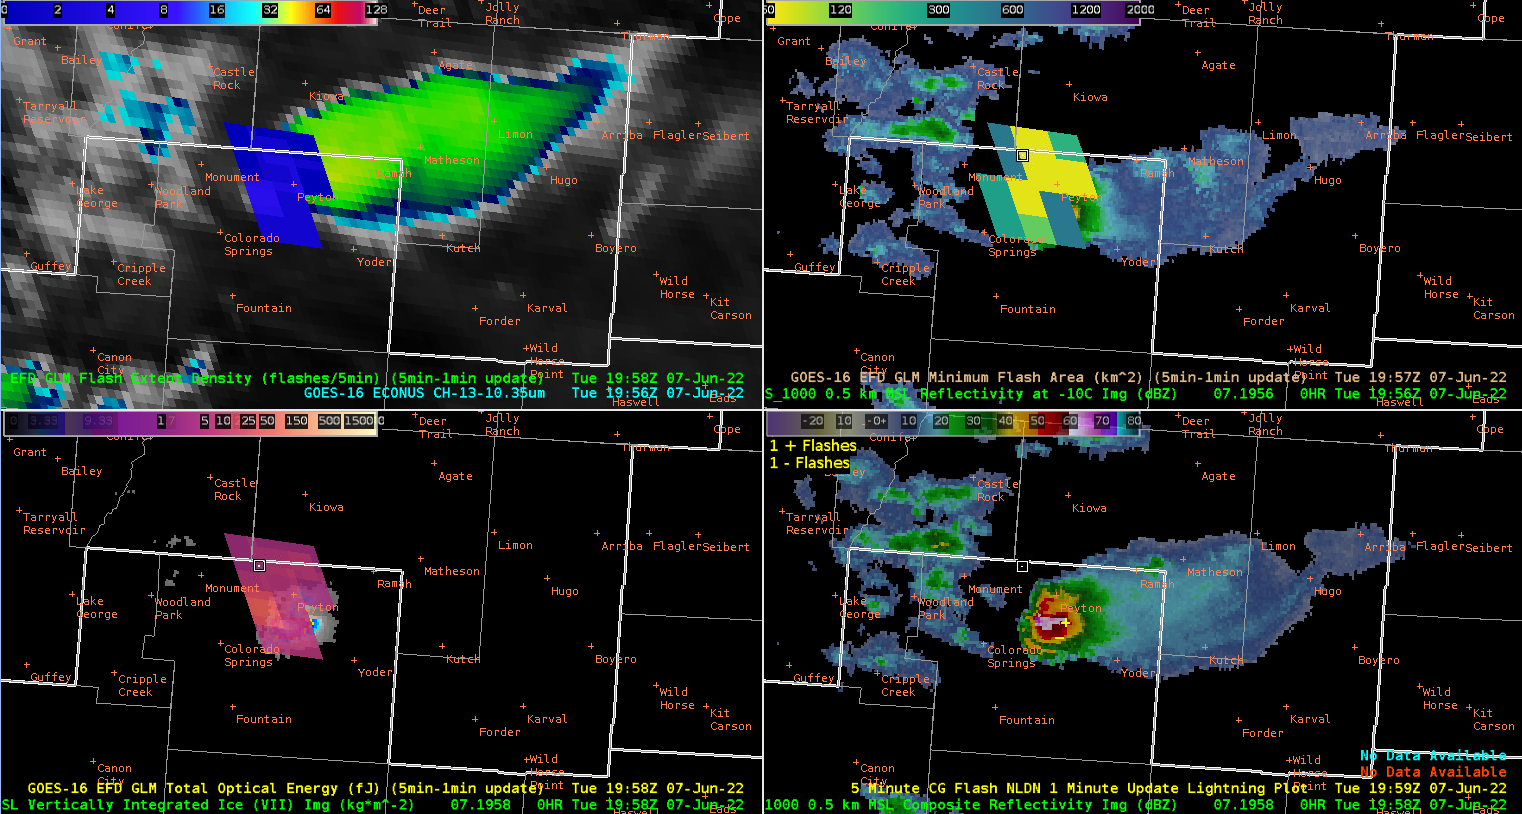
The next three examples show sharp contrasting GLM FED intensities between GOES-17 and GOES-16 through the afternoon of June 7th. This first example focuses on a warned supercell just southeast of Scottsbluff, NE at 2022Z. The first image shows FED from GOES-17 showing much higher FED numbers, while the second image shows FED from GOES-16 not indicating any increased lightning activity. The third image shows a 4-panel layout of MRMS, MESH, VIL, and ProbSevere version 3 all supporting a supercell occurring. A subsequent report of 1.5” hail was observed from this warned storm.

The cause of this was shared from the investigators running the HWT this week, that GOES-17 had the better angle to see lightning activity in these supercells developing over the high plains of WY and NE. Whereas GOES-16’s perspective from further east had to punch through spreading anvils downstream of the main updraft that likely obscured the light emanating from the lightning, GOES-17 had a more side-on view of the updraft with less to no obscurations of light emanating from lightning occurring in the updraft. Unfortunately, GOES-17 CONUS view and the day’s mesosector from GOES-17 did not reach this far east and there are no satellite images displaying the different parallax views from GOES-16 and GOES-17.

GOES 17 GLM FED @ 2022Z “Scottsbluff Cell”

GOES 16 GLM FED @ 2022Z

MRMS - MESH - VIL - PROBSEVEREv3 @ 2022Z

1.5” hail report from this storm. Max MESH reached 2”.

The next two examples below each showcase three images each, a GOES-17 FED showing higher intensity lightning activity, a GOES-16 FED missing the higher intensity lightning activity, and a 4-panel layout showing MRMS, MESH, VIL, and ProbSevere version 3 highlighting the severe nature of the supercell.

An interesting follow-up to this in the future is to see how these two satellite GLM FED products compare in a low-storm motion environment where the spreading anvils at storm top flow in all directions. This could cause both satellites to have an obscured view of the convective updraft beneath, causing both to miss out on any increased lightning activity.

GOES-17 GLM FED @ 2016Z “Lance Creek Cell”

GOES-16 GLM FED @ 2016Z “Lance Creek Cell”

MRMS - MESH - VIL - PROBSEVEREv3 @ 2016Z

GOES-17 GLM FED @ 2026Z “Scottsbluff Cell”

GOES-16 GLM FED @ 2026Z “Scottsbluff Cell”

MRMS - MESH - VIL - PROBSEVEREv3 @ 2026Z “Scottsbluff Cell”

- Trip


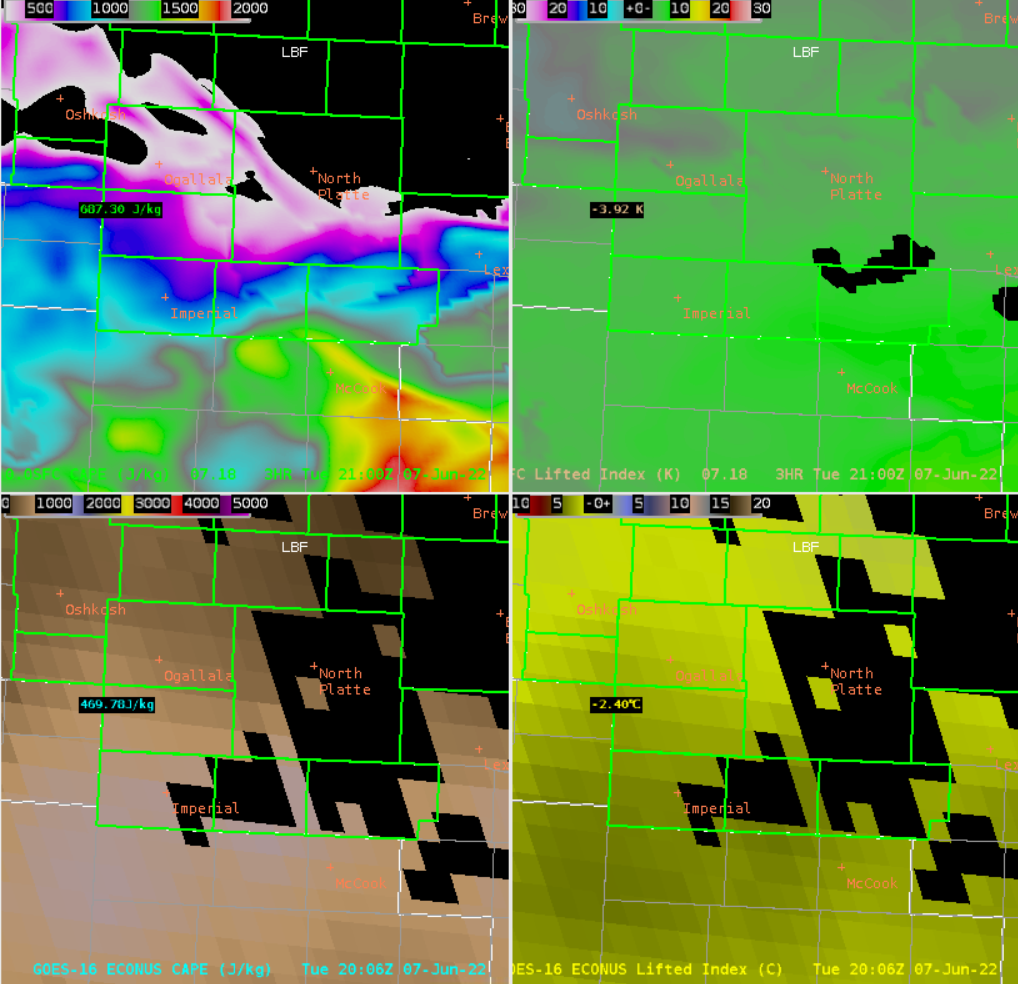
Day Cloud Phase Boundary noted on PHS CAPE forecast

A notable boundary seen over the southern CWA of LBF on GOES 16 Day Cloud Phase Distinction is also evident in the PHS CAPE forecast for 19-21Z over the same area. The evolution of this boundary could be key in determining future convective development later this afternoon/evening. 

Day Cloud Phase Distinction 20Z

SFC CAPE PHS for 21Z forecast, top left panel.


Meteorologist David Spritz

Tuesday, June 7, 2022

Cherry County Storm

A storm in Cherry County, NE was moving southeast, in an environment characterized by very high effective shear (70 kt) and lower MLCAPE (700 J/kg). ProbSevere v3 (PSv3) was maintaining a higher probability of severe than v2 (by about 20%). This is likely due to version 2's over-reliance on ENI lightning data. In this case, the storm was very lightning deficient. However, the PSv3 models were able to overcome the dearth of lightning with all of the other data that it uses. The ML models of PSv3 do this better than those of v2. This is just another example of why using fused observations and datasets really help optimize your use of the data.

Figure 1: ProbSevere v3, MRMS MergedRef, and NWS severe thunderstorm warning for a storm entering Cherry Co., Nebraska.


Scottsbluff storm

ProbSevere v3 (PSv3) has shown a consistently higher signal than ProbSevere v2 (PSv2) on storm near Scottsbluff, NE. PSv3 was 20-40% higher during the development stage and as it matured. PSv3 also had consistently (and correctly) lower tornado probabilities than PSv2. The elevated tornado probabilities was likely a result of very high MRMS azimuthal shear, which was a result of sidelobe contamination. In this case, ProbTor v3 correctly didn't emphasize the azimuthal shear as much as PTv2. ProbHail v3 has been the highest hazard probability, whereas ProbWind v2 was the highest for version 2. One forecaster noted that v3 is definitely picking up on the hail threat better than v2. Hail up to the size of 1.5"-diameter has been reported thus far. Forecasters have noted that the higher PSv3 values seems to correlate better with their expectations of the storm.

Figure 1: ProbSevere v3, MRMS MergedRef, and NWS severe weather warnings for a storm near Scottsbluff, NE. 


CI in the Mississippi Valley

While our HWT forecasters are getting set up in the High Plains today, I wanted to note that LightningCast picked up on convective initiation nicely along a stationary boundary in the mid-Mississippi Valley. While LightningCast can still provide good performance in the presence of overlapping cirrus, it often works best when there is an unobscured view of developing cumulus clouds. In this case, there was lead-time ranging from 15 to 50 minutes prior to the first flash in various cells (measured from the 25% threshold).