LightningCast
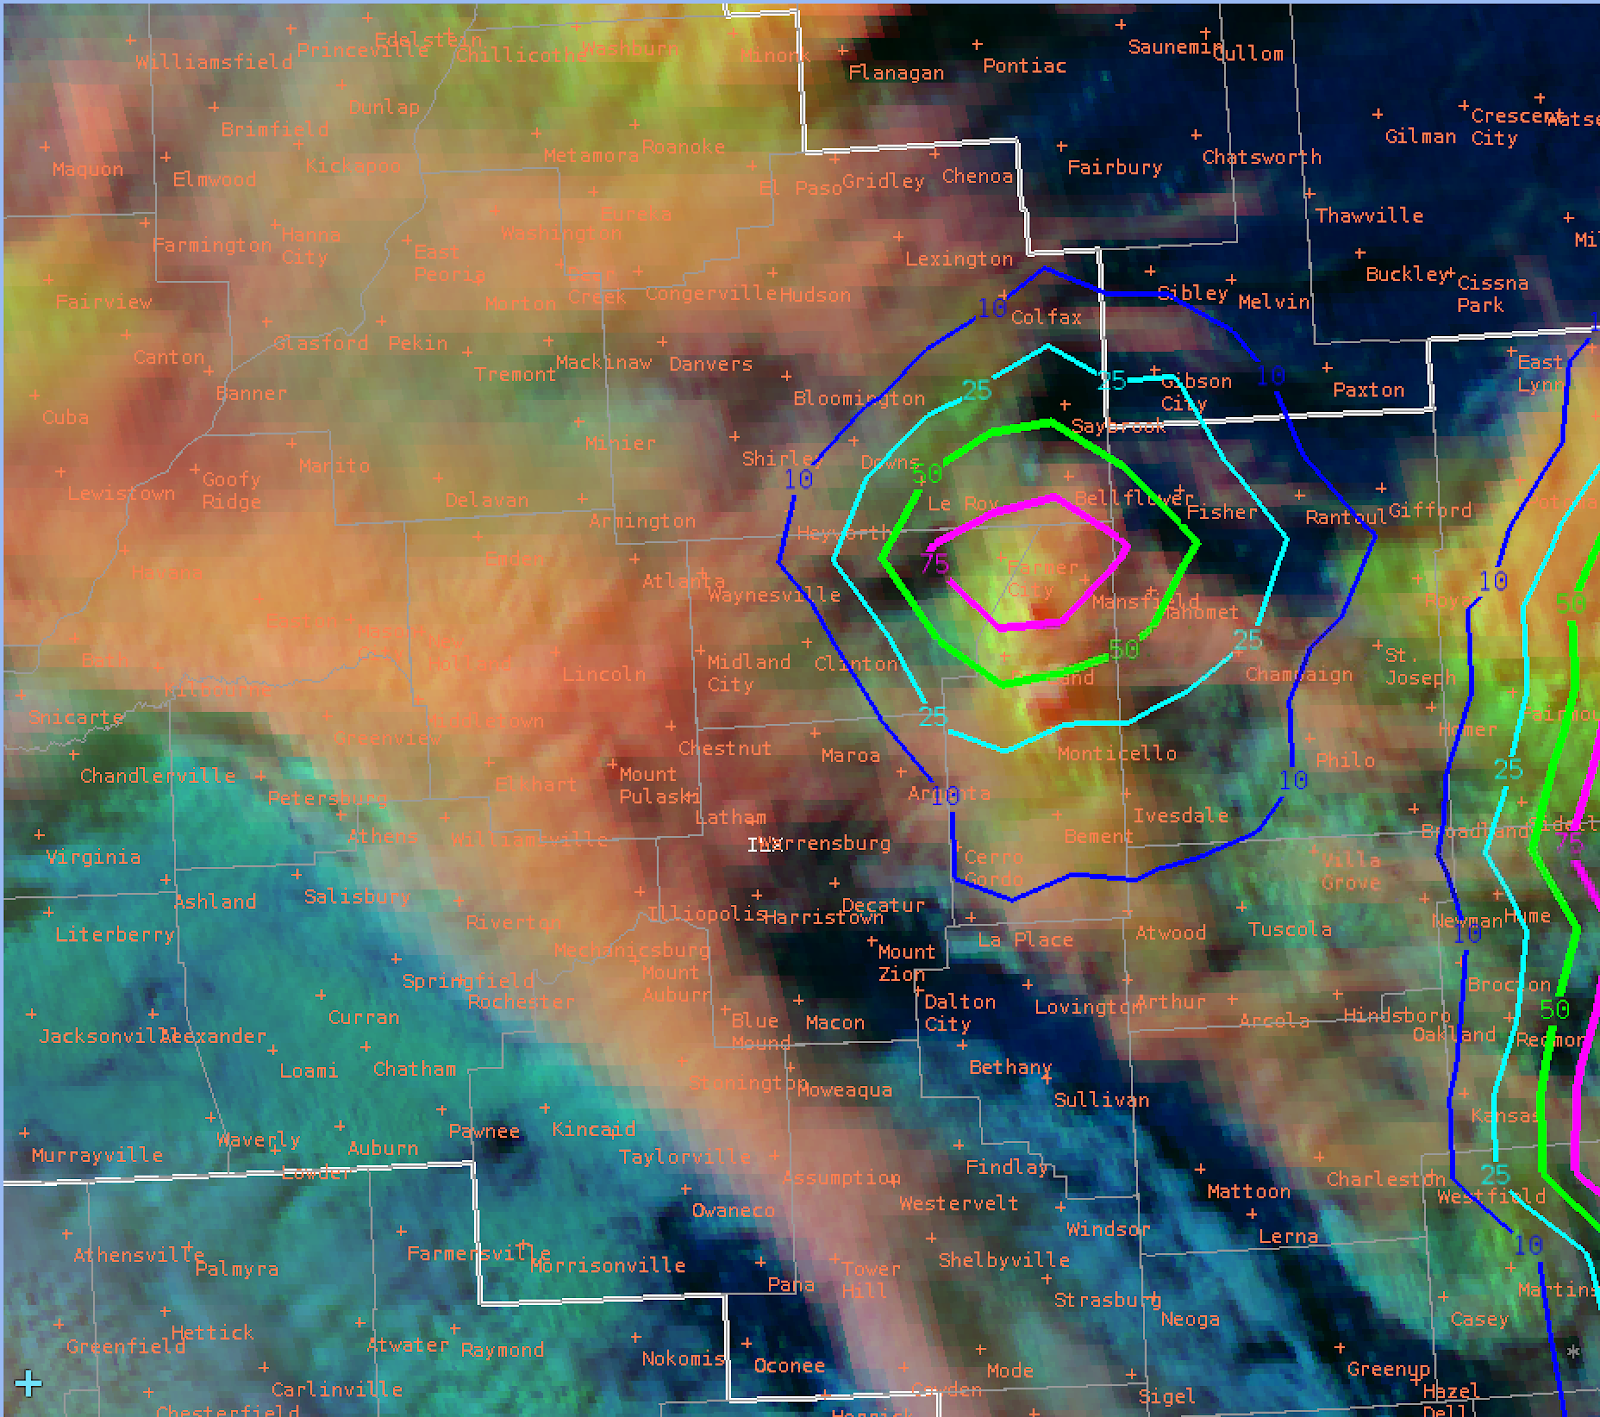
Immediately after coming online, there was the potential for heavy showers in my area of concern and a storm heading toward an established DSS Event. Initially, LightningCast showed a 50%-75% chance of lightning within the next hour, but this was monitored in successive frames as the trend continued downward.
This product gave me the situational awareness to immediately know that I should be interrogating a storm heading toward my DSS event without an in-depth analysis across multiple radar/satellite products. I continued to monitor the product as I got the rest of my AWIPS setup and I noticed the downward trend continued for my storm of concern. This simple display along with GLM flash data (on a 0-50 scale for this storm mode) gave me confidence in analyzing this as a low-end threat. This has an application in the operational shift change where a new forecaster can have two simple products loaded on a screen with rapid updates indicating that a DSS area is increasing or decreasing its likelihood of seeing lightning within the next hour. These two products in tandem are not only useful operationally, but as a base situational awareness tool.
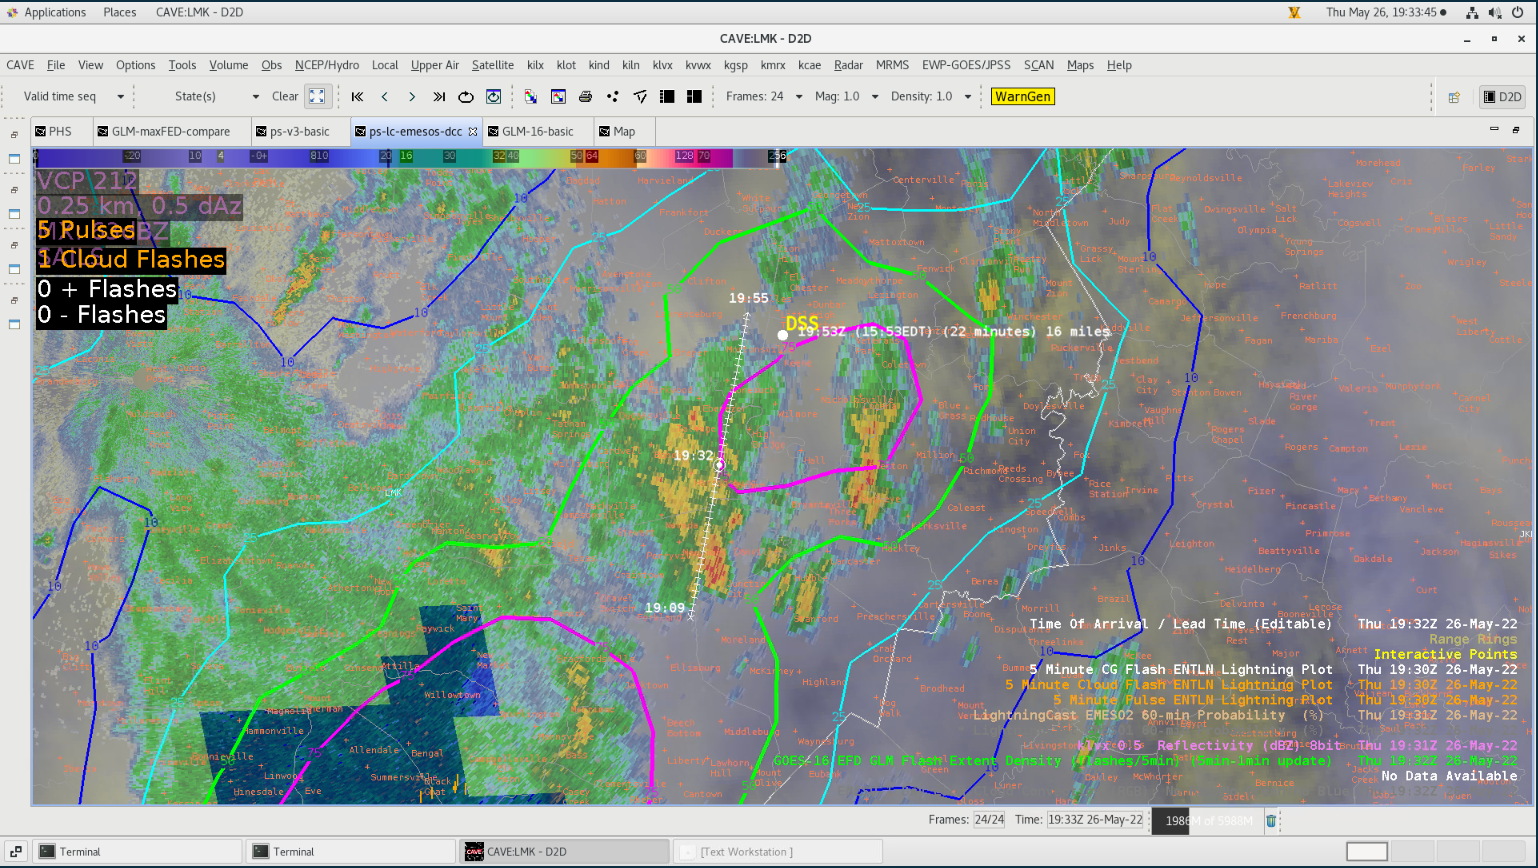
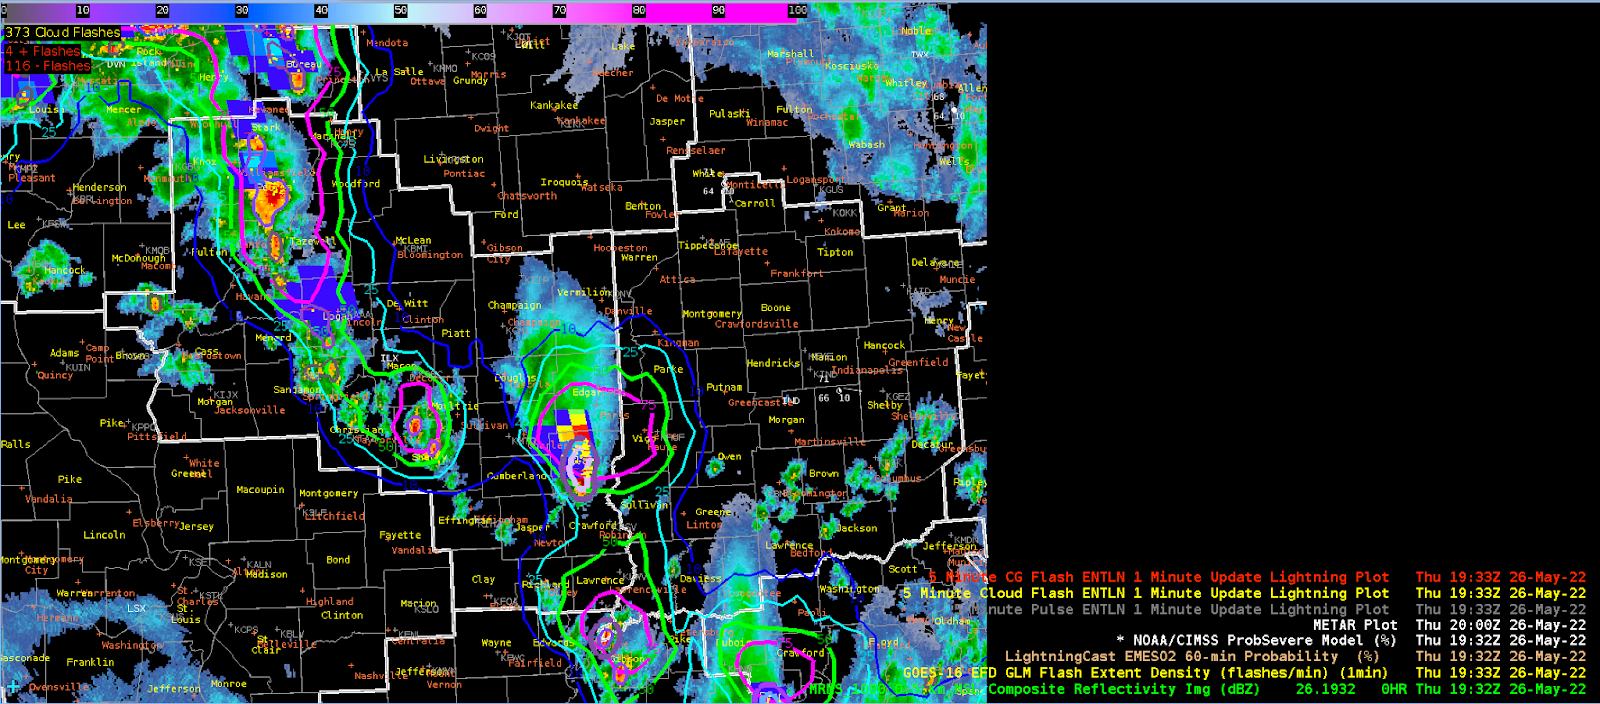
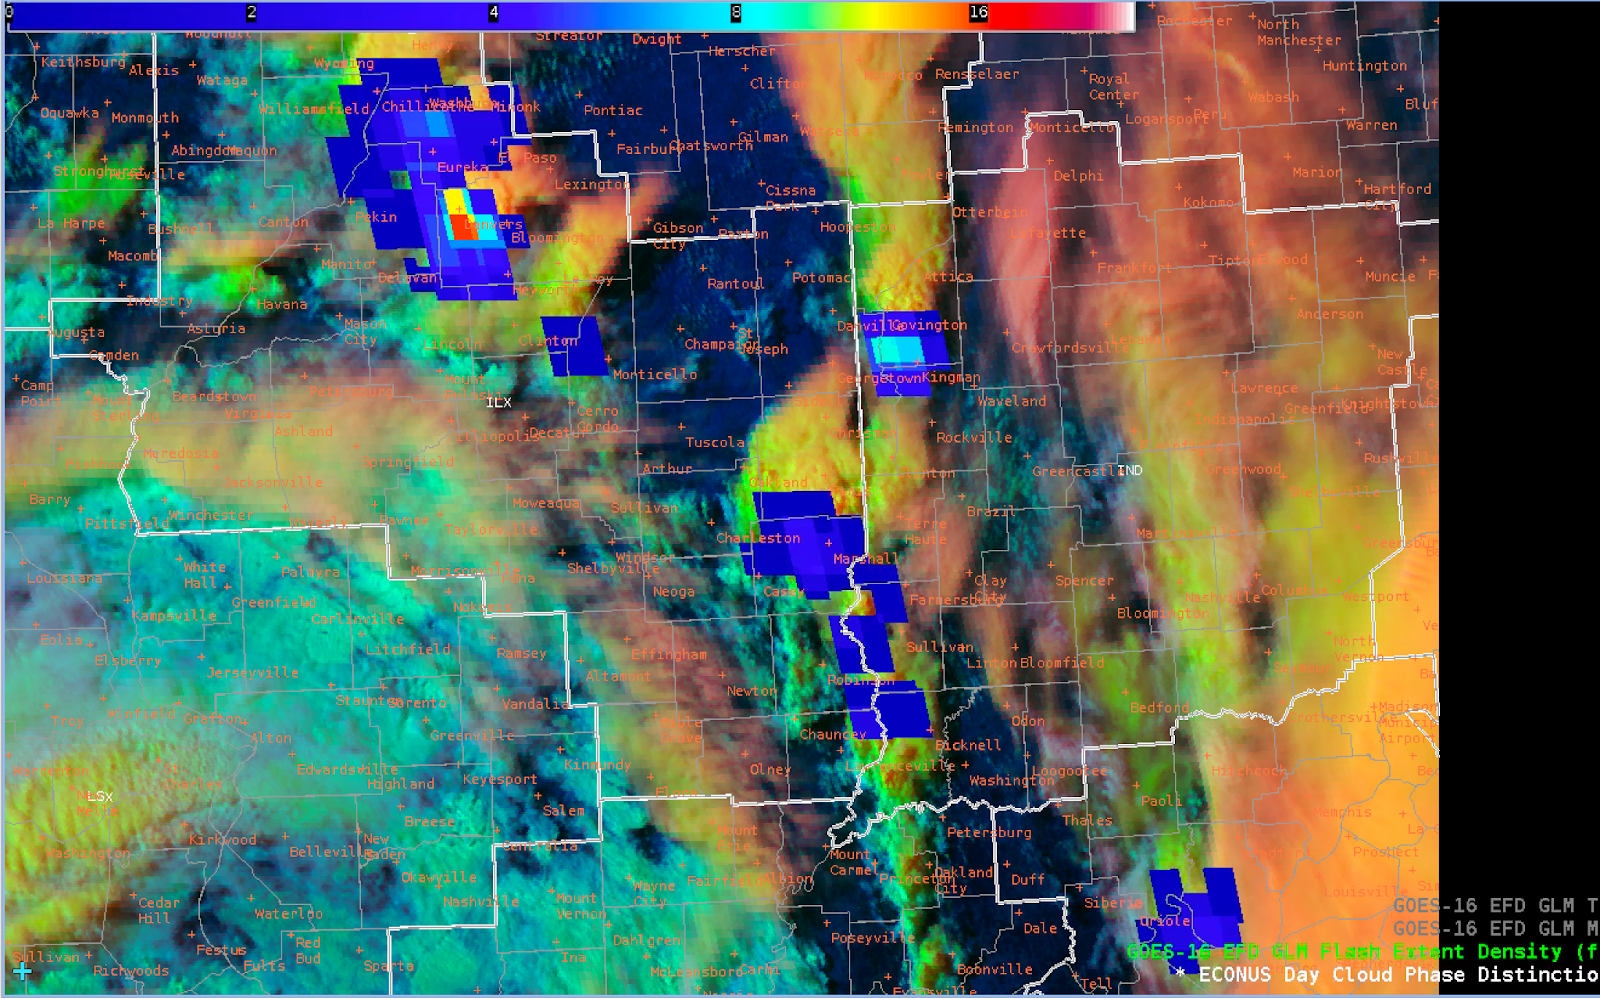
Initial LightingCast/GLM view of the storm moving toward the DSS event area.
Visually the trend decreased after this initial probability. It would be very useful to have these plots available in AWIPS to view the increasing/decreasing probabilities associated with perceived storm growth and decay.
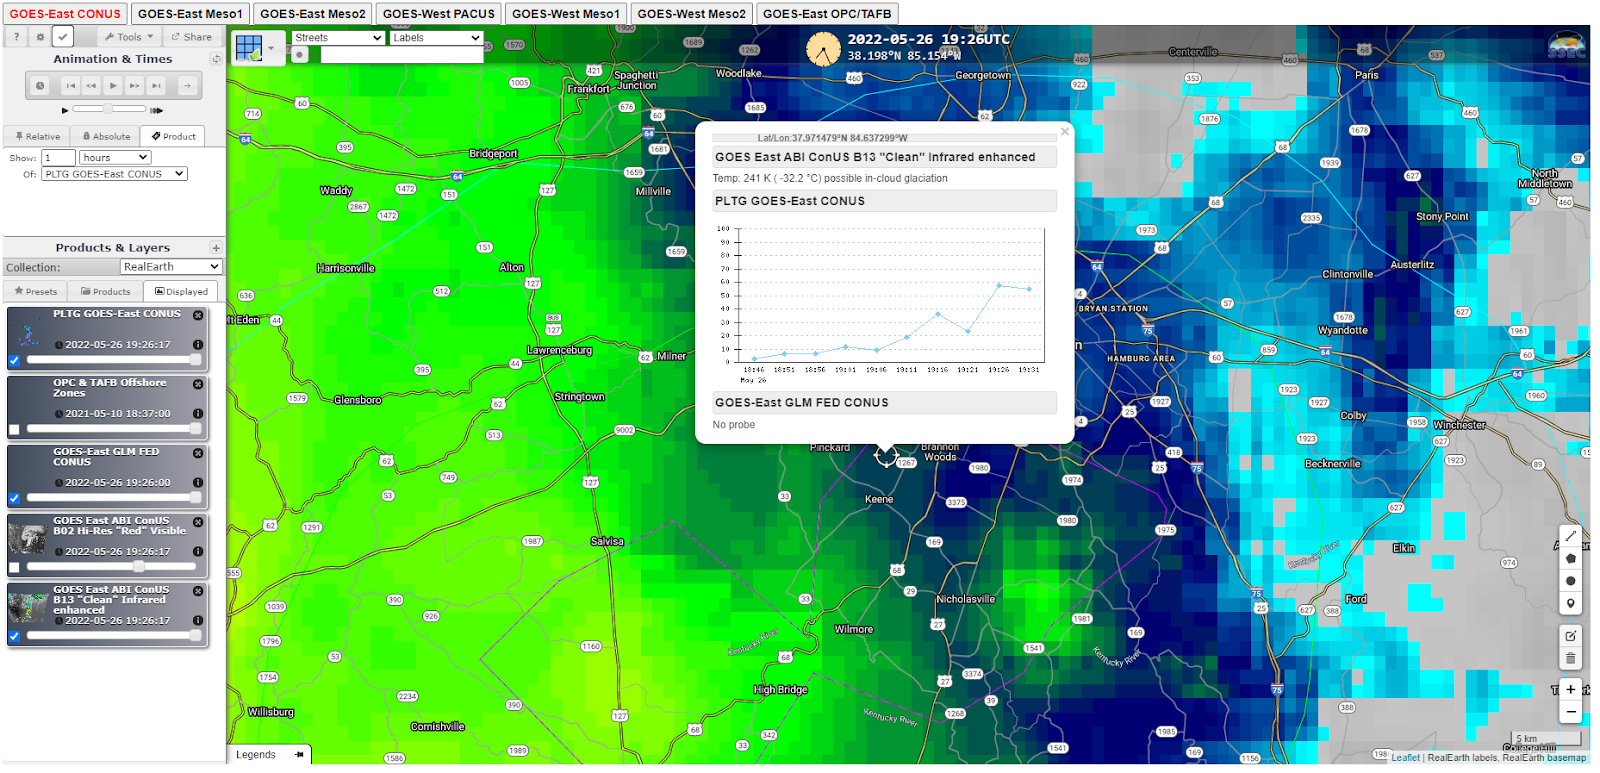
After the initial spike (which occurred as I was logging on), you can see that with no observed strikes and the probabilities staying constant, there was no initial concern.
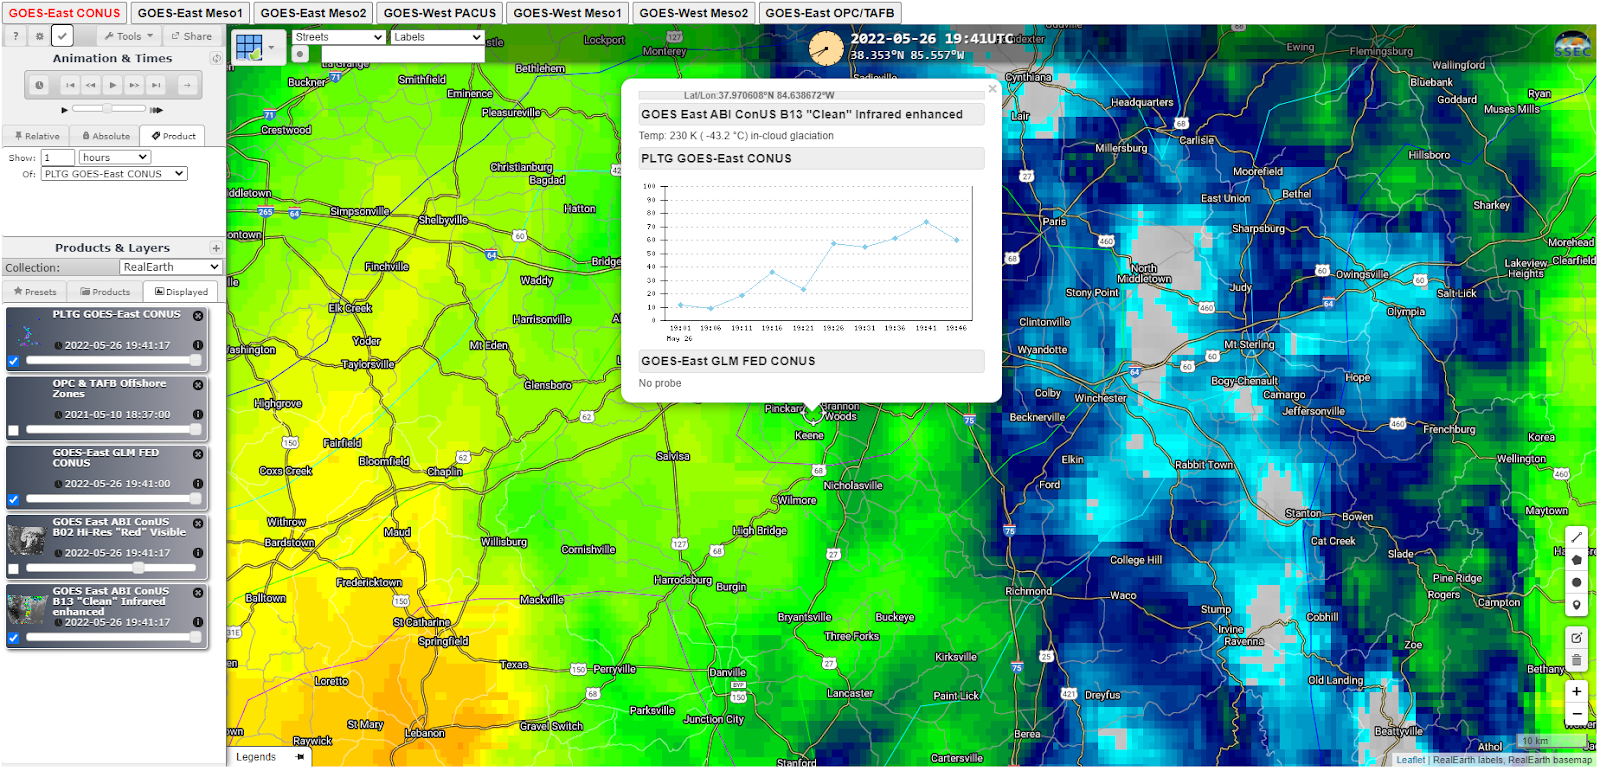
The trend continued with a subsequent steady decrease in probability.
Another storm the south became the main concern with a Significant Weather Advisory (SPS) issued for its growth and subsequent wind threat. In this case, I think LightingCast is doing a good job at highlighting the advection and limiting the probabilities over my area based on its current (pictured) motion.
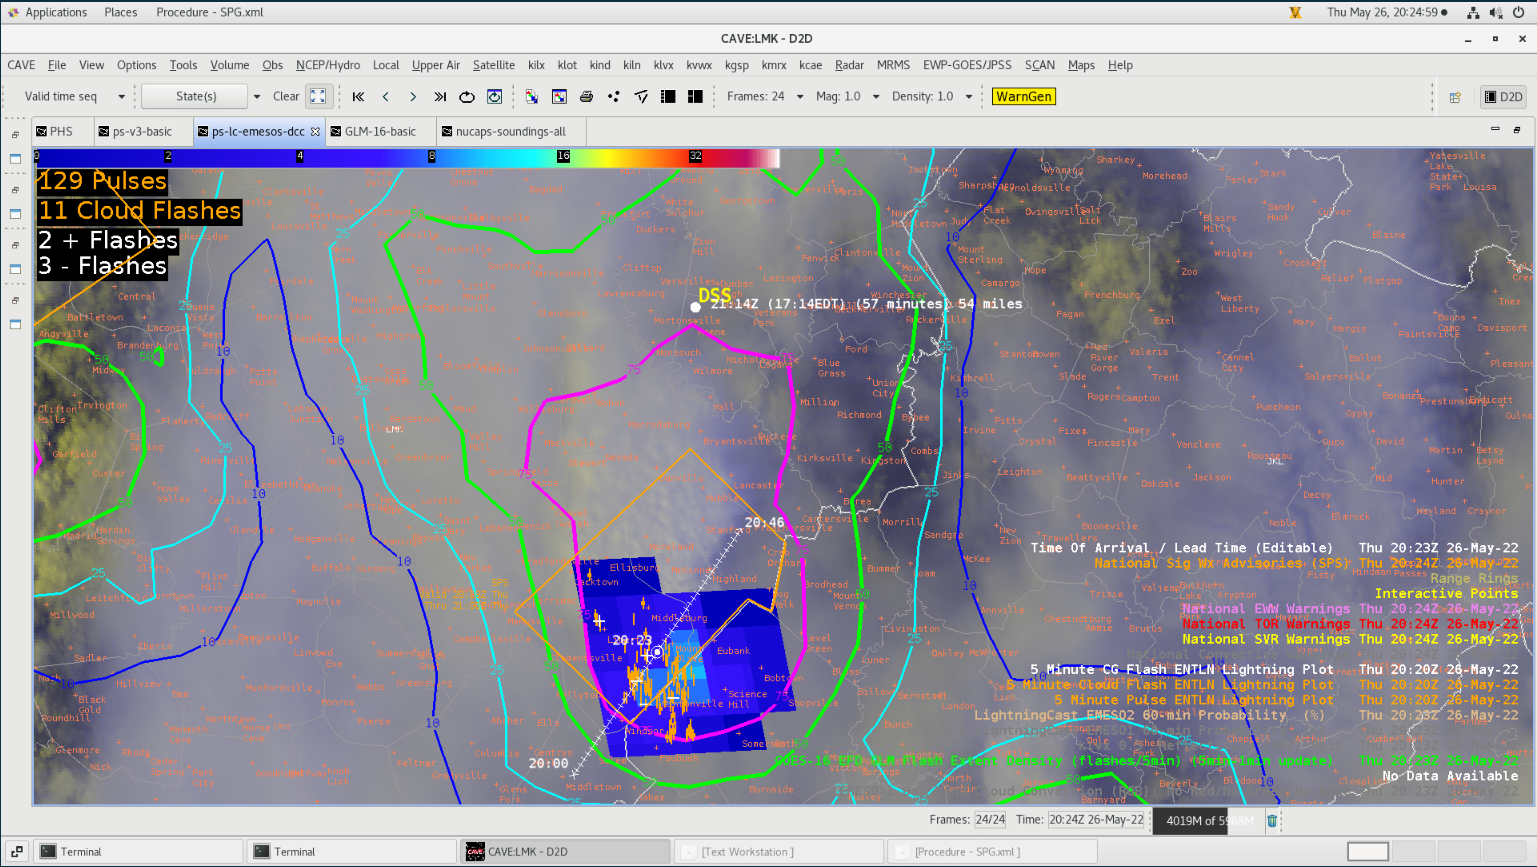
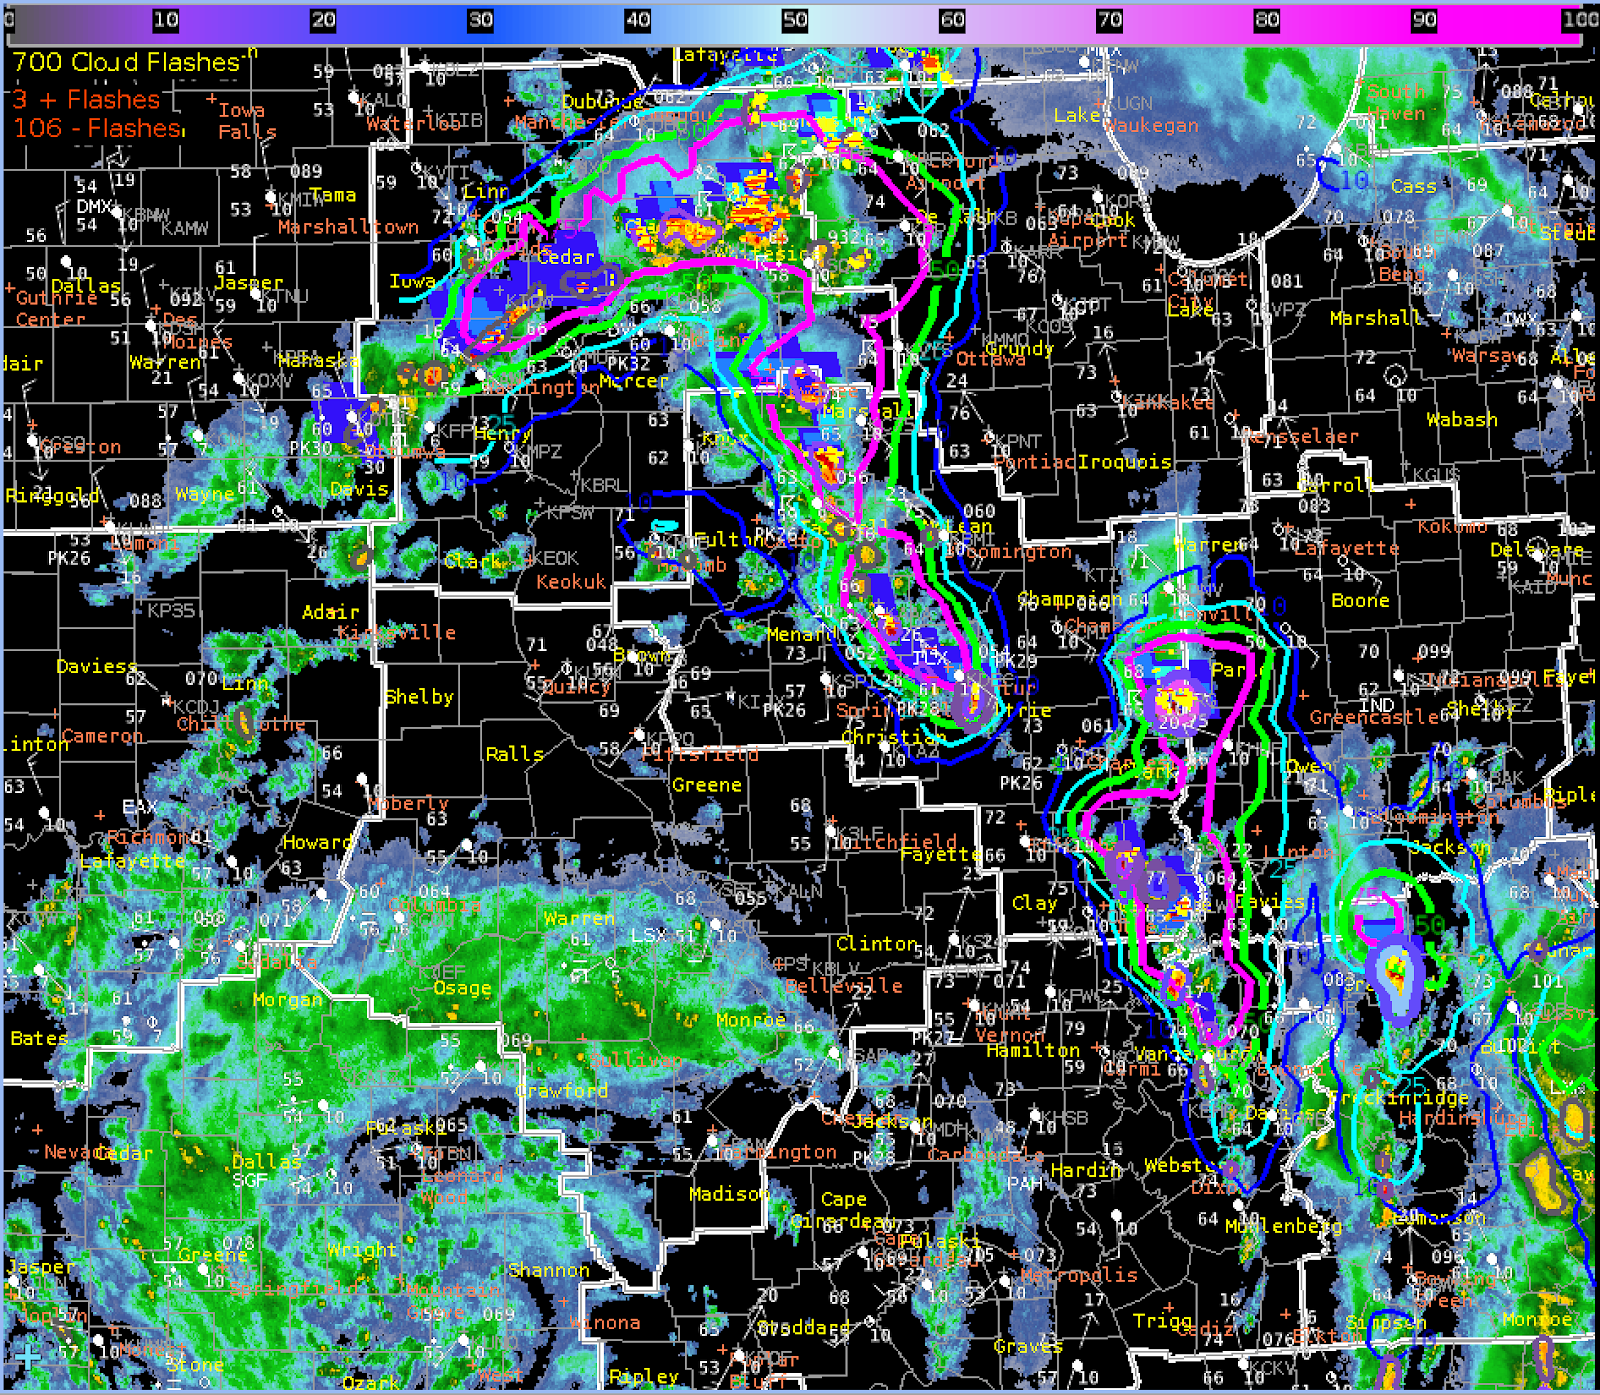
LightningCast and GLM plotted with a current storm motion and Time of Arrival tool to show that it is expected to miss the DSS event at this current time. However LightningCast did put the area in the 75% contour at 20:26Z
Our DSS event was impacted by a separate storm just north of this main storm at 20:33Z. There were no cloud flashes ahead of the CG strike and LightningCast did a good job of highlighting the area as potential increased at 20:26Z, but this was only a lead time of 7 minutes. After this observed CG strike, LightningCast dropped the probabilities to around 50% despite observed strikes occurring within the previously outlined 75% area. Thick clouds around the area from previous and advancing convection were observed over the entire area.
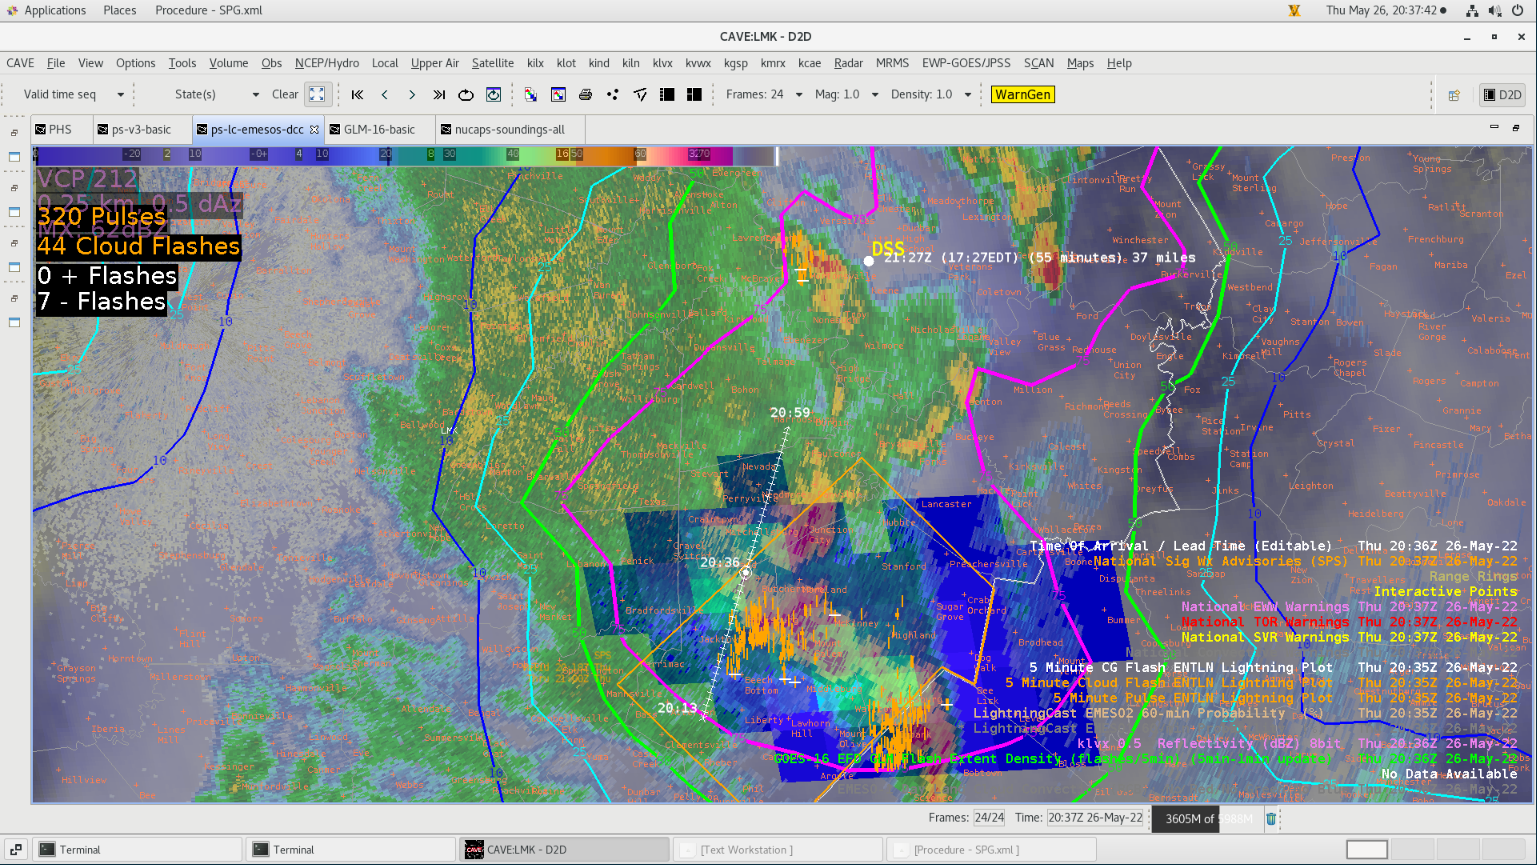
Lightning has been observed near the DSS Event ahead of any observed cloud flashes at 20:33Z. LightningCast only gave a 7-minute lead time with this quick-pulsing storm.
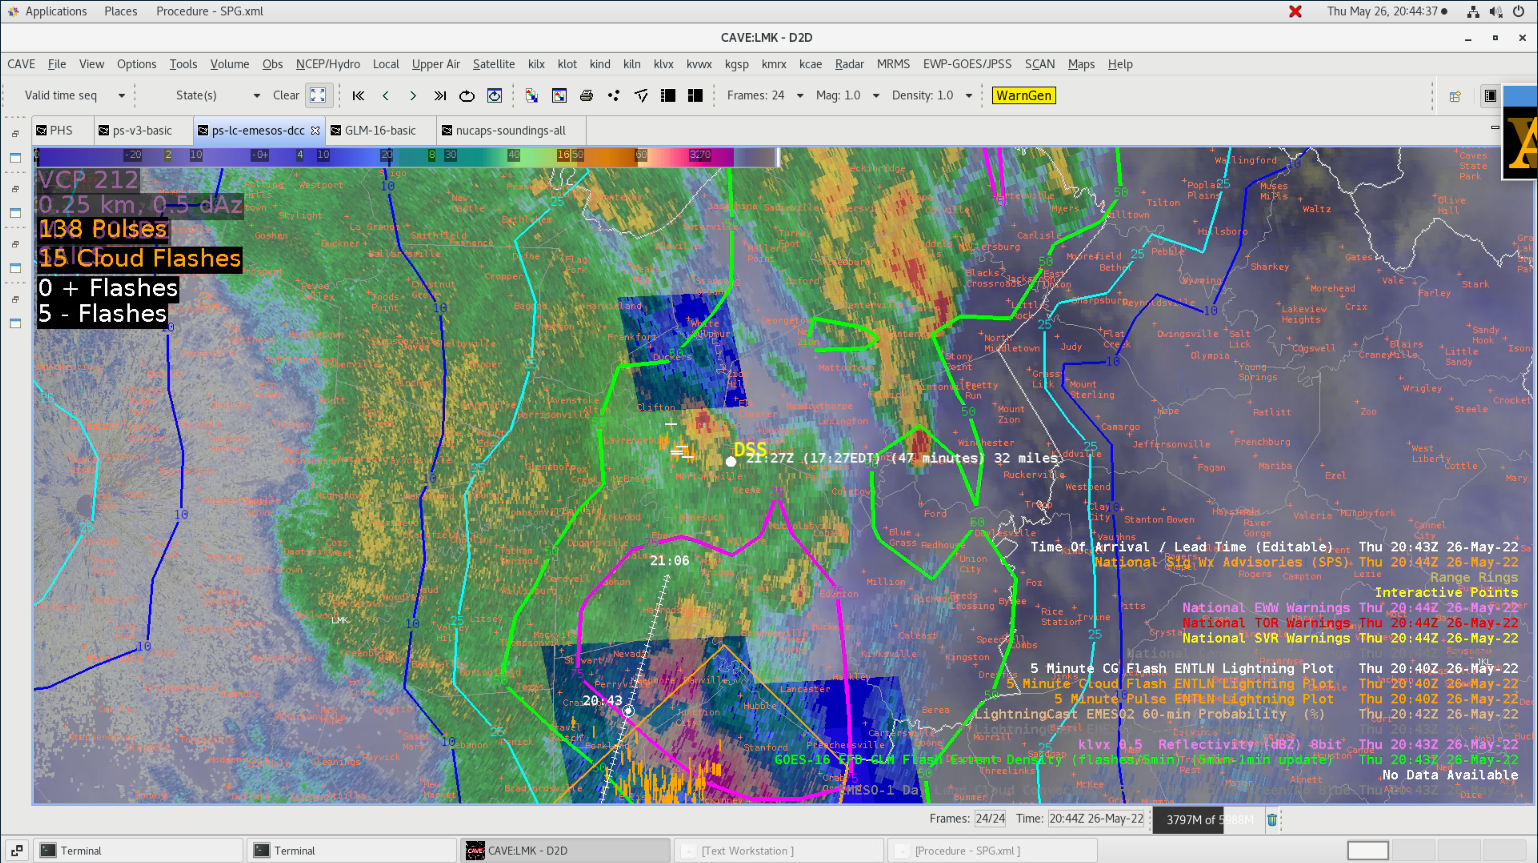
With lightning ongoing and observed within the 75% contour,, LightningCast dropped the probabilities to ~50% at 20:45Z.
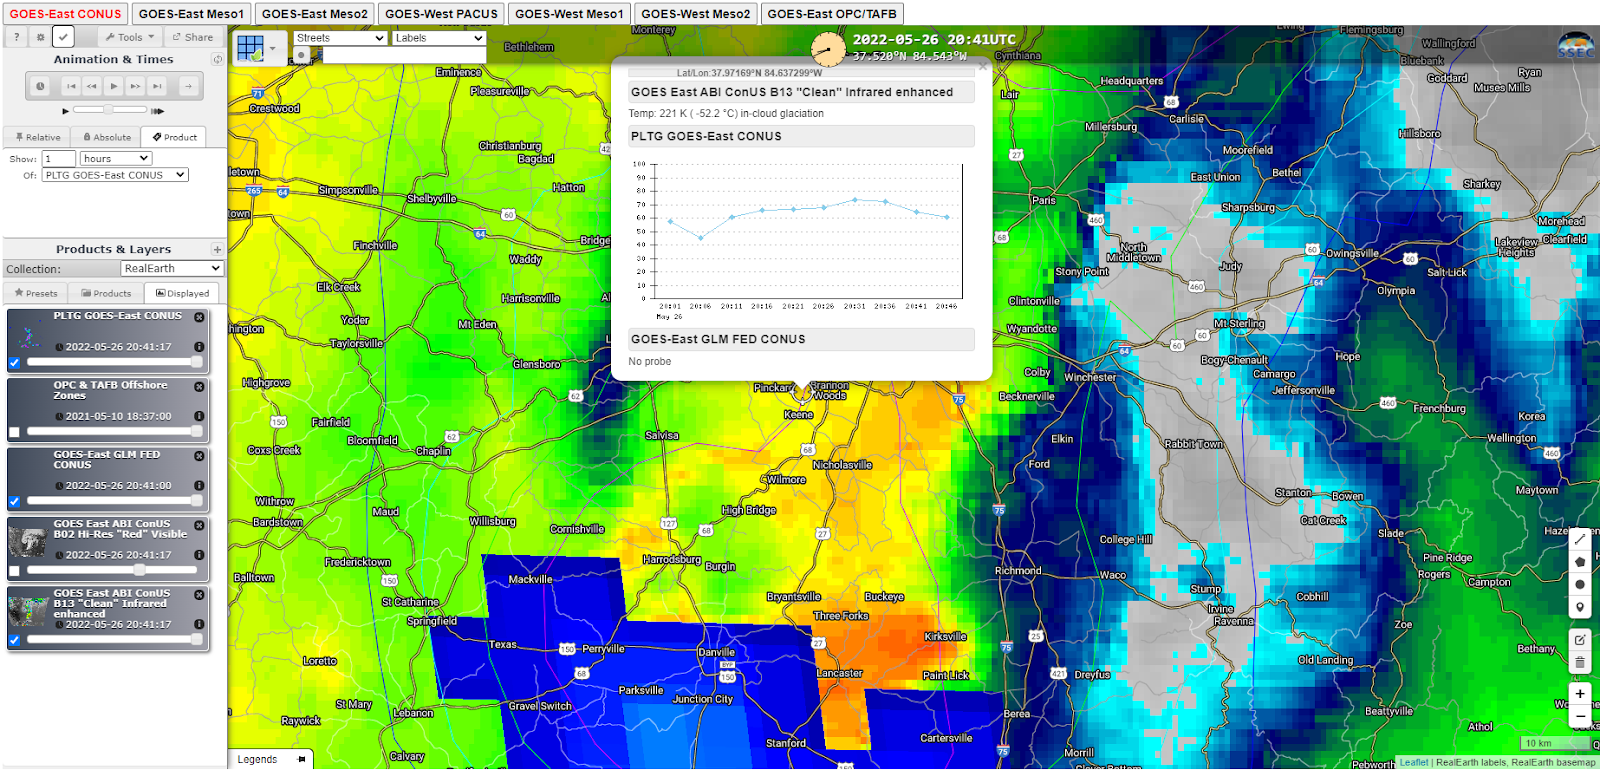
This was the LightningCast trend at the time of ongoing, observed, lightning.
The trend remained steady after the lightning was observed and continued through the next couple of hours as the storm following this one weakened and moved over the DSS event area.
GLM
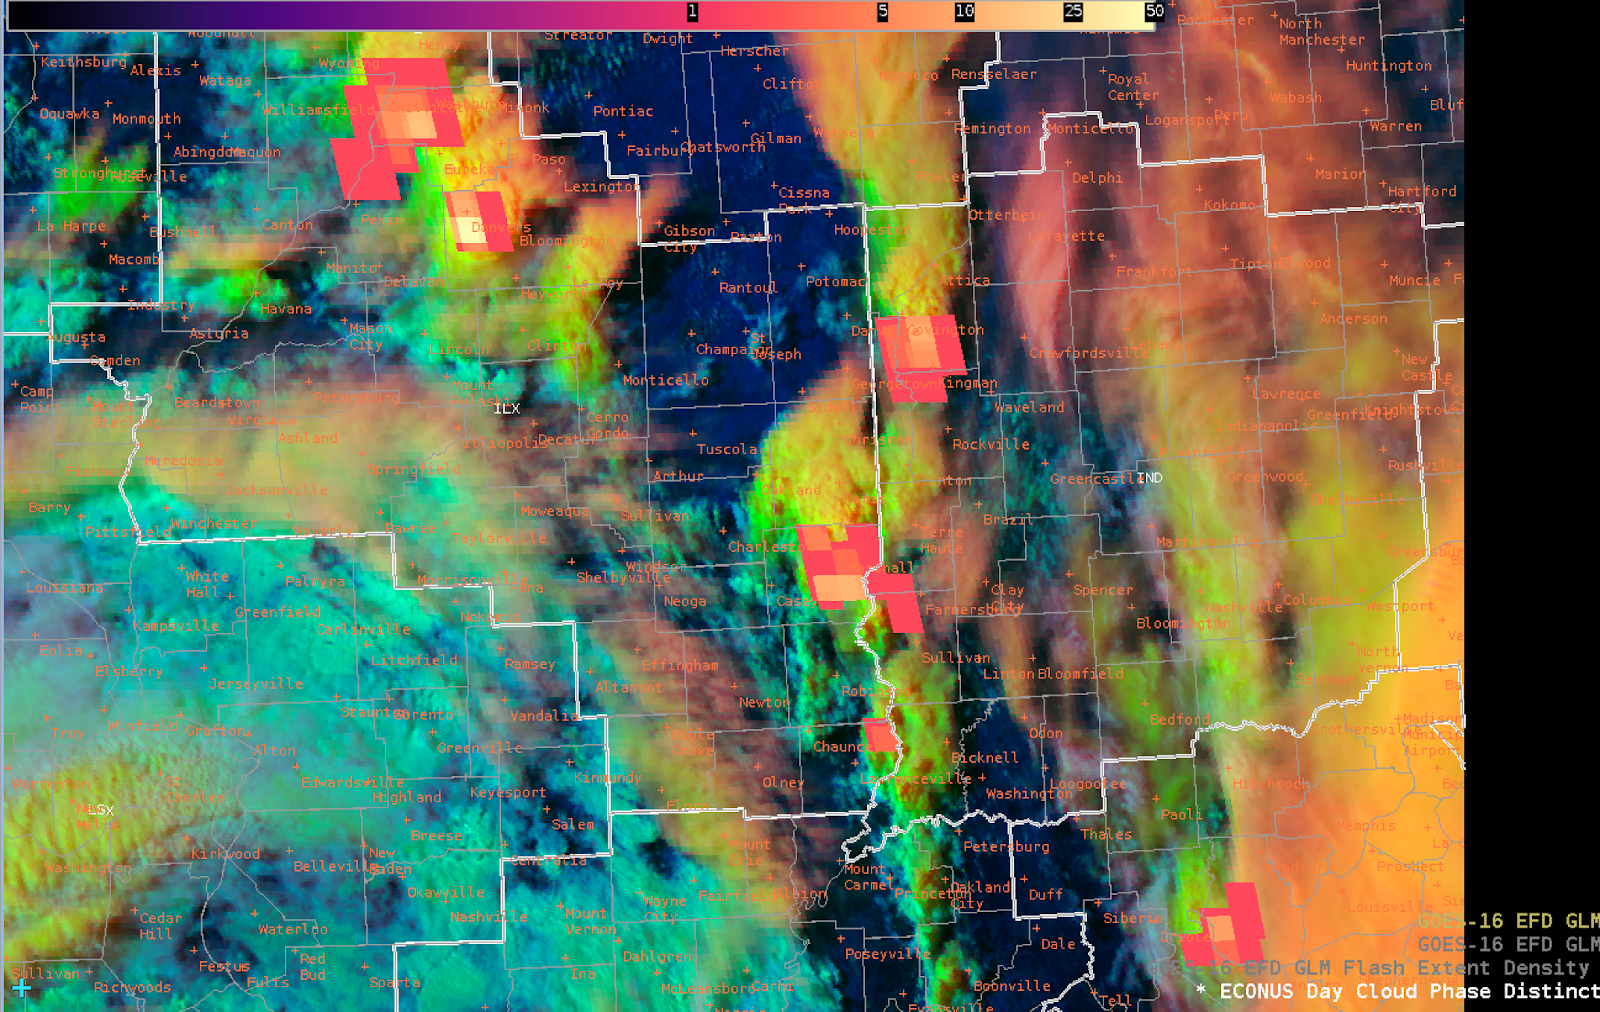
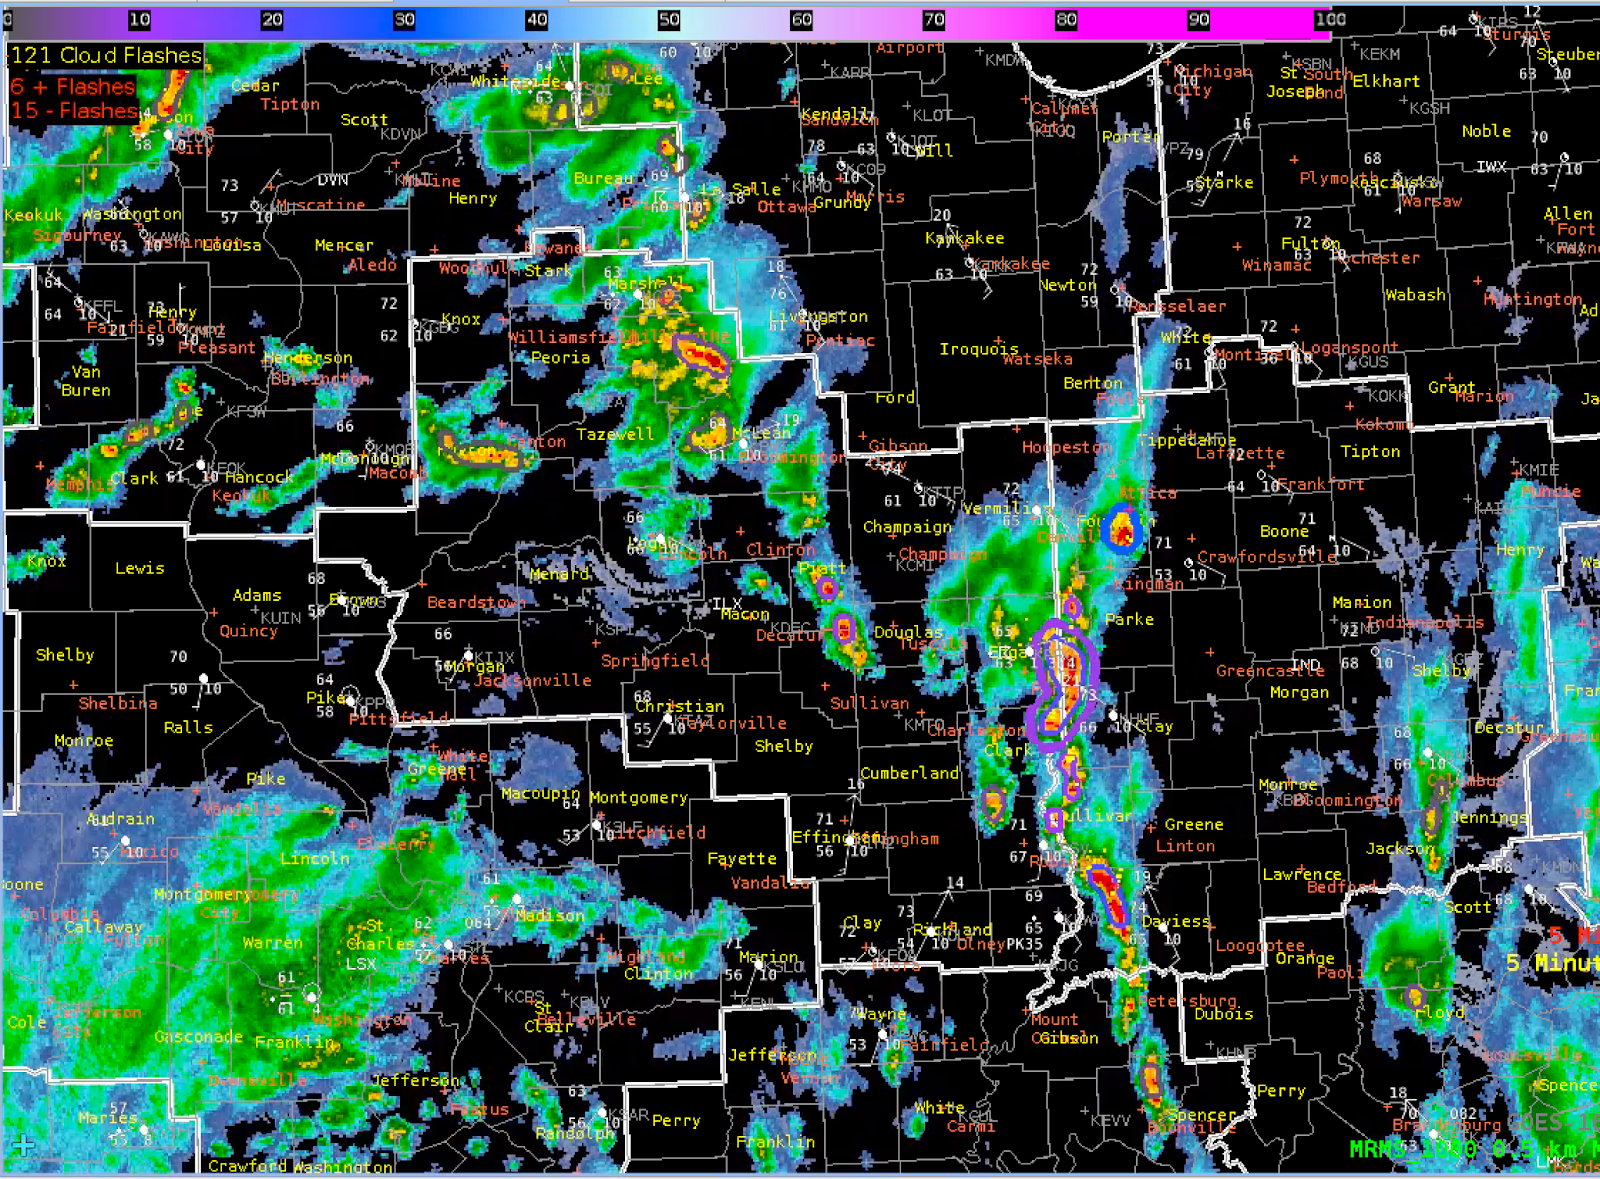
GLM performed quite well over the area today, especially as the storms were strengthening. The MFA and FED were again useful in identifying potentially stronger storms and where to focus my attention. This was again useful outside of supercellular convection. I was surprised with how well GLM performed with dense cloud cover from ongoing convection to the south and debris clouds left over from convection earlier in the day.
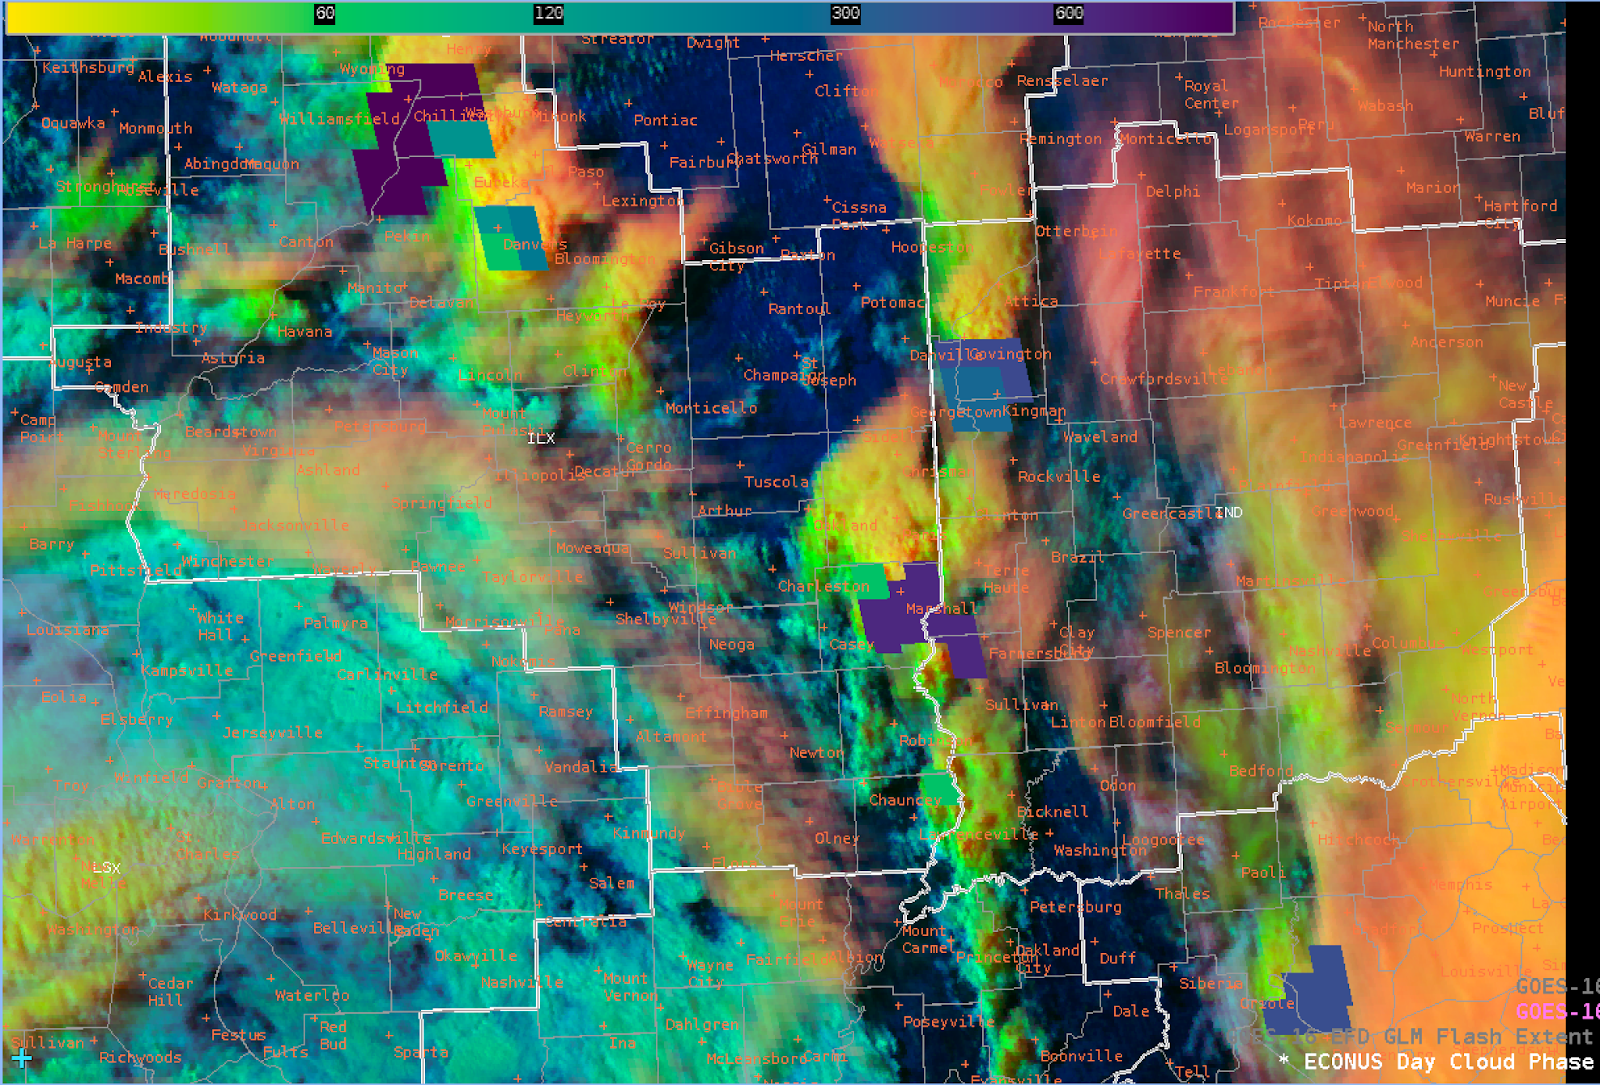
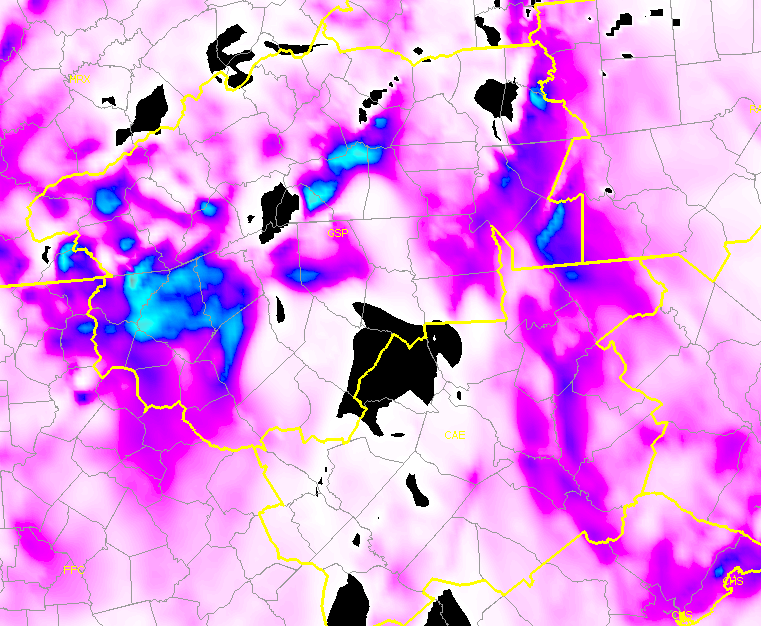
In dense cloud cover, MFA and FED were able to recognize an area of convection pulsing once it left my DSS event area. This could be useful in a similar situation where the organizer of an event recognizes increased lightning in their area and is looking to return to operations (most of the EMs and organizers have lightning notifications from several ground-based detection networks and frequently interrogate us about ongoing trends). I would be able to use this as a tool to see that lightning near the event is a continued concern because of potential backbuilding around a strengthening storm.
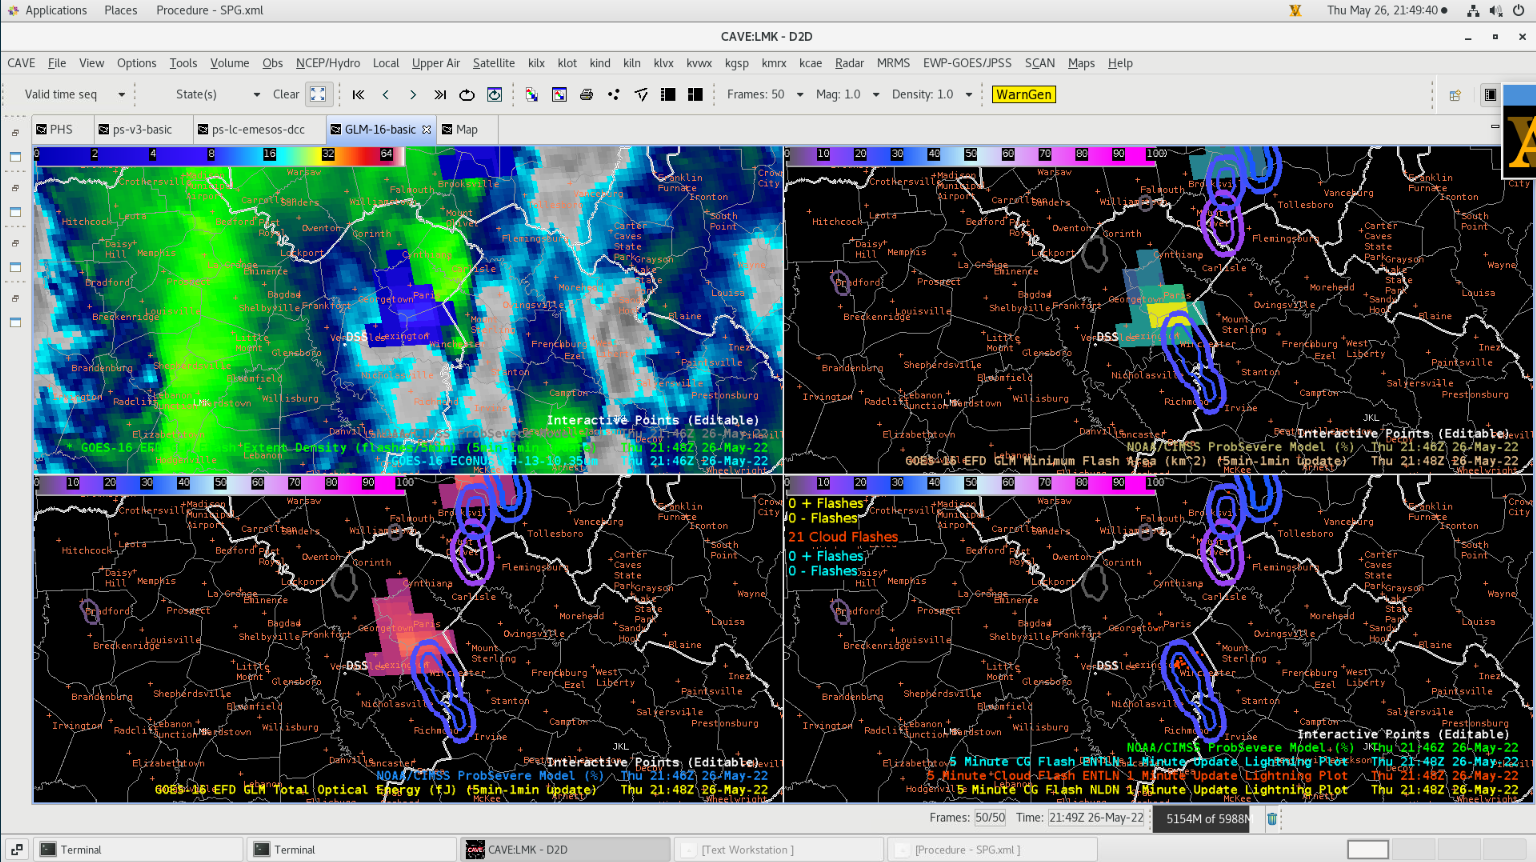
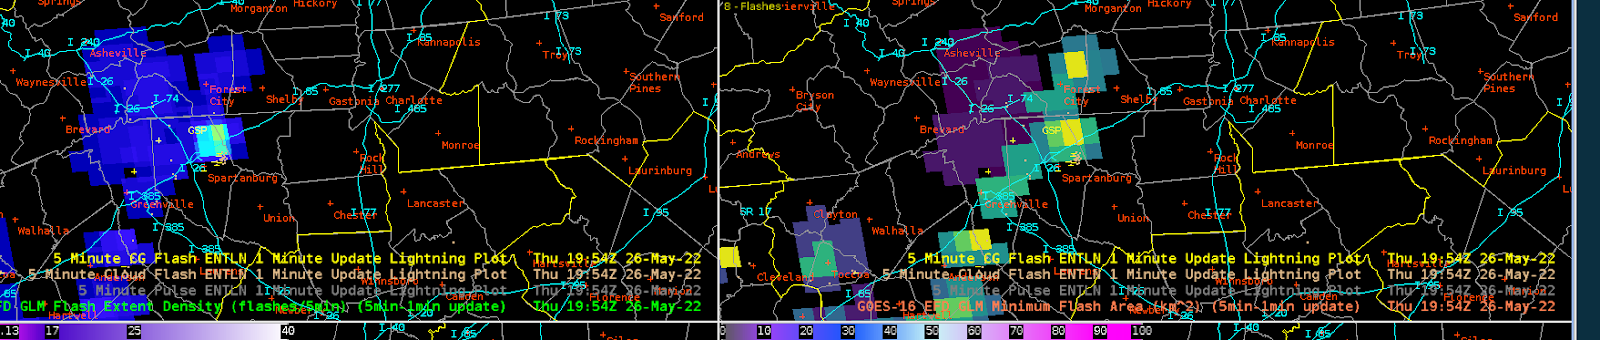
GLM suite showing a pulse in a storm near my DSS event area.
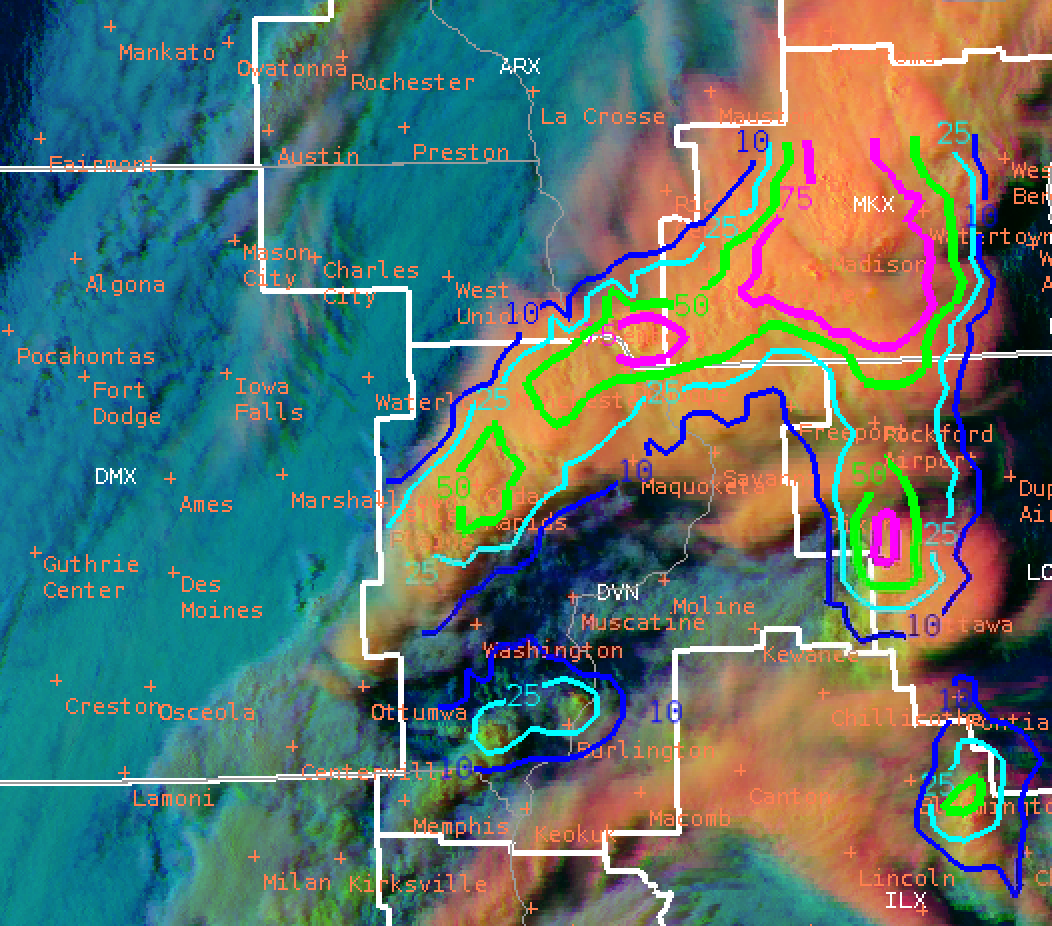
Overall, GLM was very useful in tandem with the LightningCast products for showing growth and decay in ongoing thunderstorms.
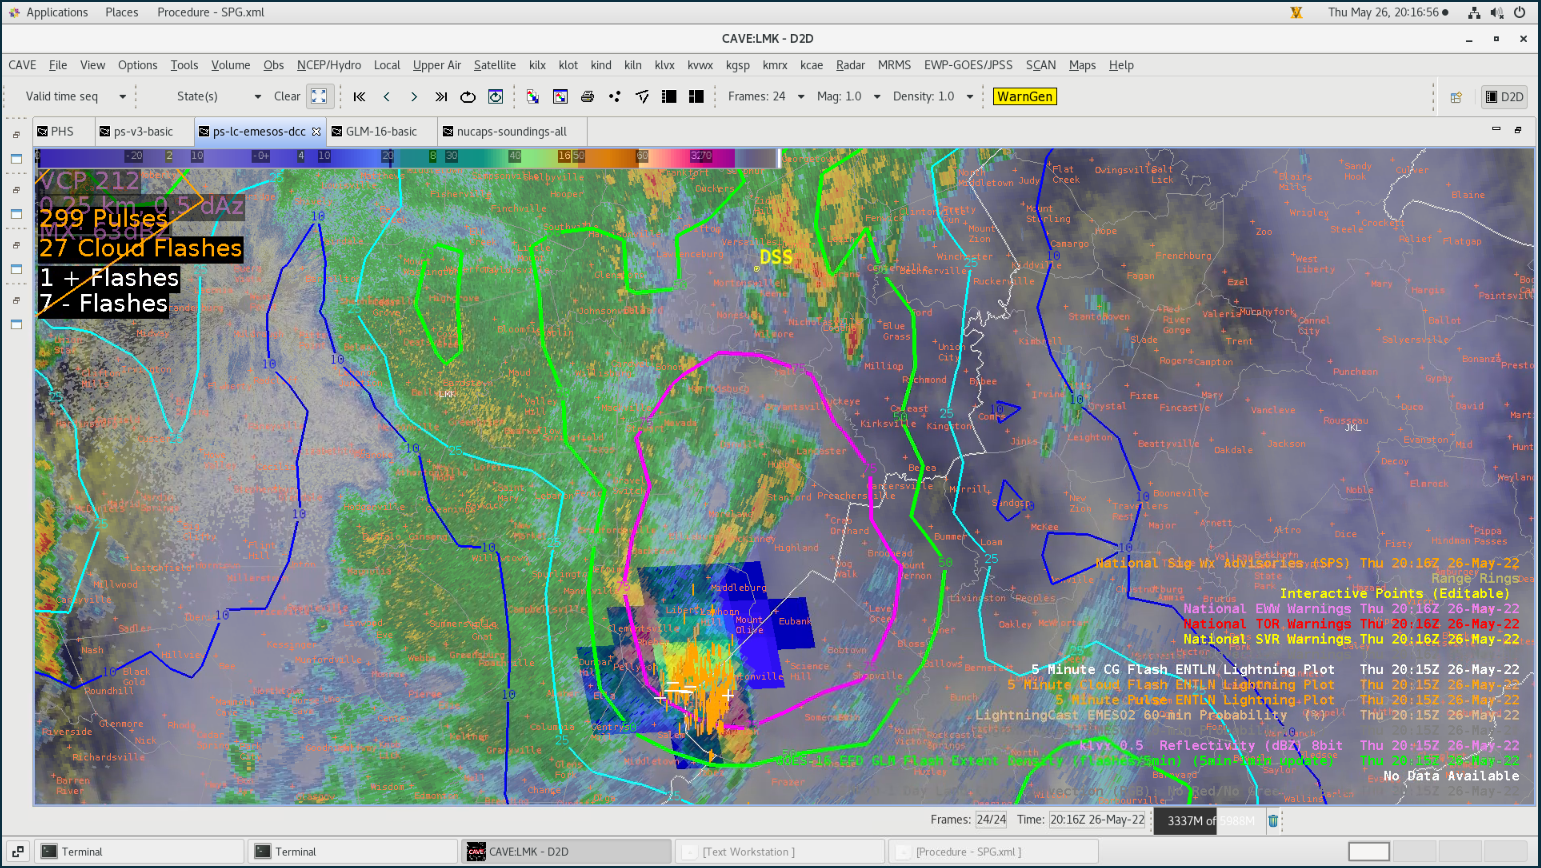
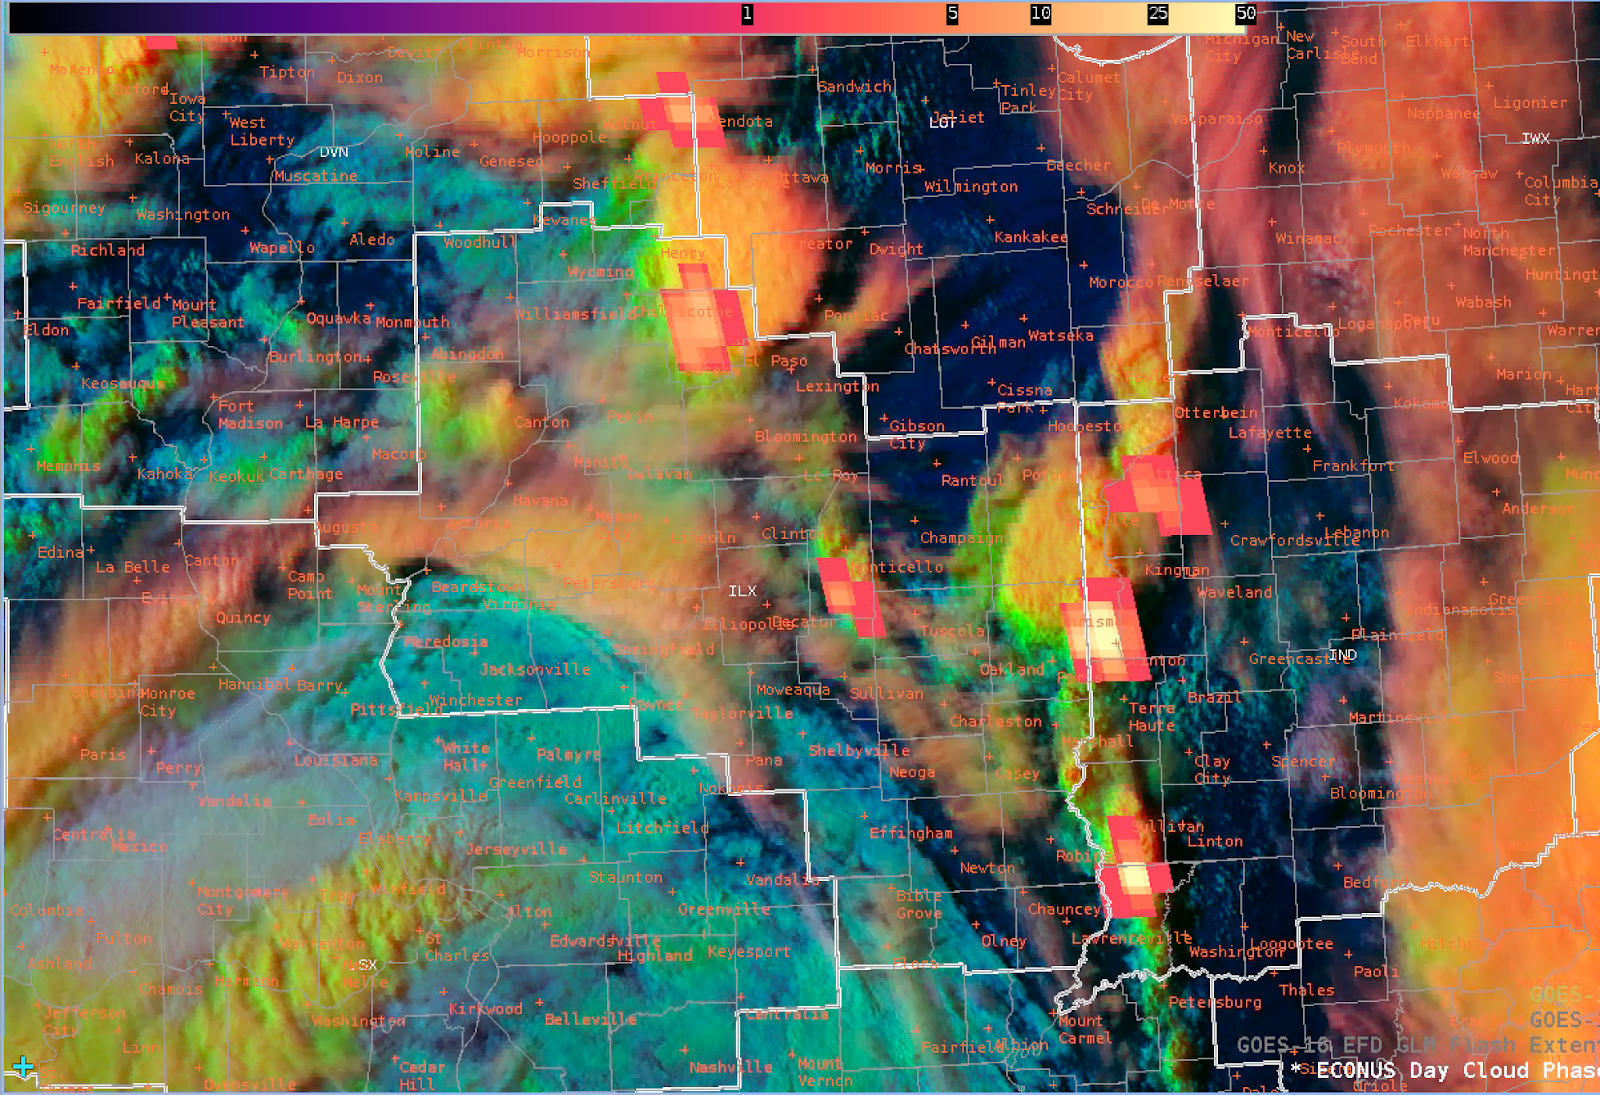
A strengthening storm to the south of my event area shows not only FED increasing, but also sees the LightningCast 75% contour expanding northward likely due to advection of the storm. The scale in this image is FED on a range of 0-50.
PHS
PHS again performed well on the 0-2 hour timeframe. The primary fields of interest were instability (CAPE, LI) and the SigTor parameter.
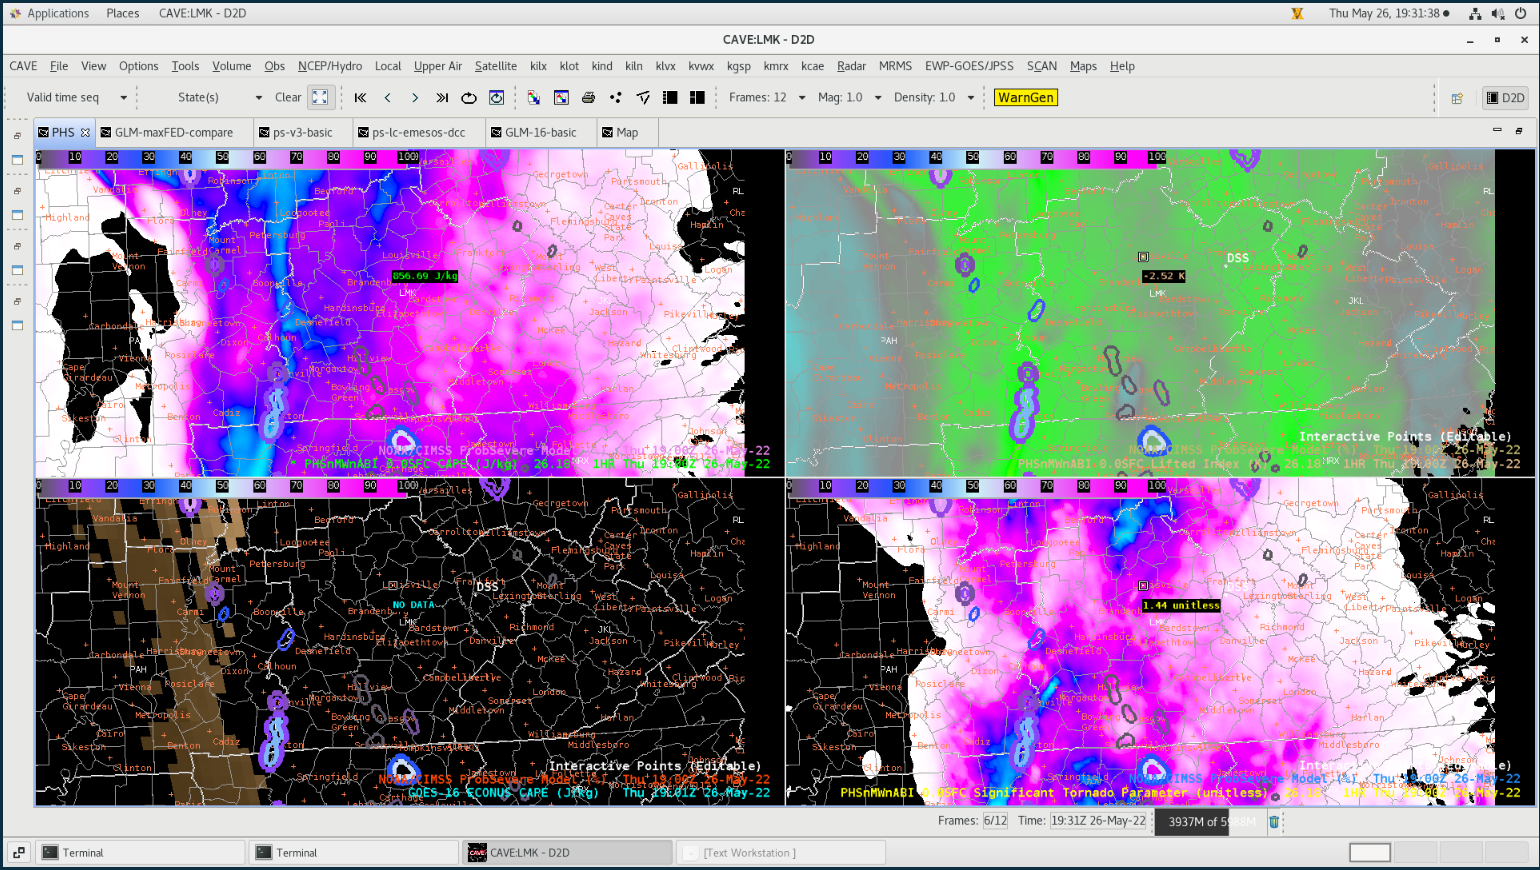
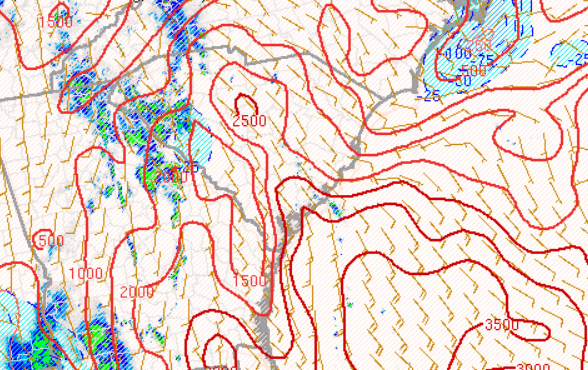
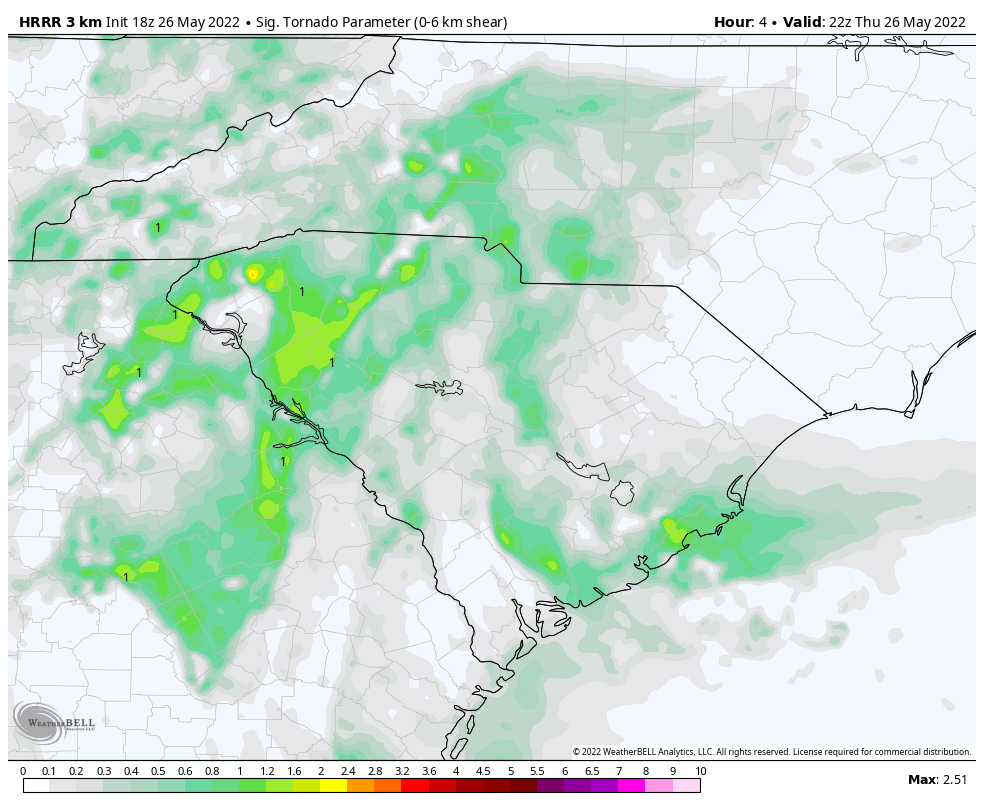
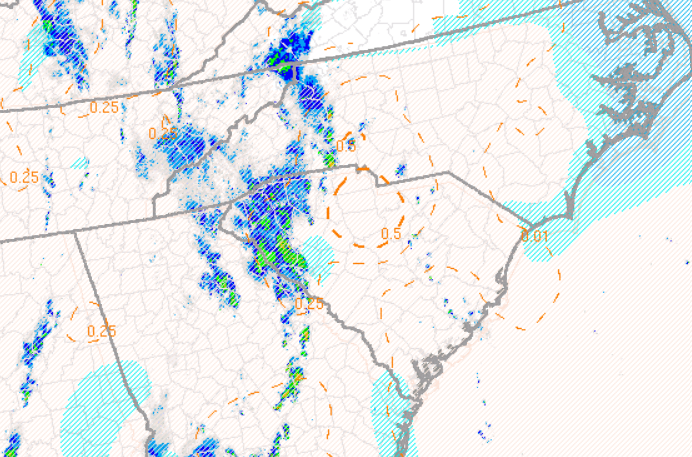
PHS model data with instability, LI, and SigTor. This is a model forecast of 1-hour for the 19Z time period which was initialization in our DSS simulation.
PHS was already highlighting the area of concern along a tongue of instability where storms were ongoing as of the 19Z 1-hour forecast. In subsequent frames, it shows the instability being maintained as storms move toward my DSS area despite thick cloud cover overhead. Based on previously discussed trends in observed lightning, it seemed it was accurately showing areas of marginal but sufficient instability.
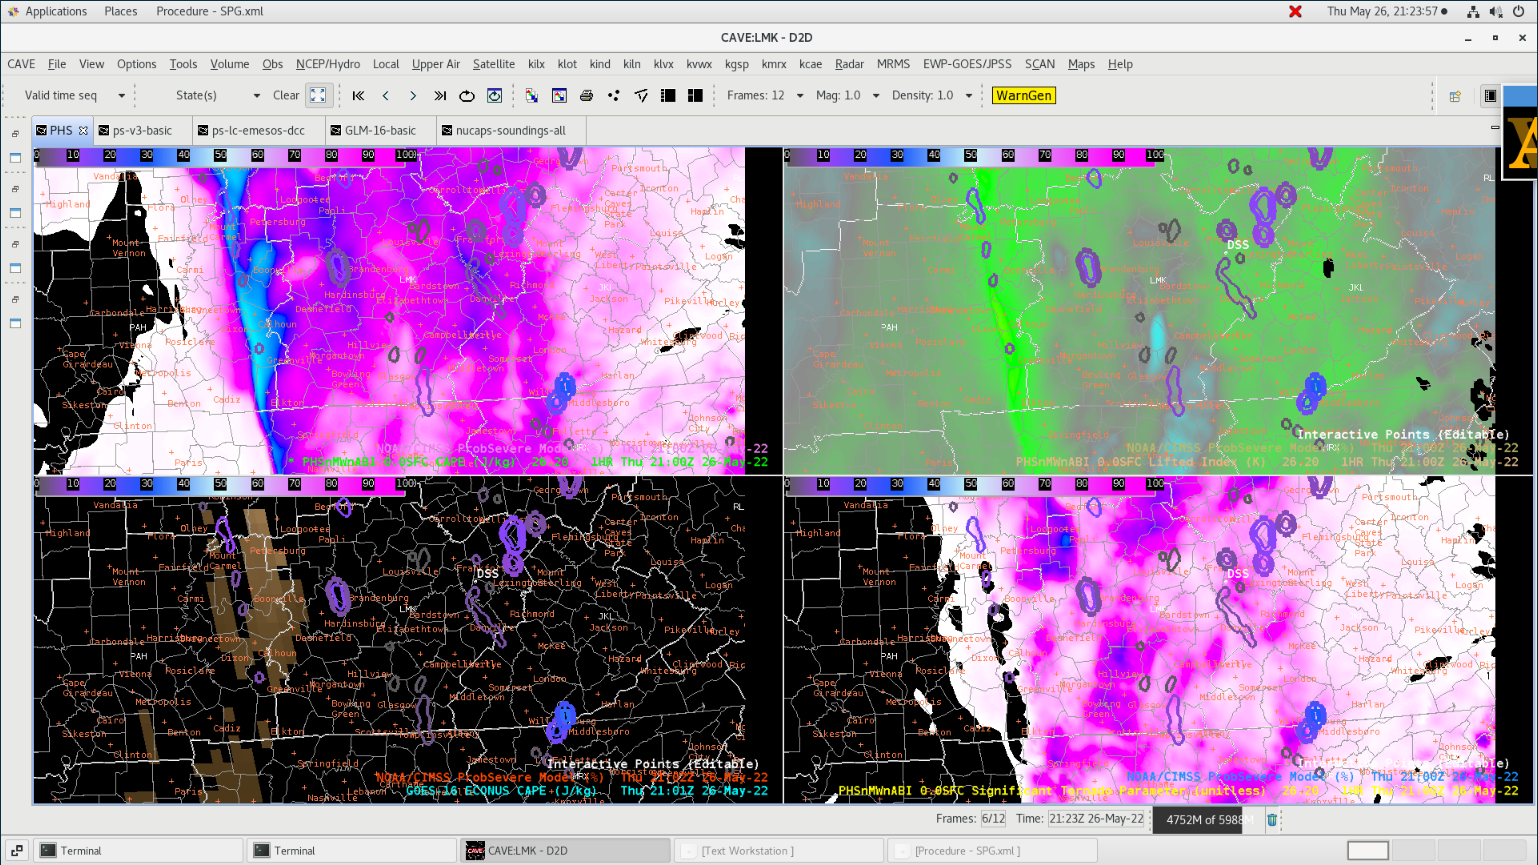
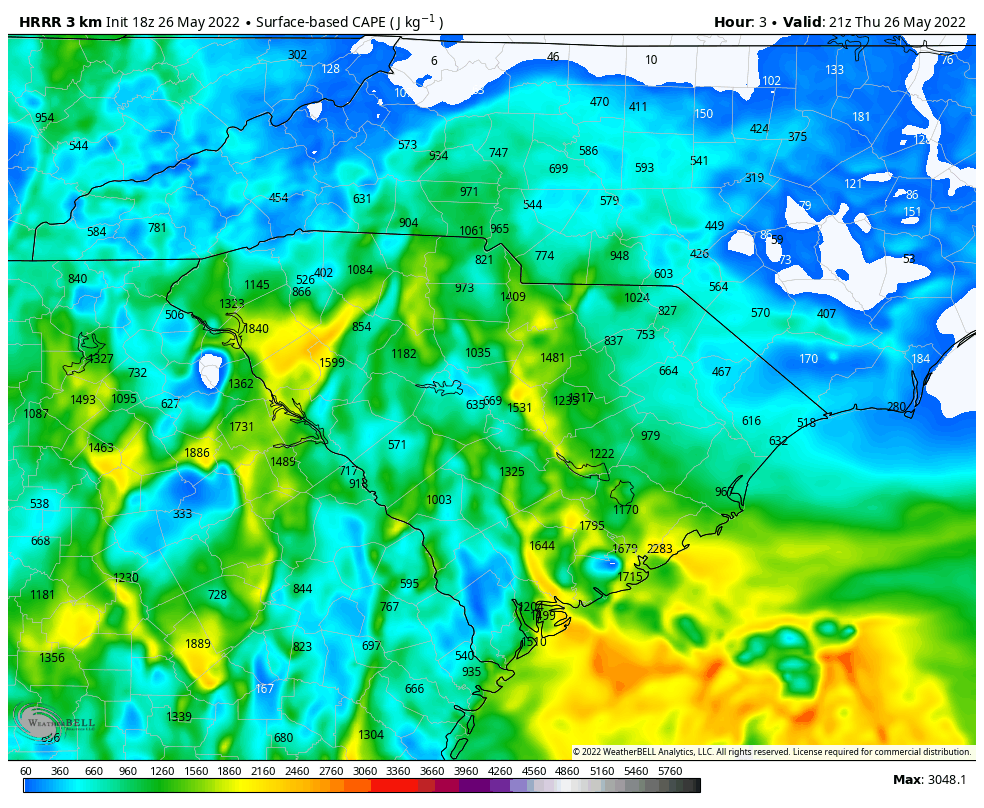
One impressive feature of the PHS model was a thin line of instability on the back edge of convection. This area was a focus for several isolated thunderstorms behind the main line advancing through northern KY as of 21Z. This was a 3-hour forecast pictured above with highlighted areas of instability by low STP, highlighting an insufficiently sheared environment.
It is worth noting that within this study/testbed, we are looking in areas of Slight Risk or higher as highlighted by the SPC as our area of interest. In an operational setting, it is fairly uncommon to have severe weather events only when the area is highlighted in the Slight or higher category. Therefore, it is unlikely that the SigTor parameter would be useful outside of high-profile events. For example, at my local WFO, we have many severe weather days where we have very high CAPE, but very little in the way of shear. Since our primary concern is usually wind, I don’t think SigTor would be useful. It may be worth adding additional parameters highlighting various threat potentials (wind, hail, etc.).
ProbSevere v3
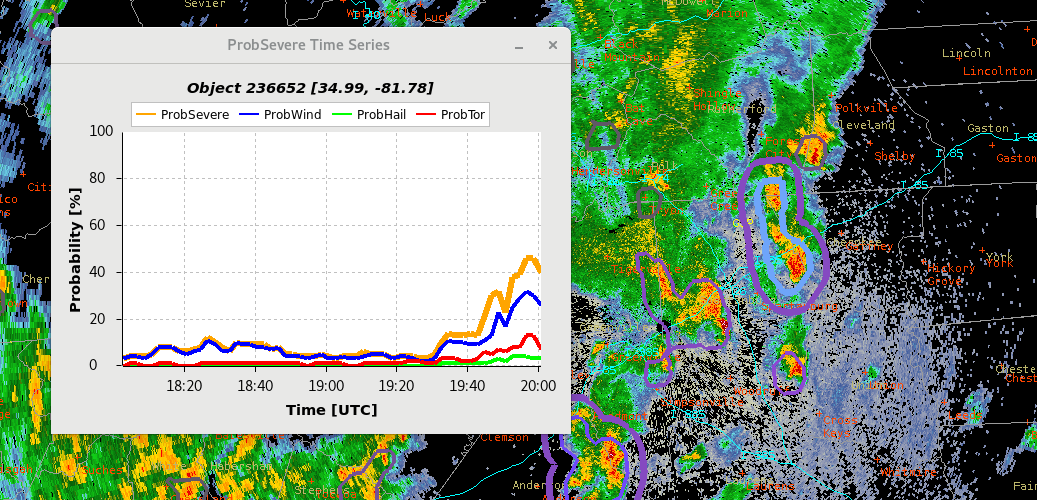
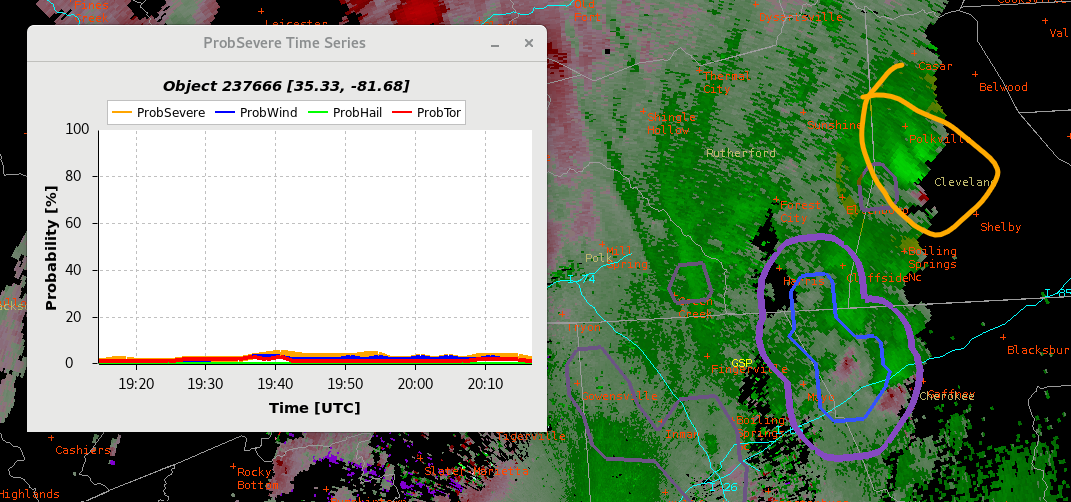
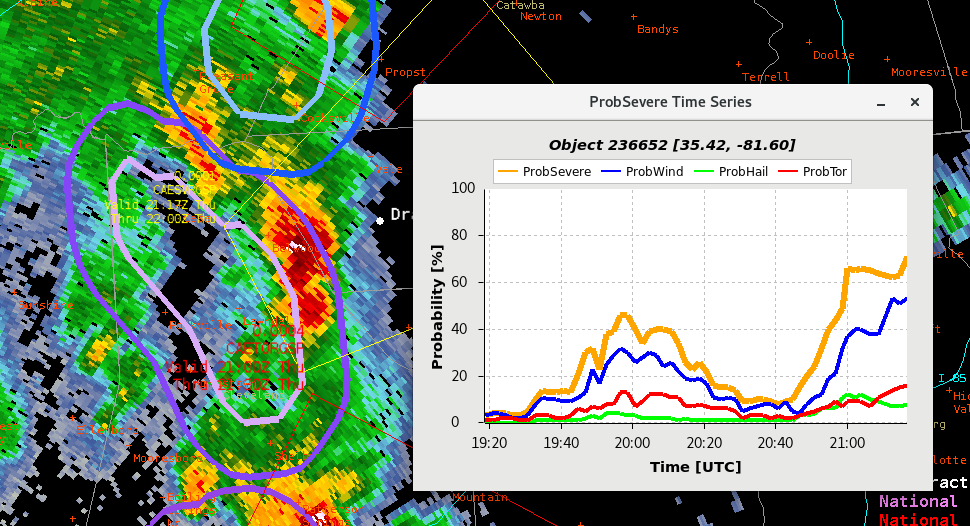
I was not the warning forecast in this instance, but I did notice that a couplet of rotation was observed on the MRMS rotation tracks. Based on radar data (it is worth noting that this storm was at a large distance from the radar), the couplet was well within the bounds of a rotating couplet with vertical continuity and frame-to-frame consistency.
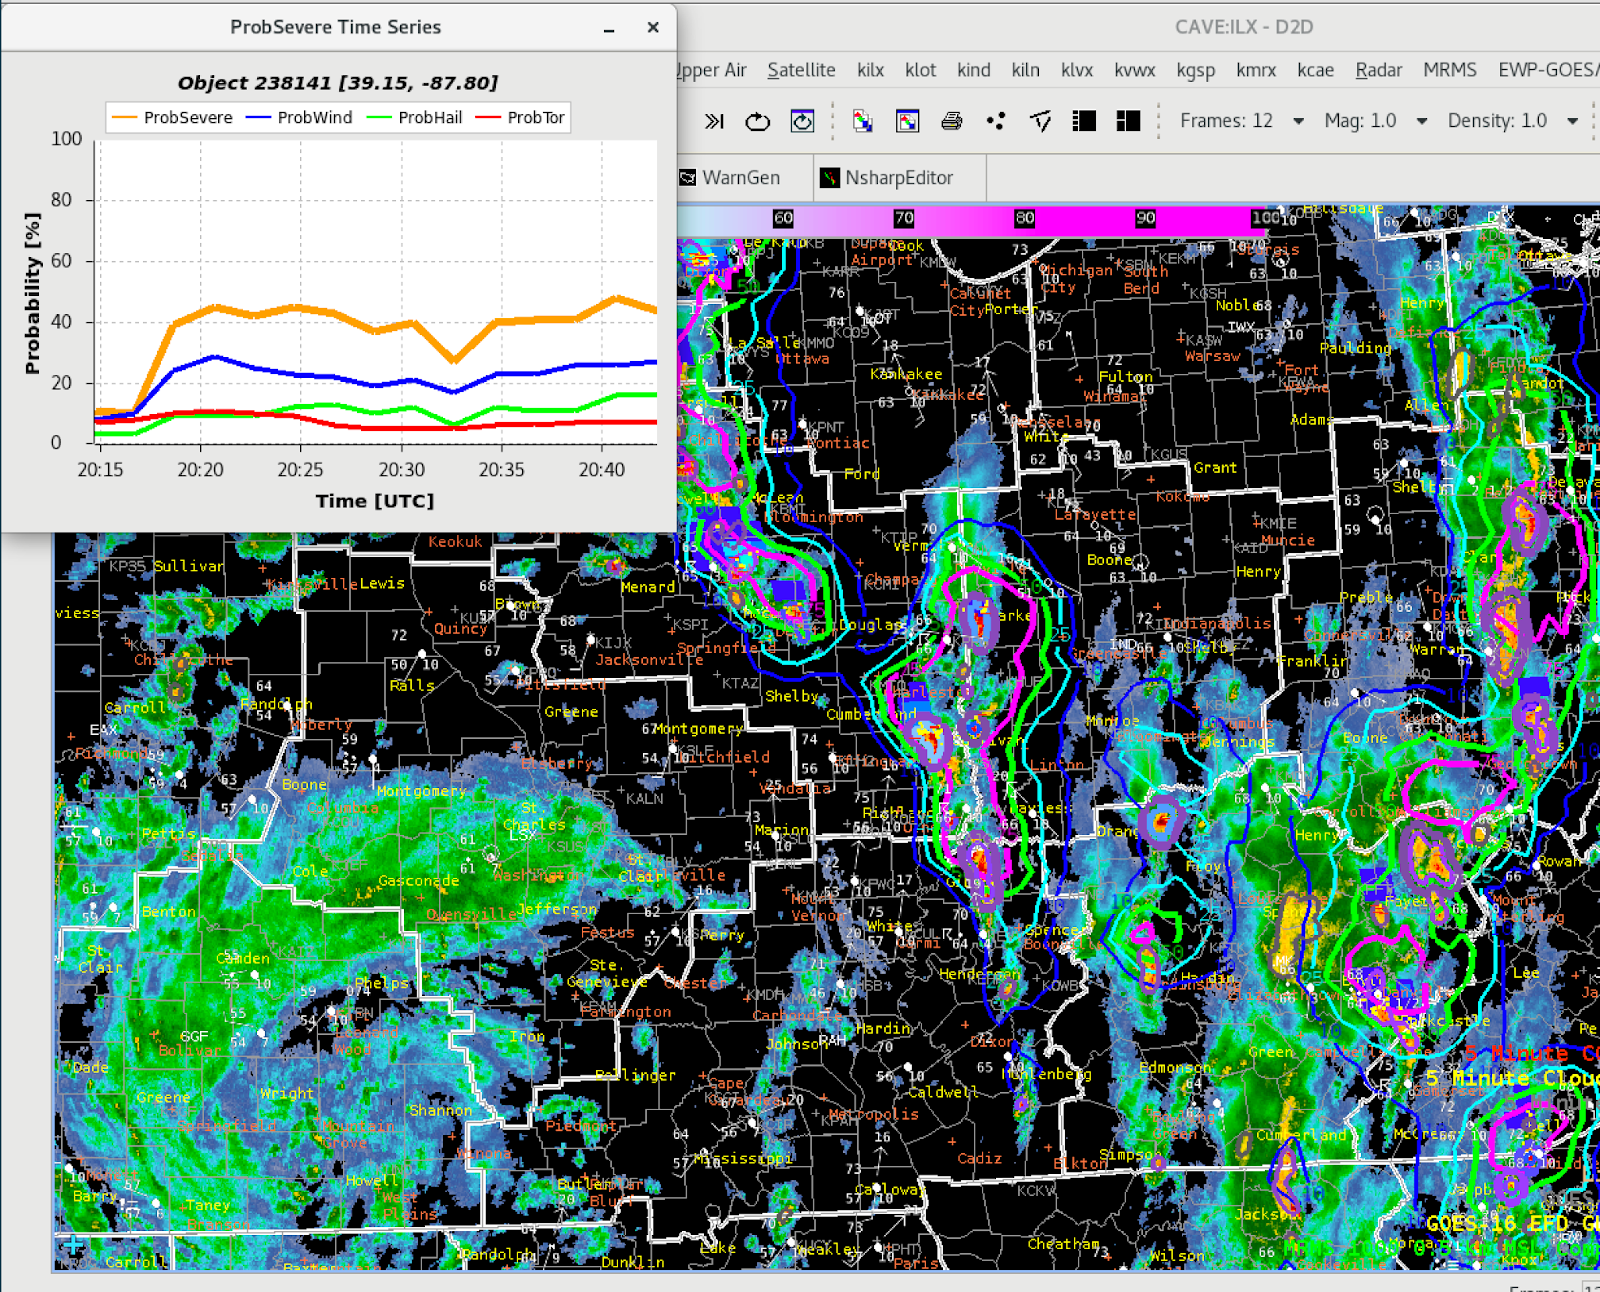
However, ProbSevere only had a tornado probability of around 10% which should have been higher given the available radar data. This couplet was short-lived, but survived for a few frames after its initial detection. Probabilities did increase, but were not high enough for what I would have expected to be a weak tornado given the surrounding data.
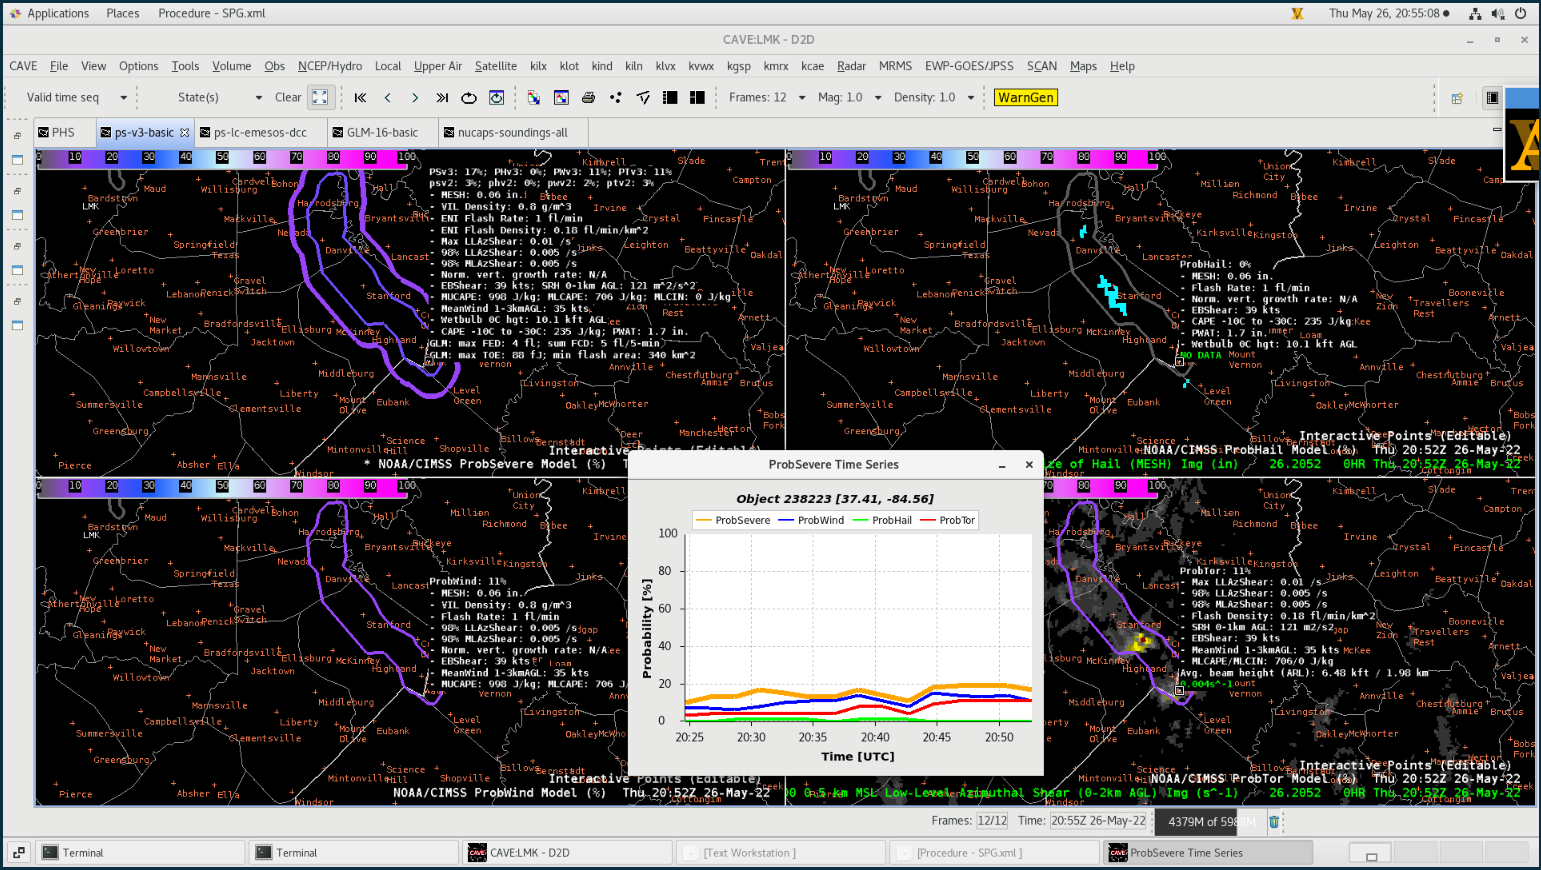
ProbSevere 4-panel showing overall severe potential, hail, wind, and tornado probabilities. According to the data, all of the probabilities remained low, including TOR which should have been higher in this case. This is also supported with MRMS rotational measurements and KLVX radar data.
Optical Flow Winds
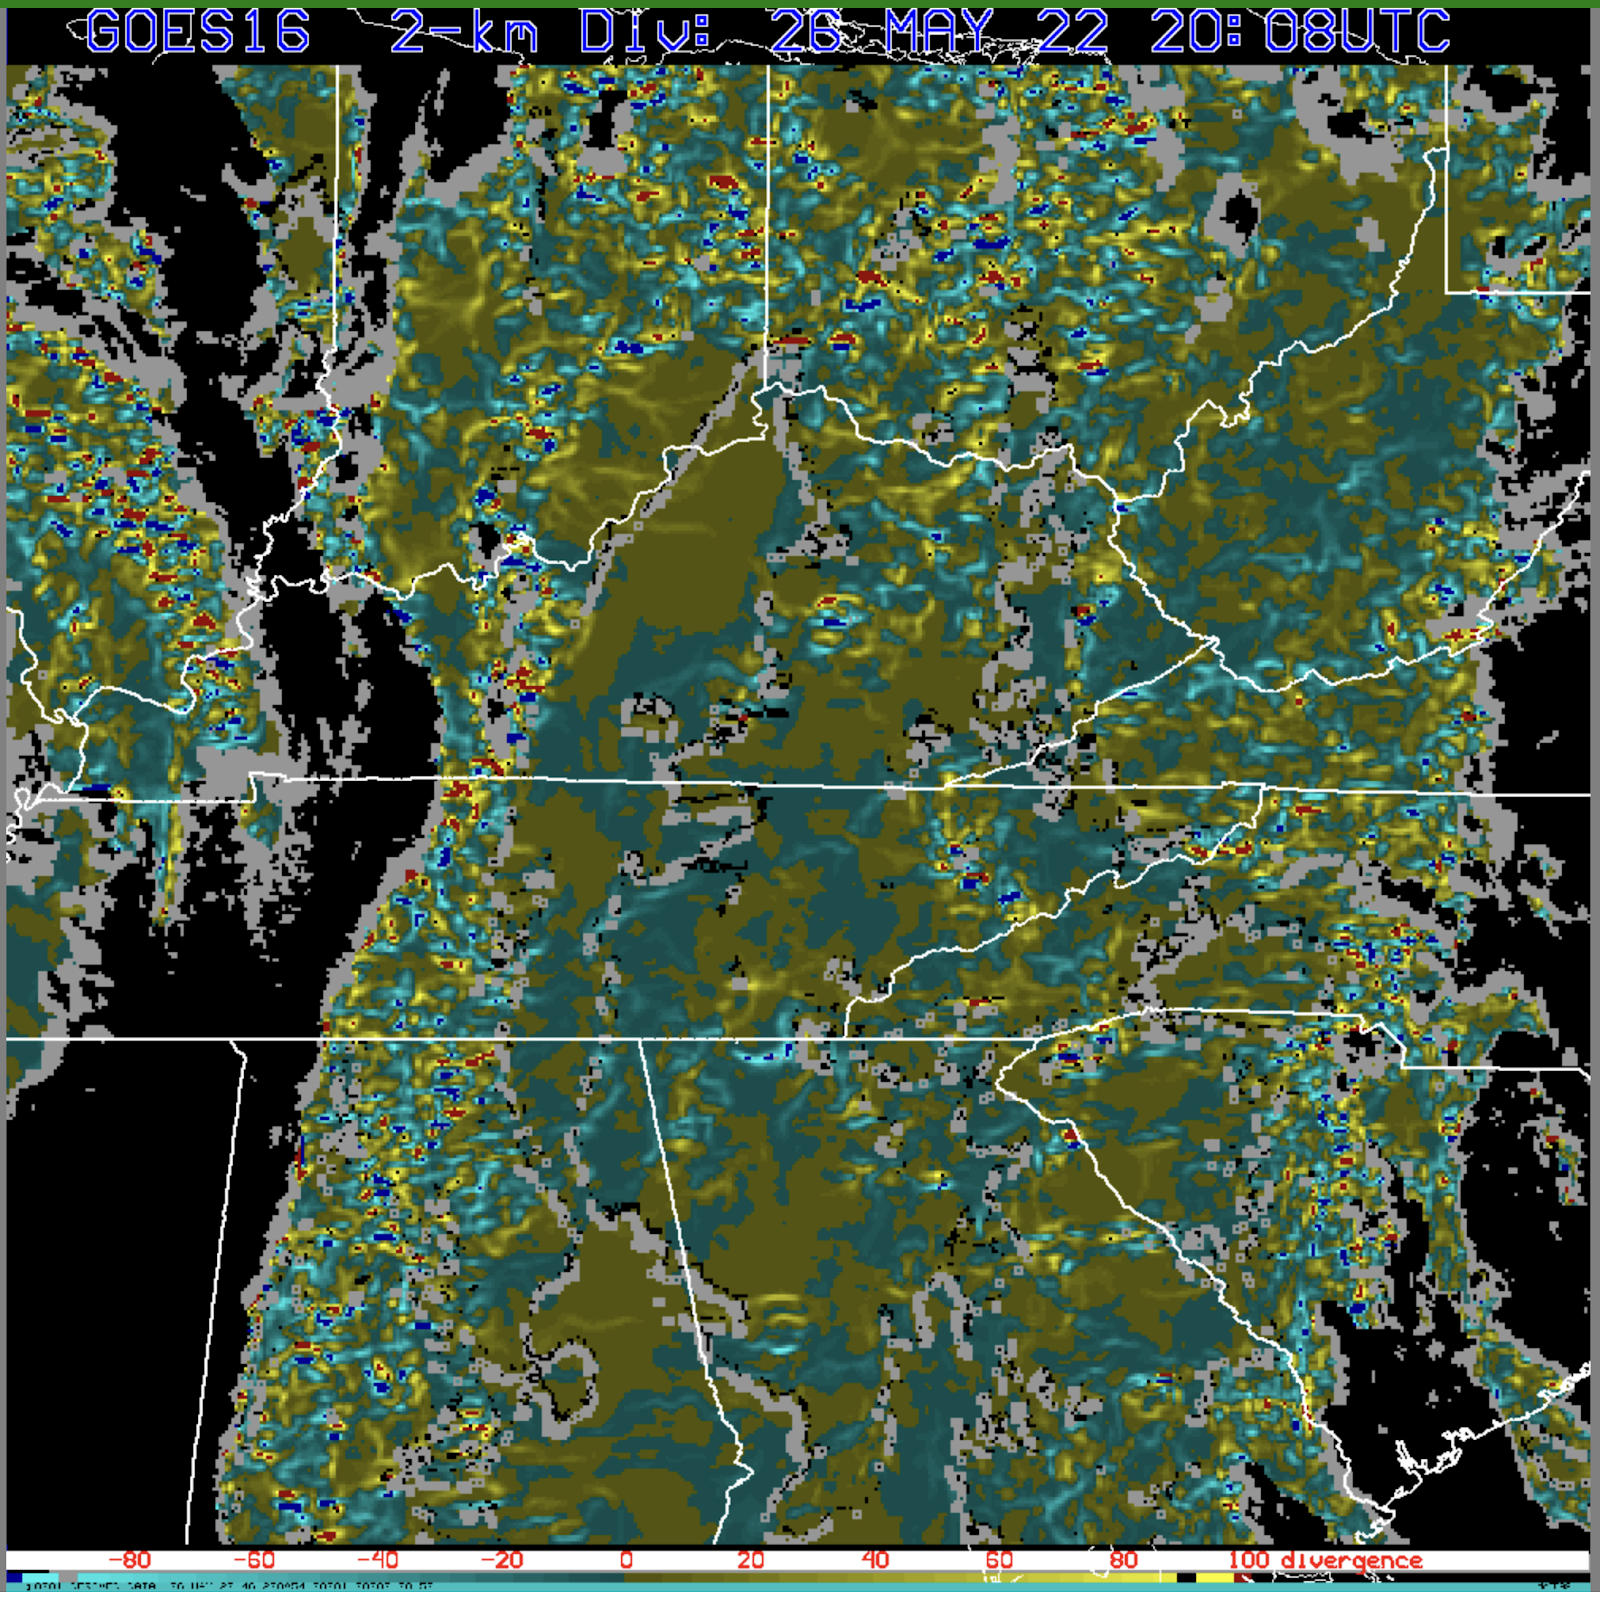
With the widespread convection across my area and the long-term cloudiness, I did find some correlation between the Optical Flow Winds and the strongest storms over my CWA (LMK). This was similar to the Birmingham area yesterday, but the stronger storms were not as pronounced in yesterday’s case. CAPE profiles were a little more pronounced today across central KY which likely contributed to this advantage. However, it was still hard to pick out the exact divergence value with these storms, but there were obvious hot spots that helped with situational awareness.
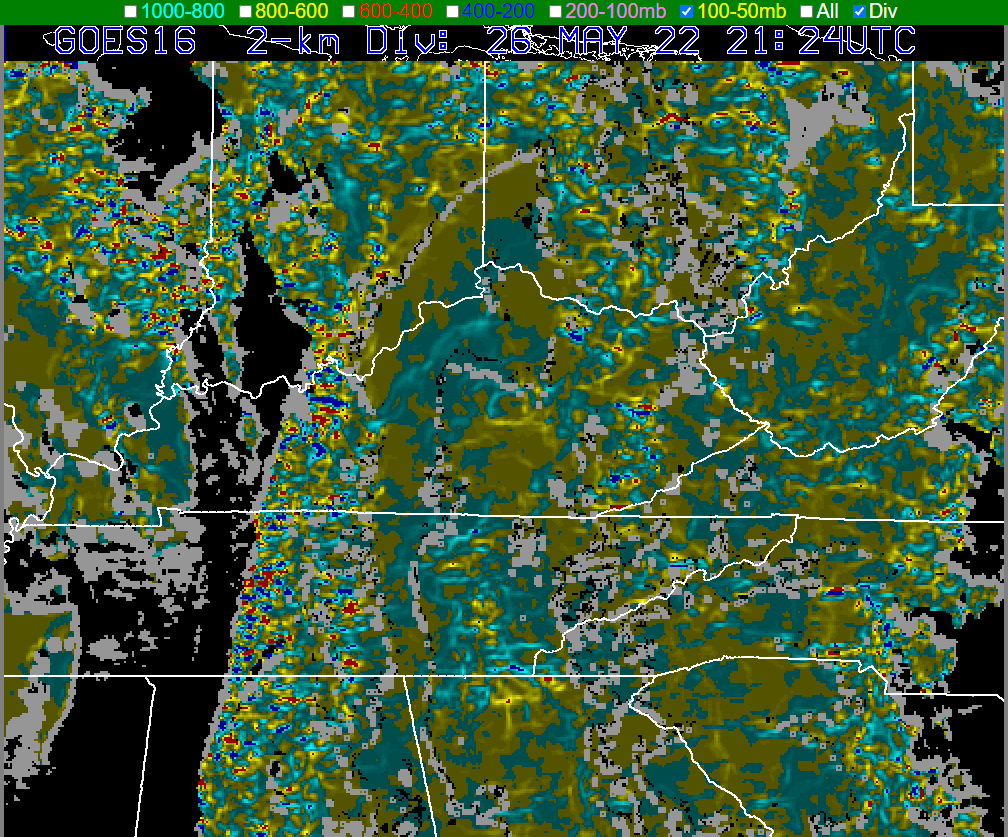
The strongest divergent cells were more obvious on the OFW display today and they lined-up with the strongest cells across the LMK CWA.
NUCAPS
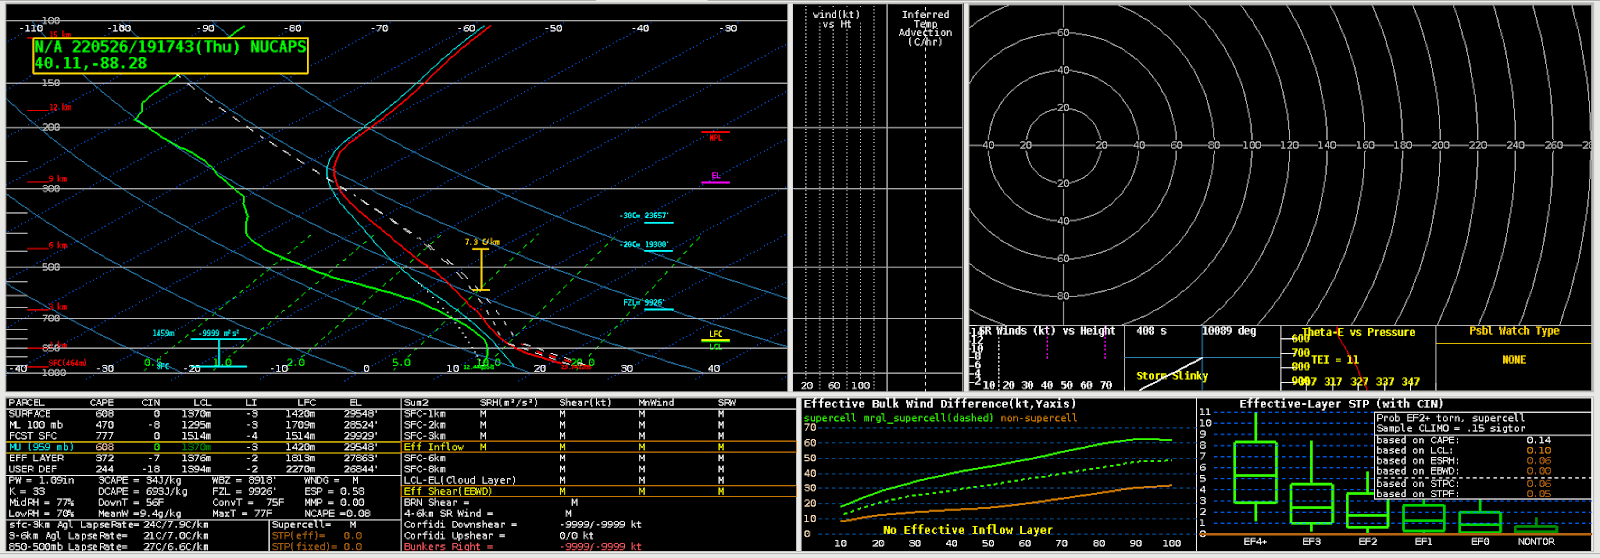
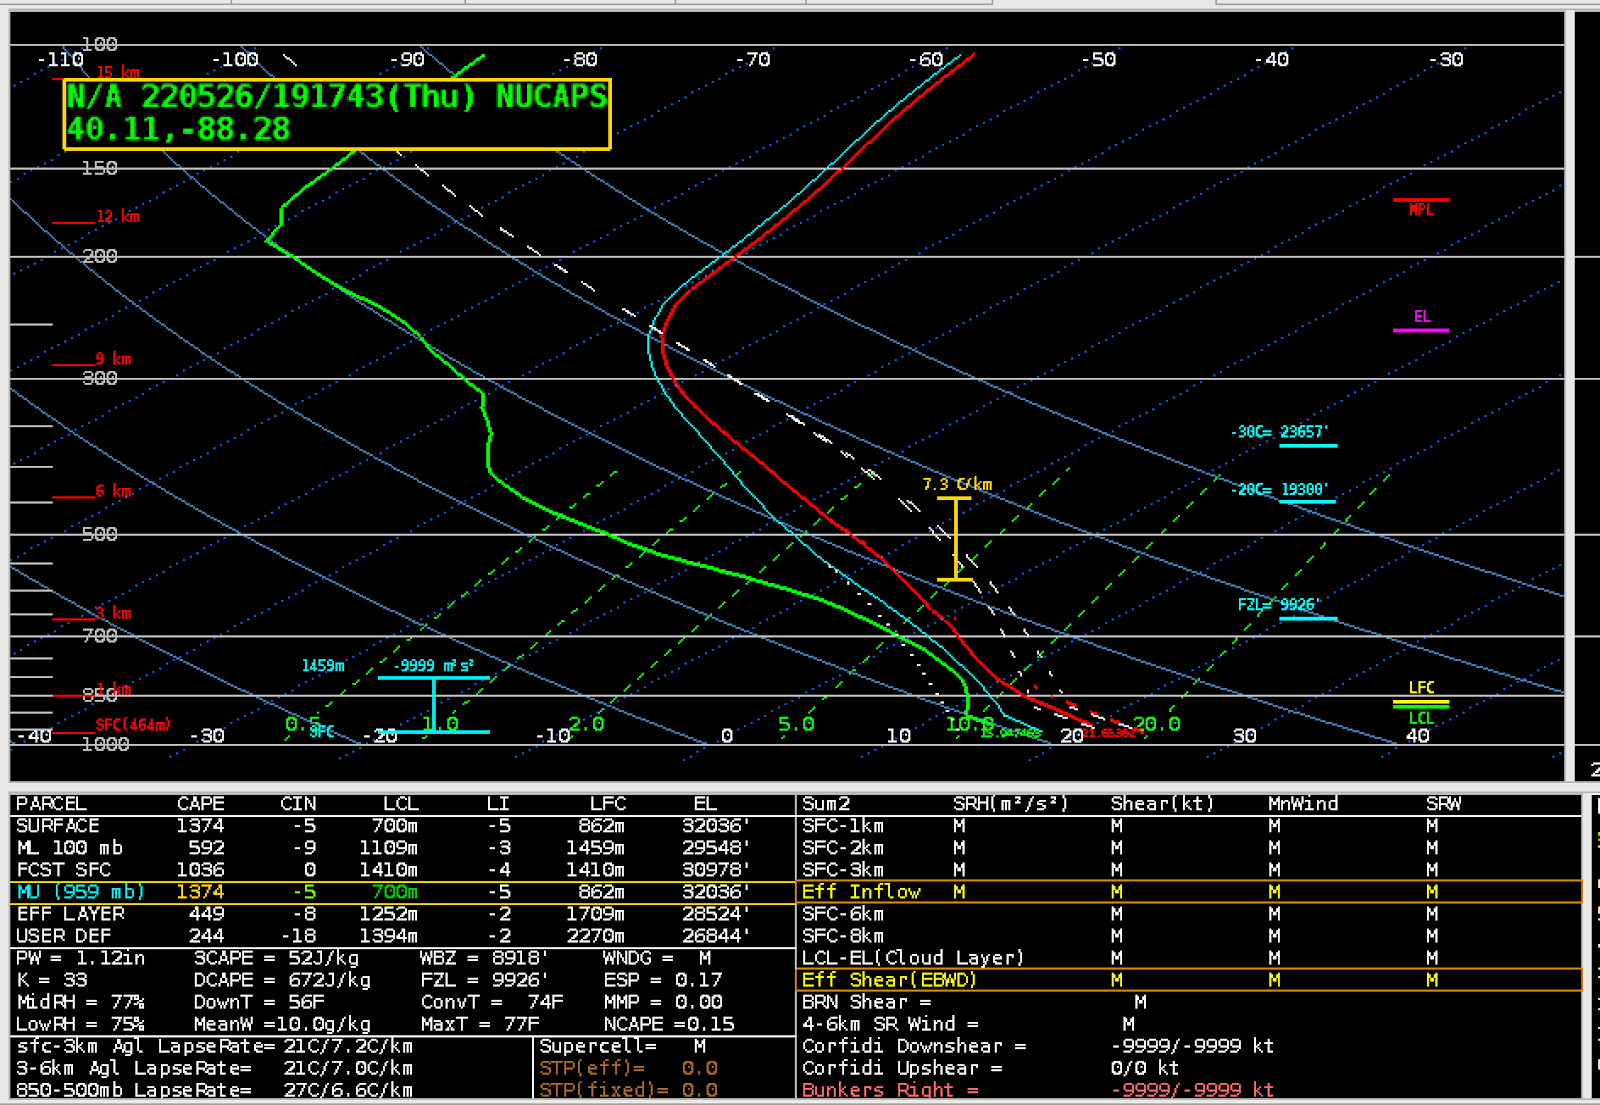
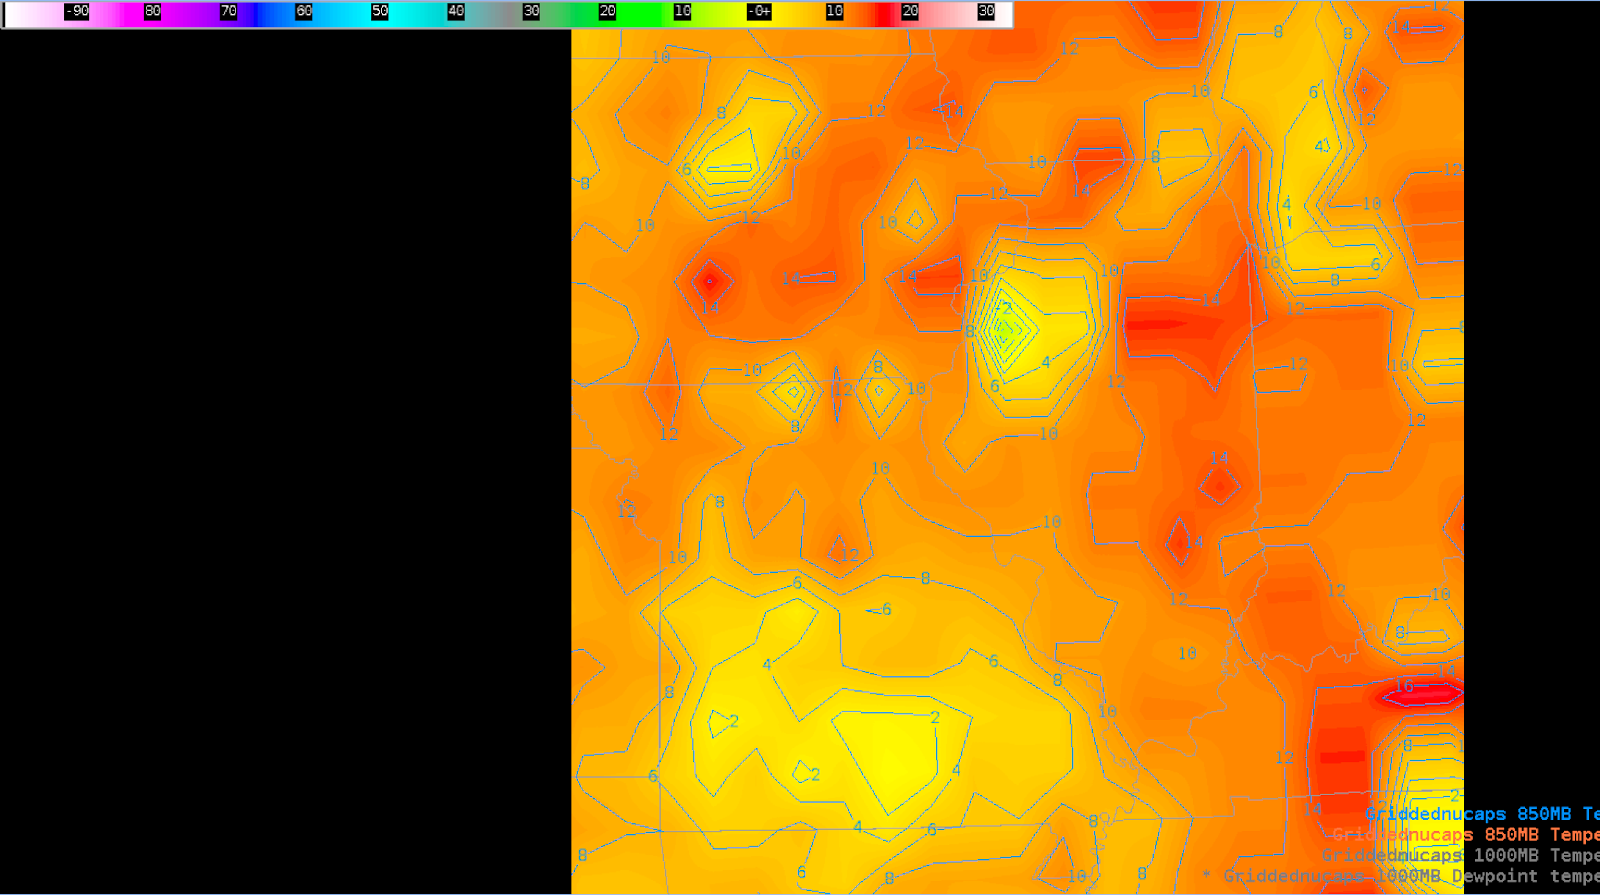
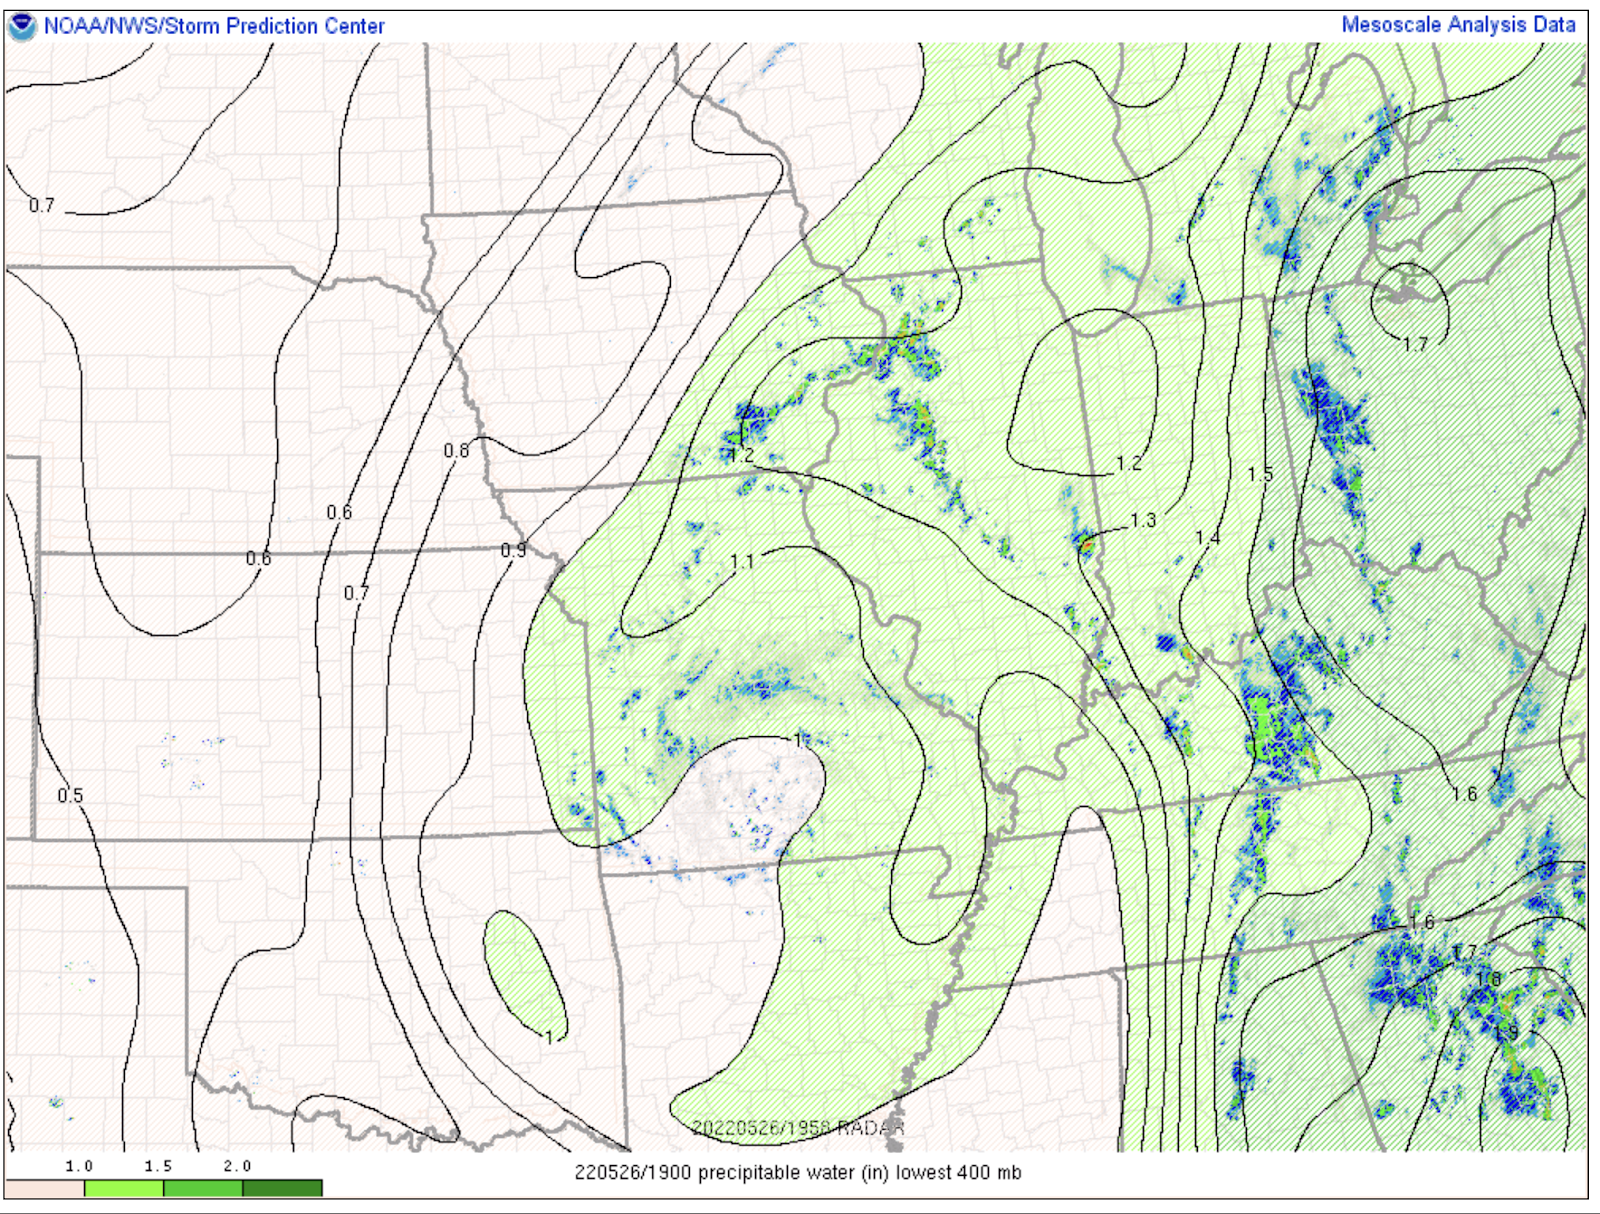
NUCAPS data was unavailable today and the passes did not line-up with our area. Even if we had some data available, there would have likely been too many red-retrievals to make use of the soundings due to widespread thick cloud cover.
- Overcast Ambience