Friday, May 27, 2022

ILX Ramblings

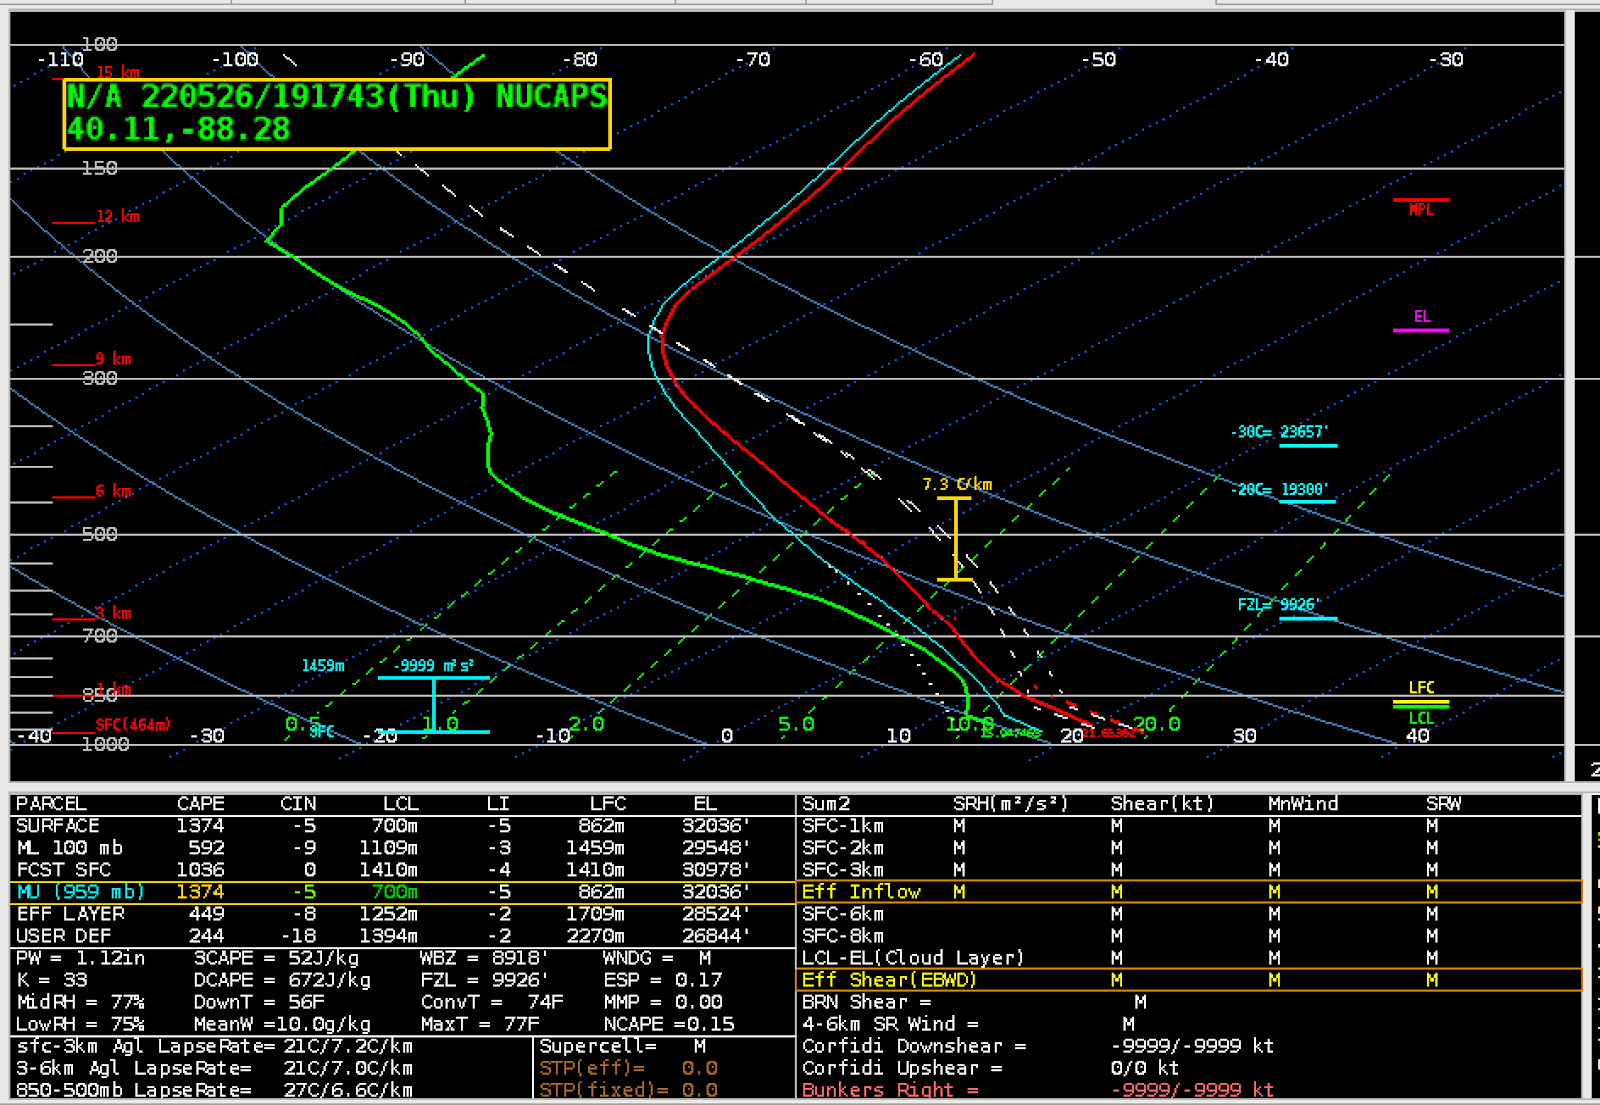
 A comparison of NUCAPS at 19Z with observed/analysis products from SPC showed good comparison for both modified and unmodified data. Below shows the unmodified NUCAPS sounding that was “green” over the north-central portion of the ILX CWA. The MLCAPE was around 500 J/kg, with DCAPE around 690 J/kg, freezing levels just below 10,000 feet, and PW’s around 1.1 inches.

A modified NUCAPS sounding for the same location showed an uptick in MLCAPE to around 600 J/kg, along with similar PW’s, DCAPE and freezing level.

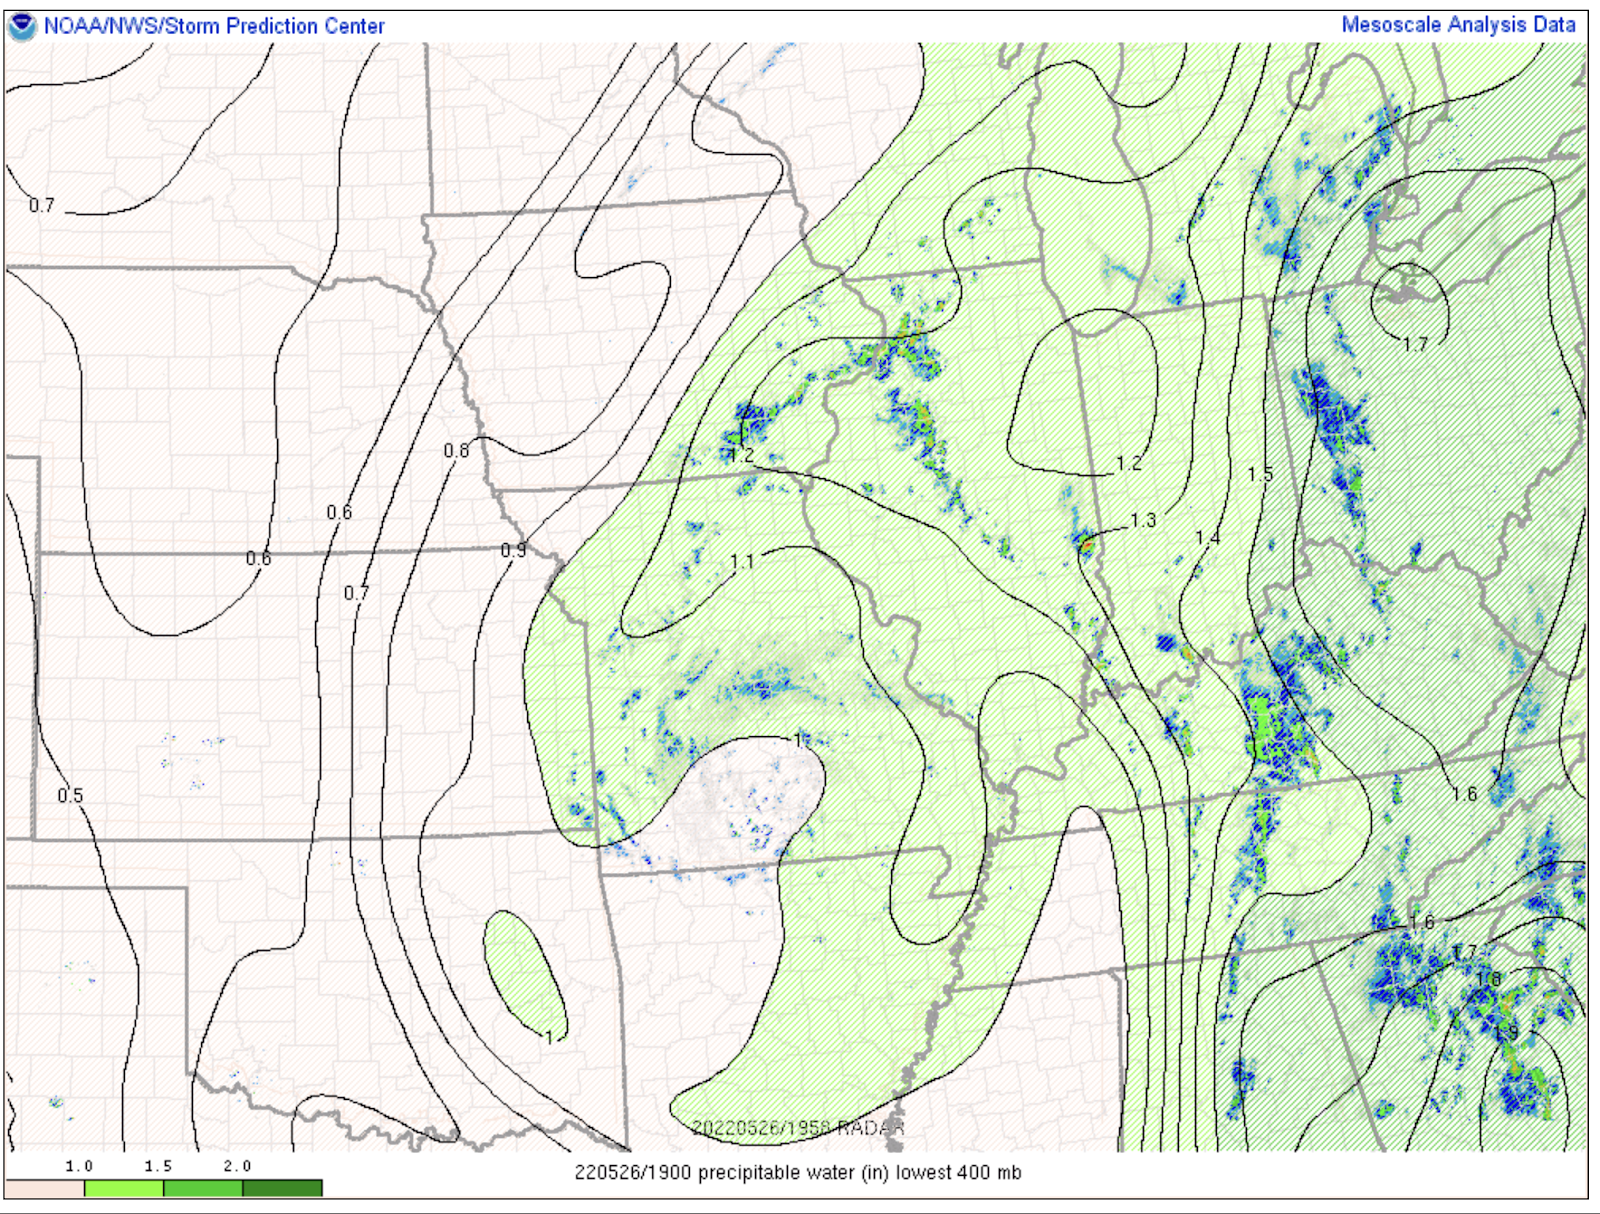
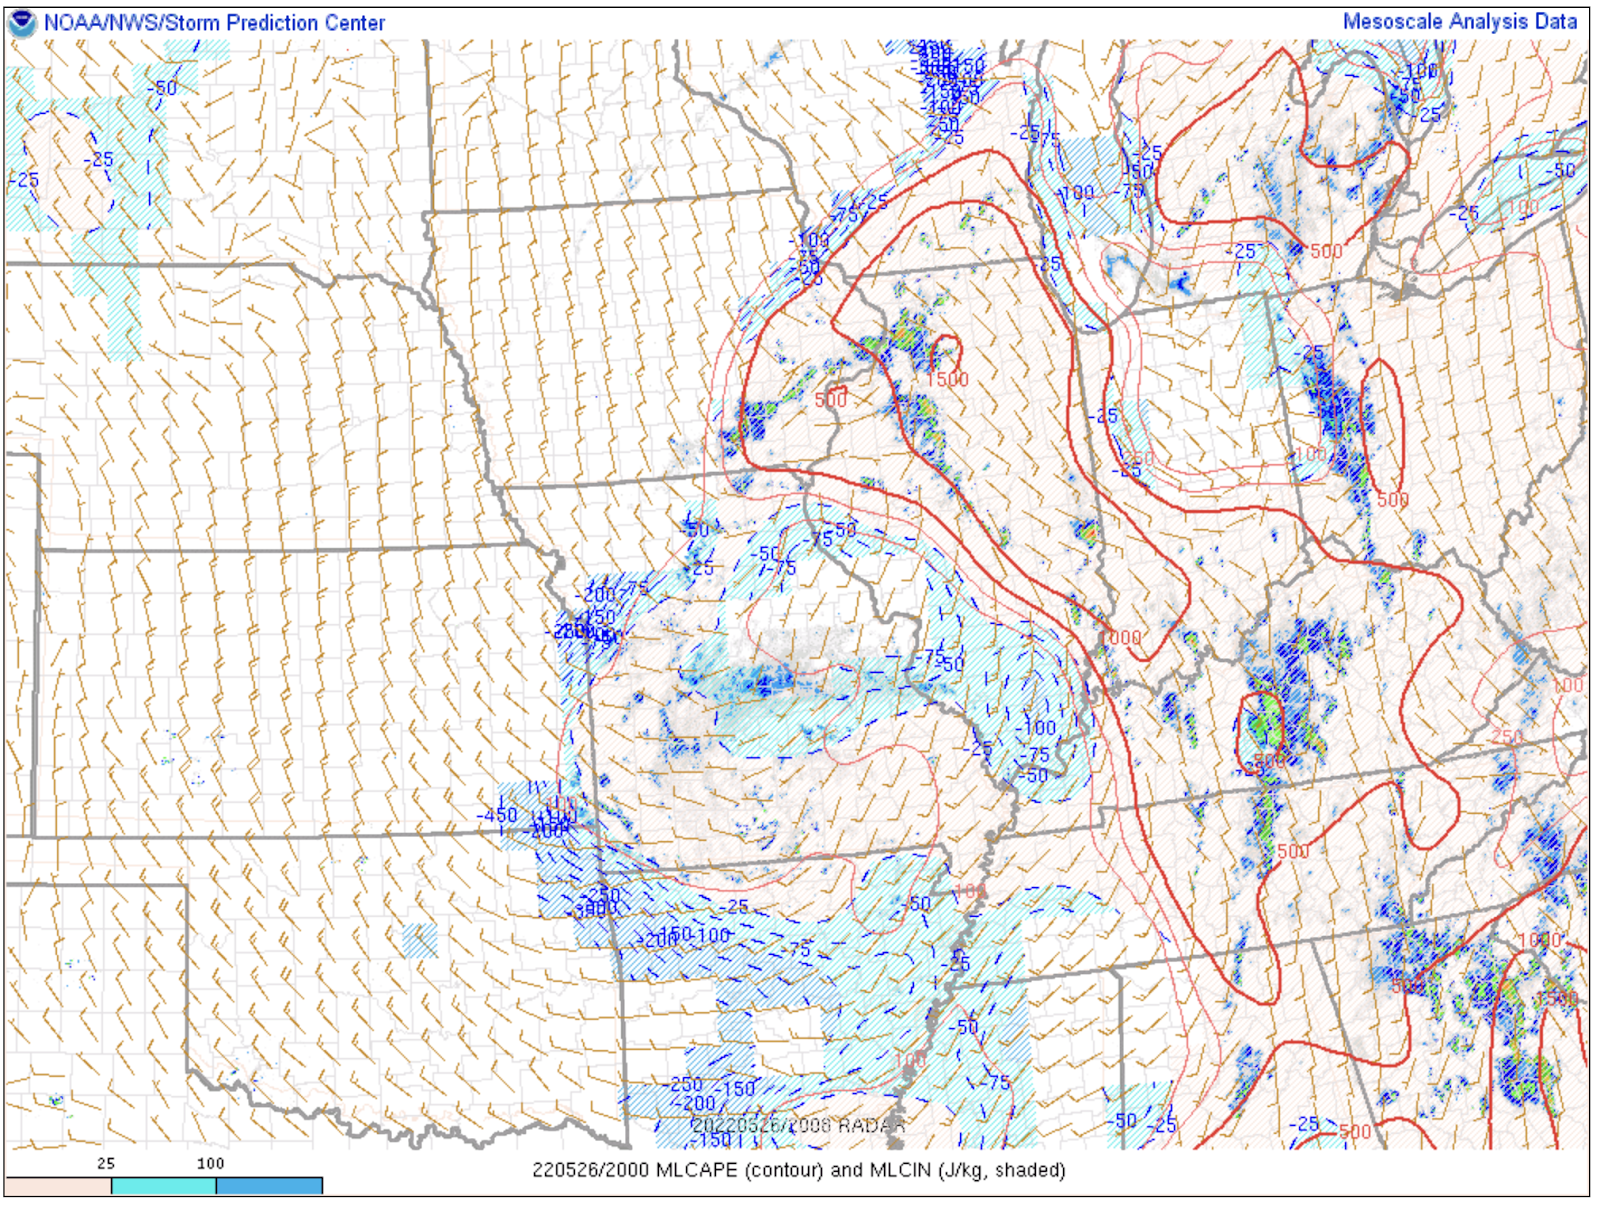
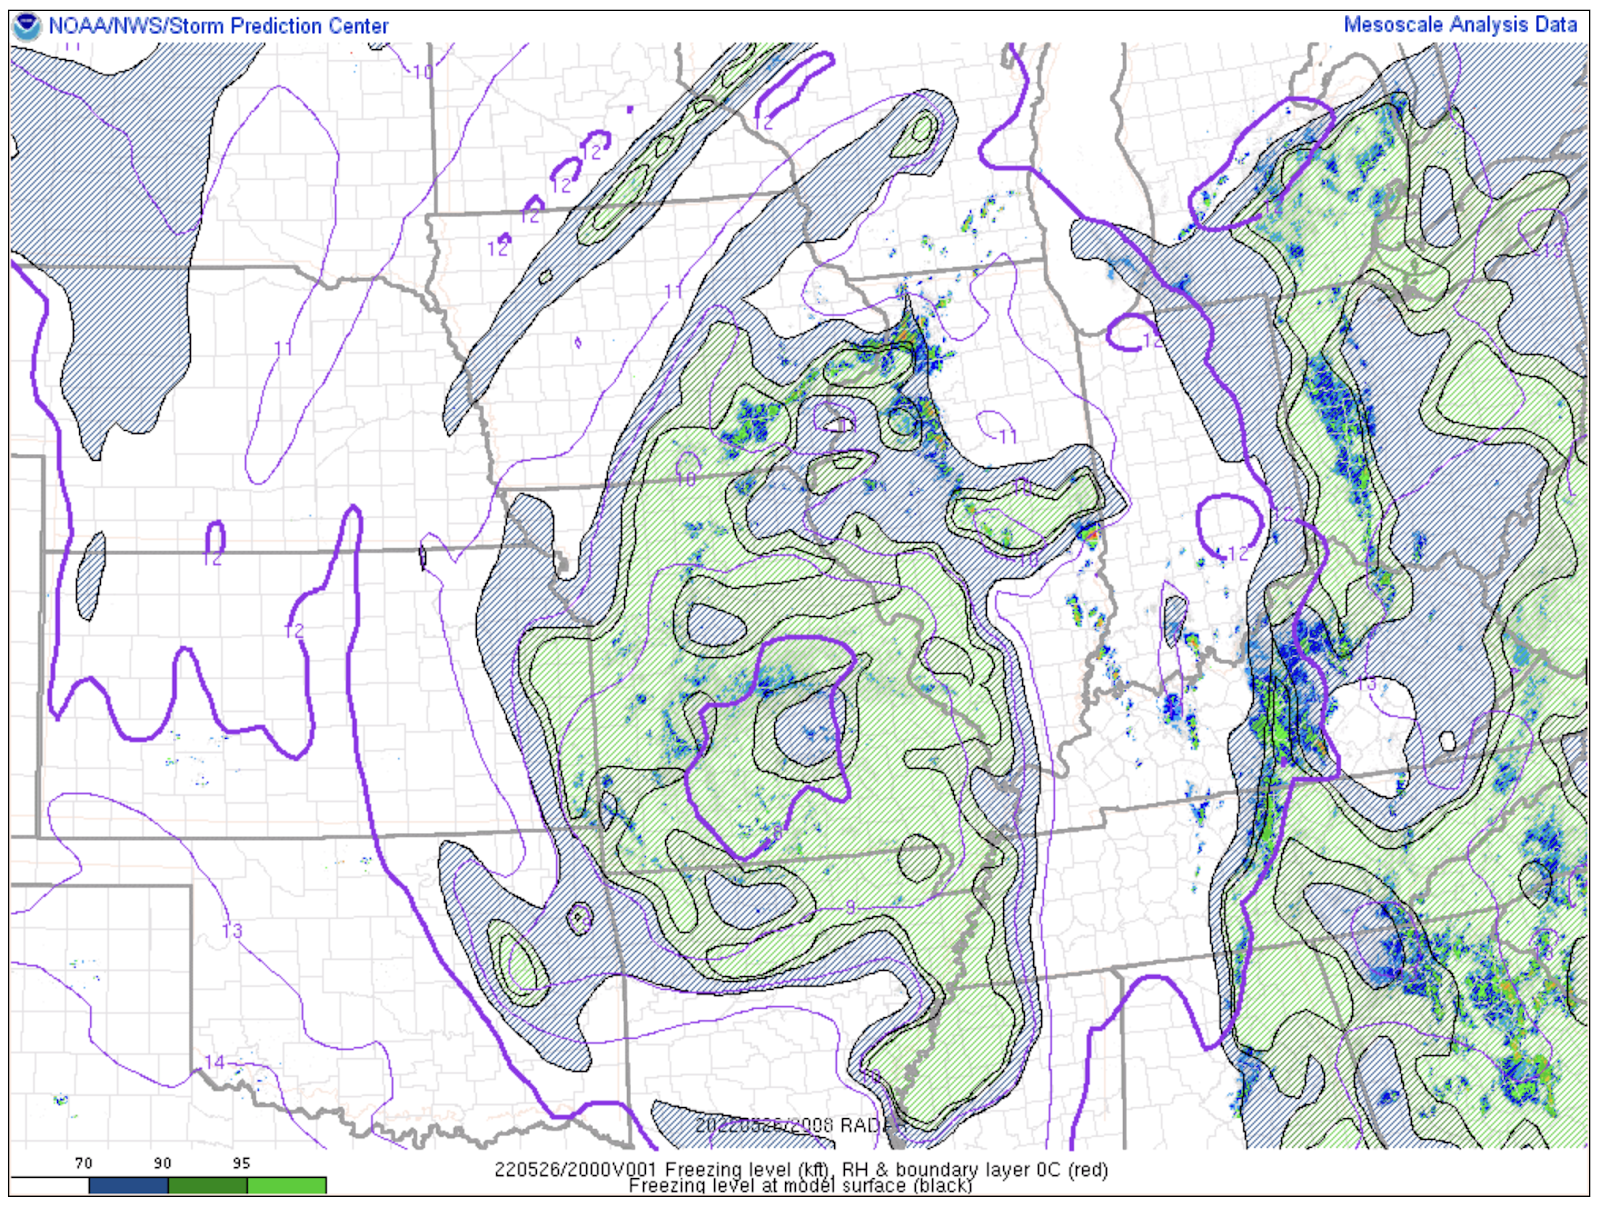
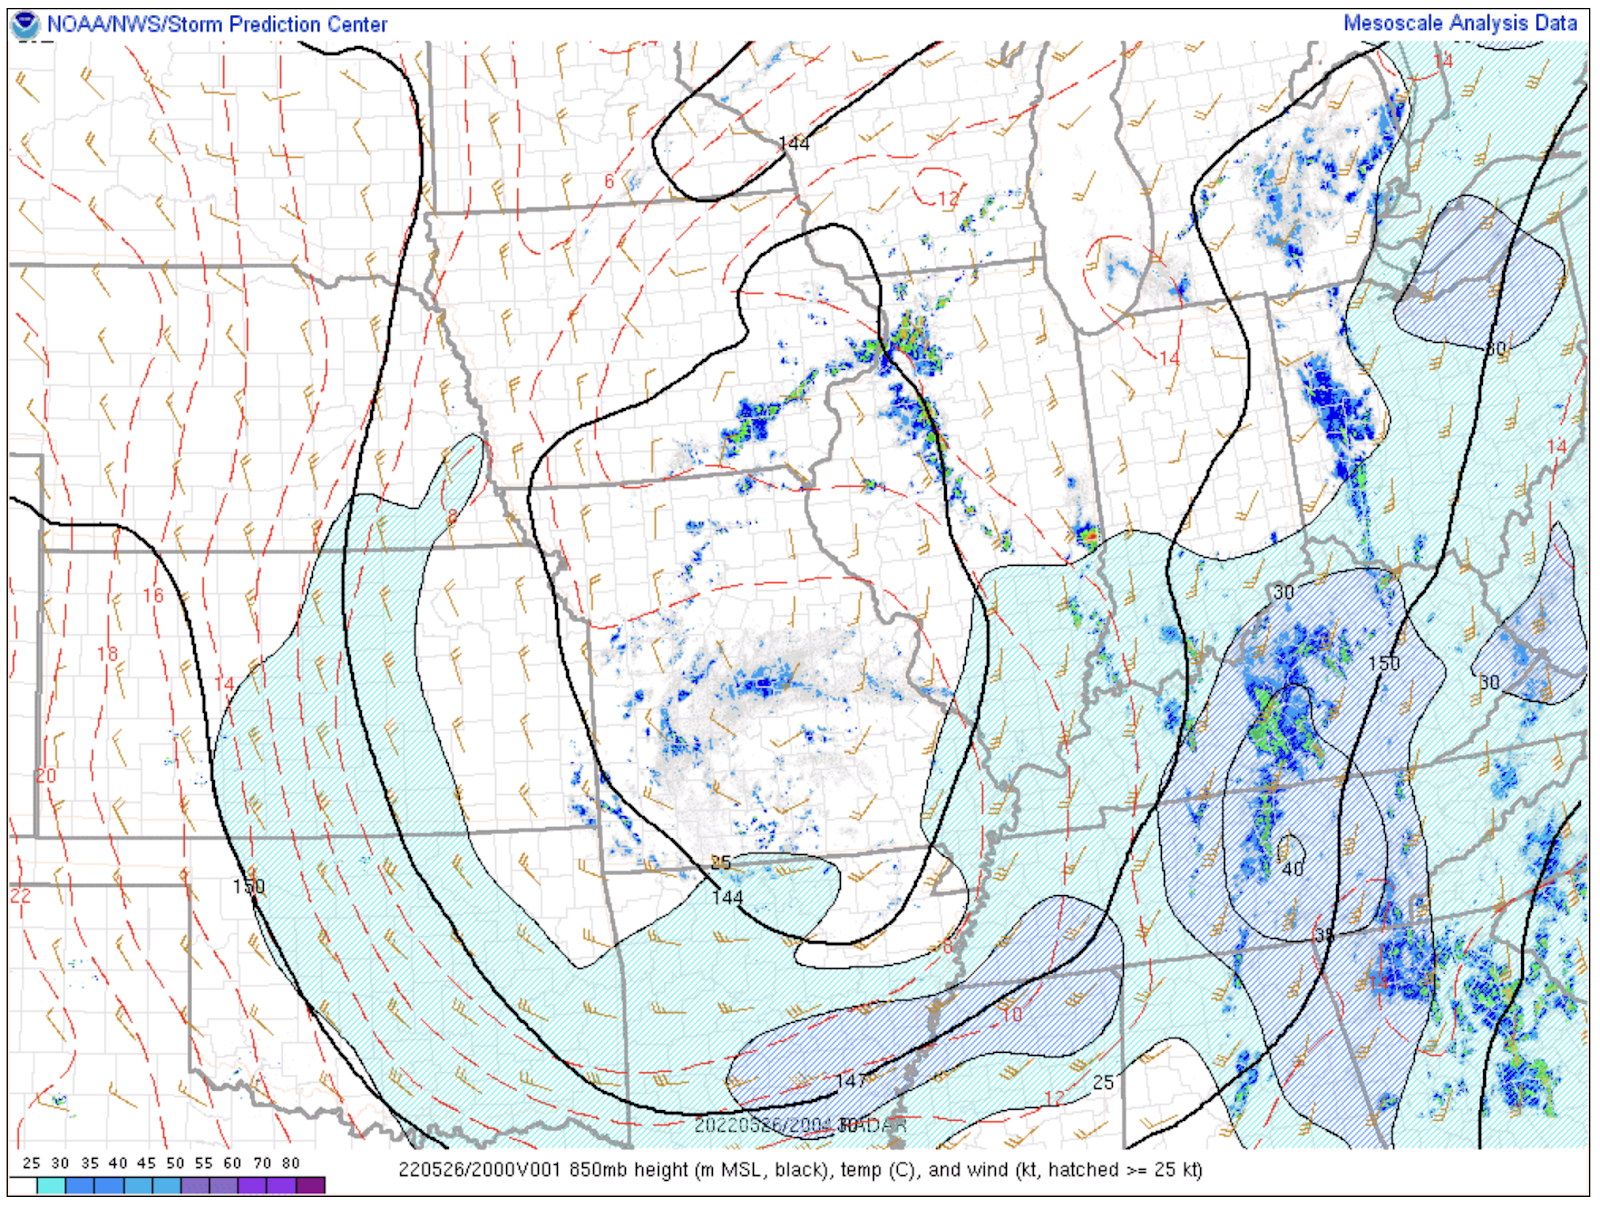
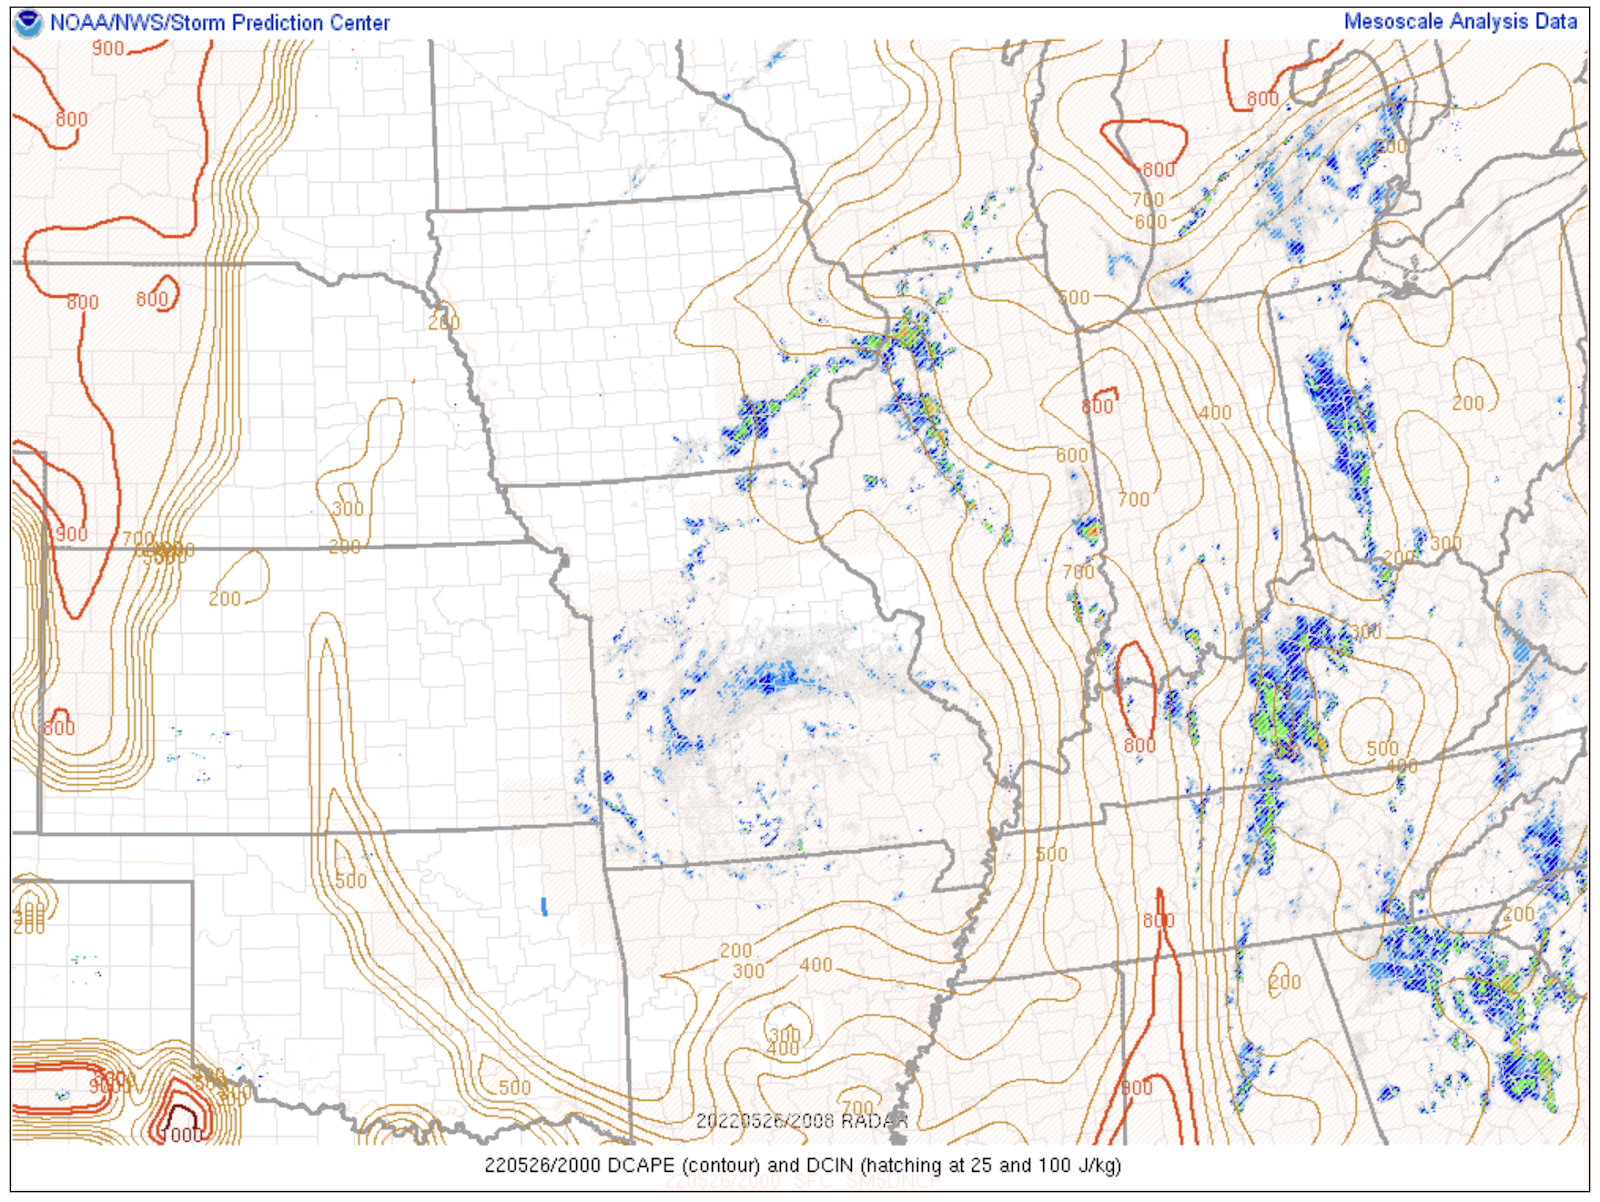
A comparison with SPC mesoanalysis at 20Z showed very comparable PW values, between 1.1 to 1.2 inches over north-central IL, and freezing levels between 10 to 11 kft. As for MLCAPE, it appeared that for both modified and unmodified NUCAPS, the observed was higher than NUCAPS, around 1000-1500 J/kg, perhaps not having a high enough surface dewpoint. As for 850 mb temperatures, they were comparable to those observed, in the 12-14 degC range. DCAPE was also comparable in NUCAPS with what the SPC mesoanalysis page was showing, between 600-700 J/kg.

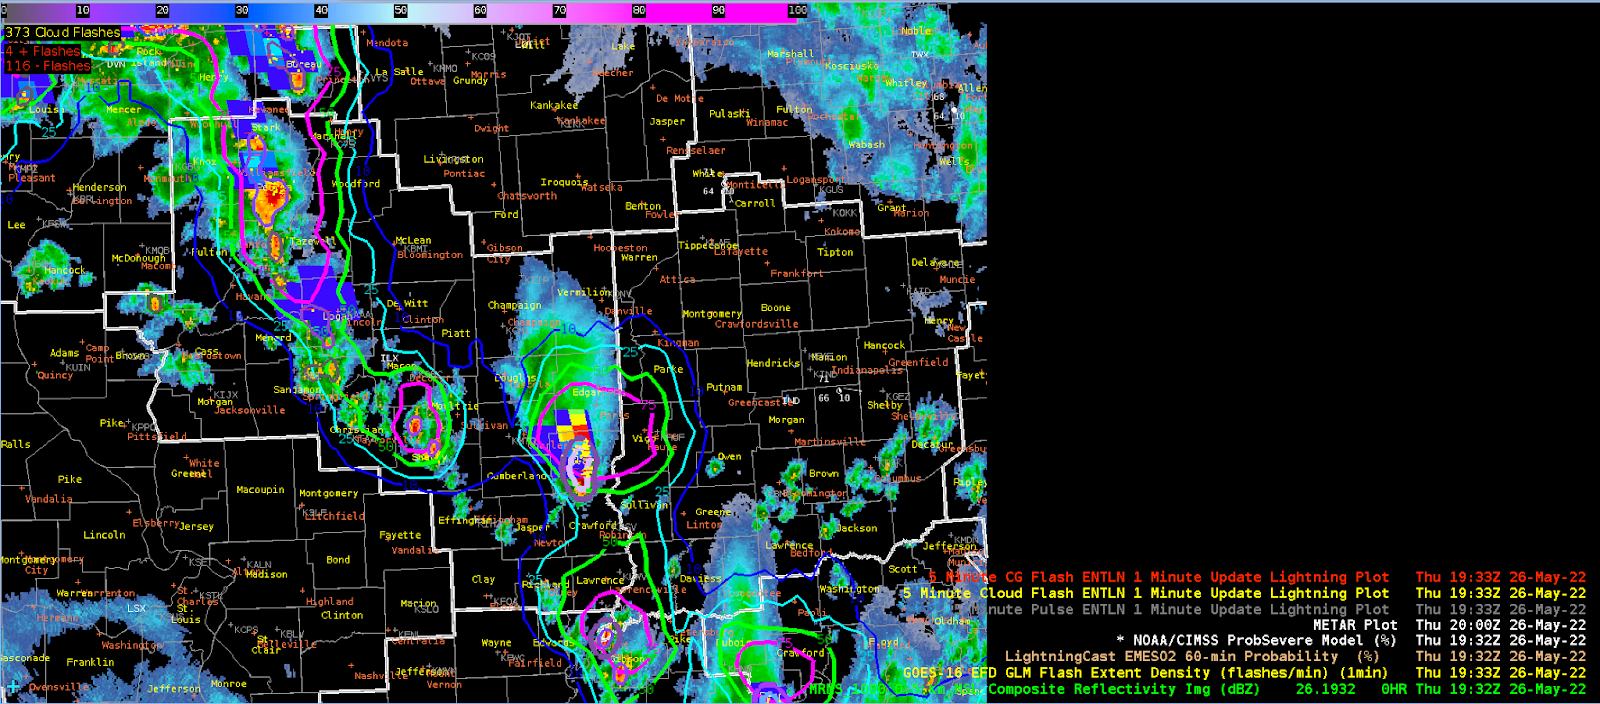
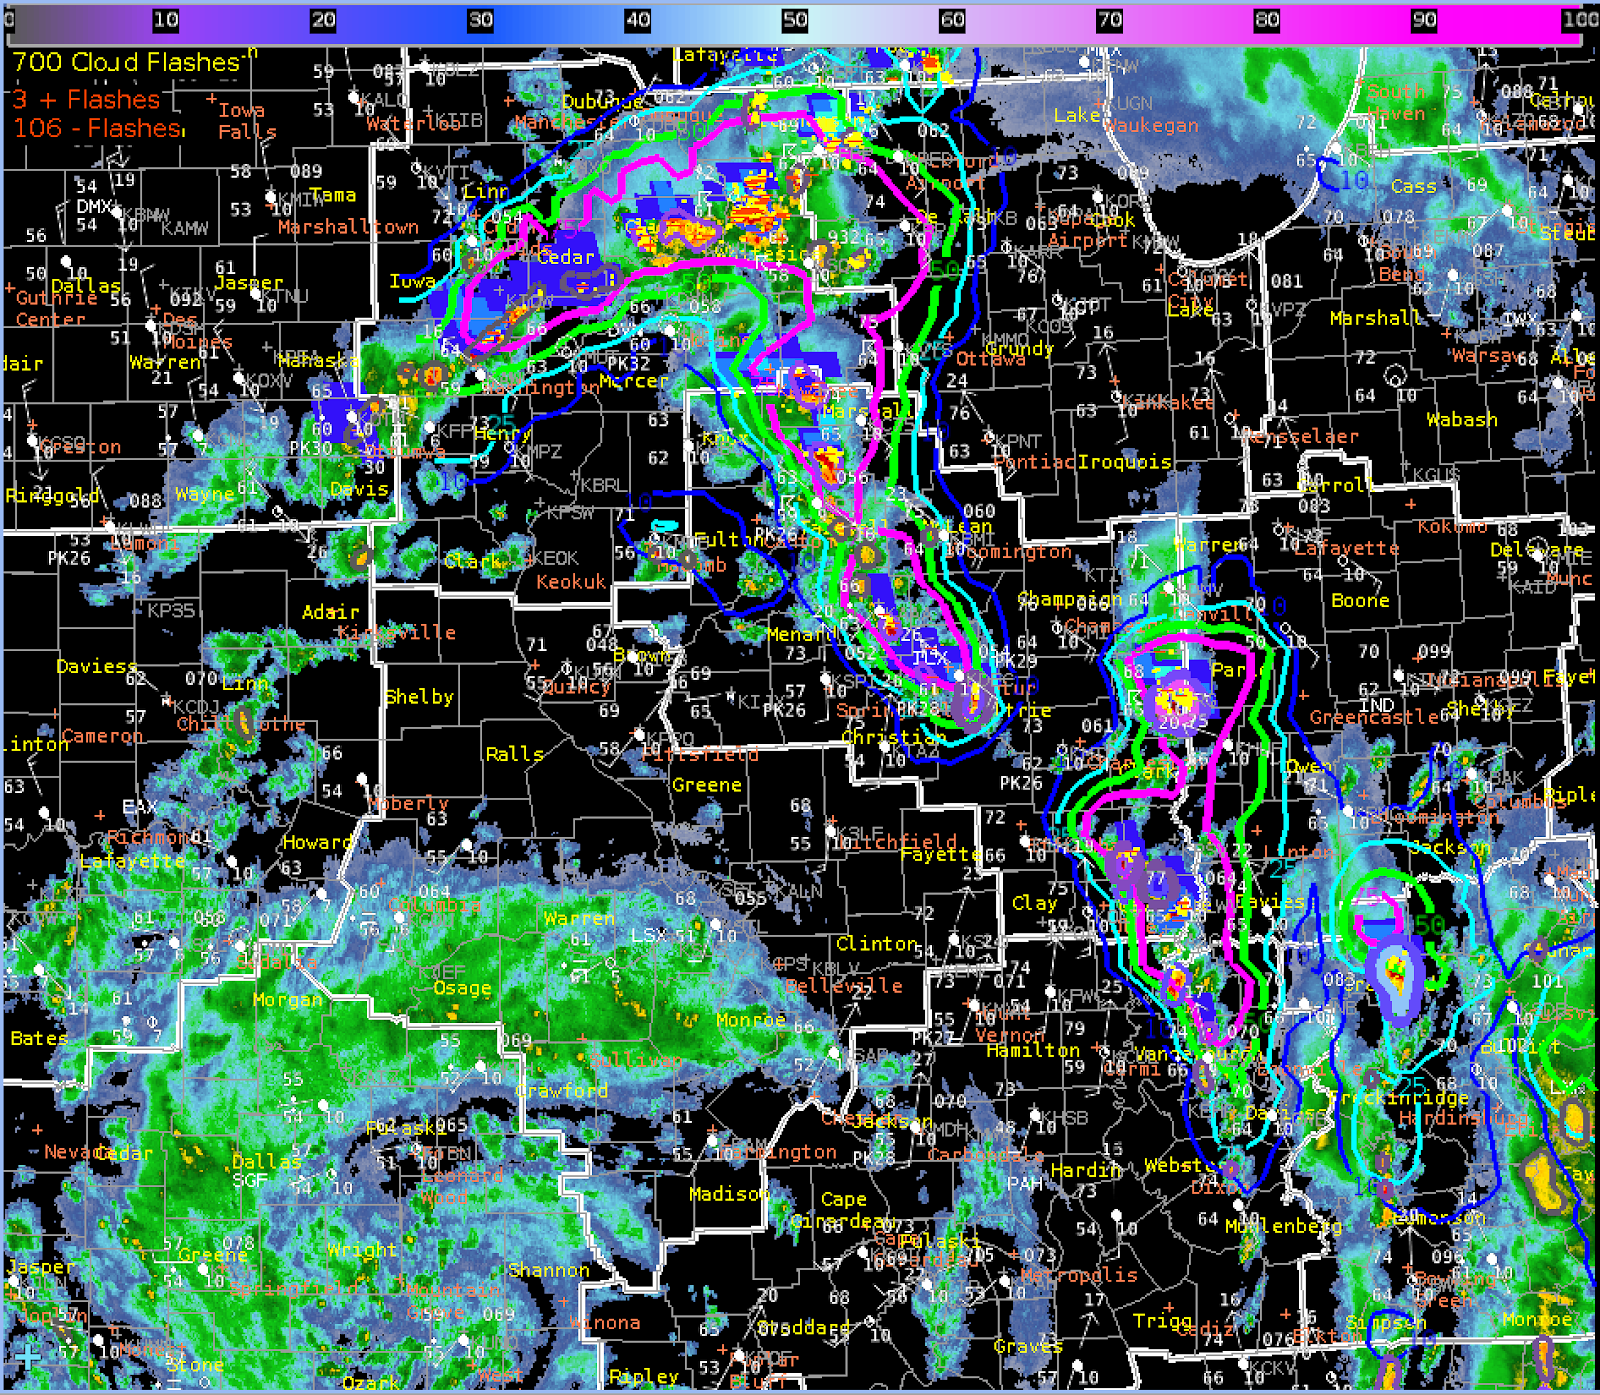
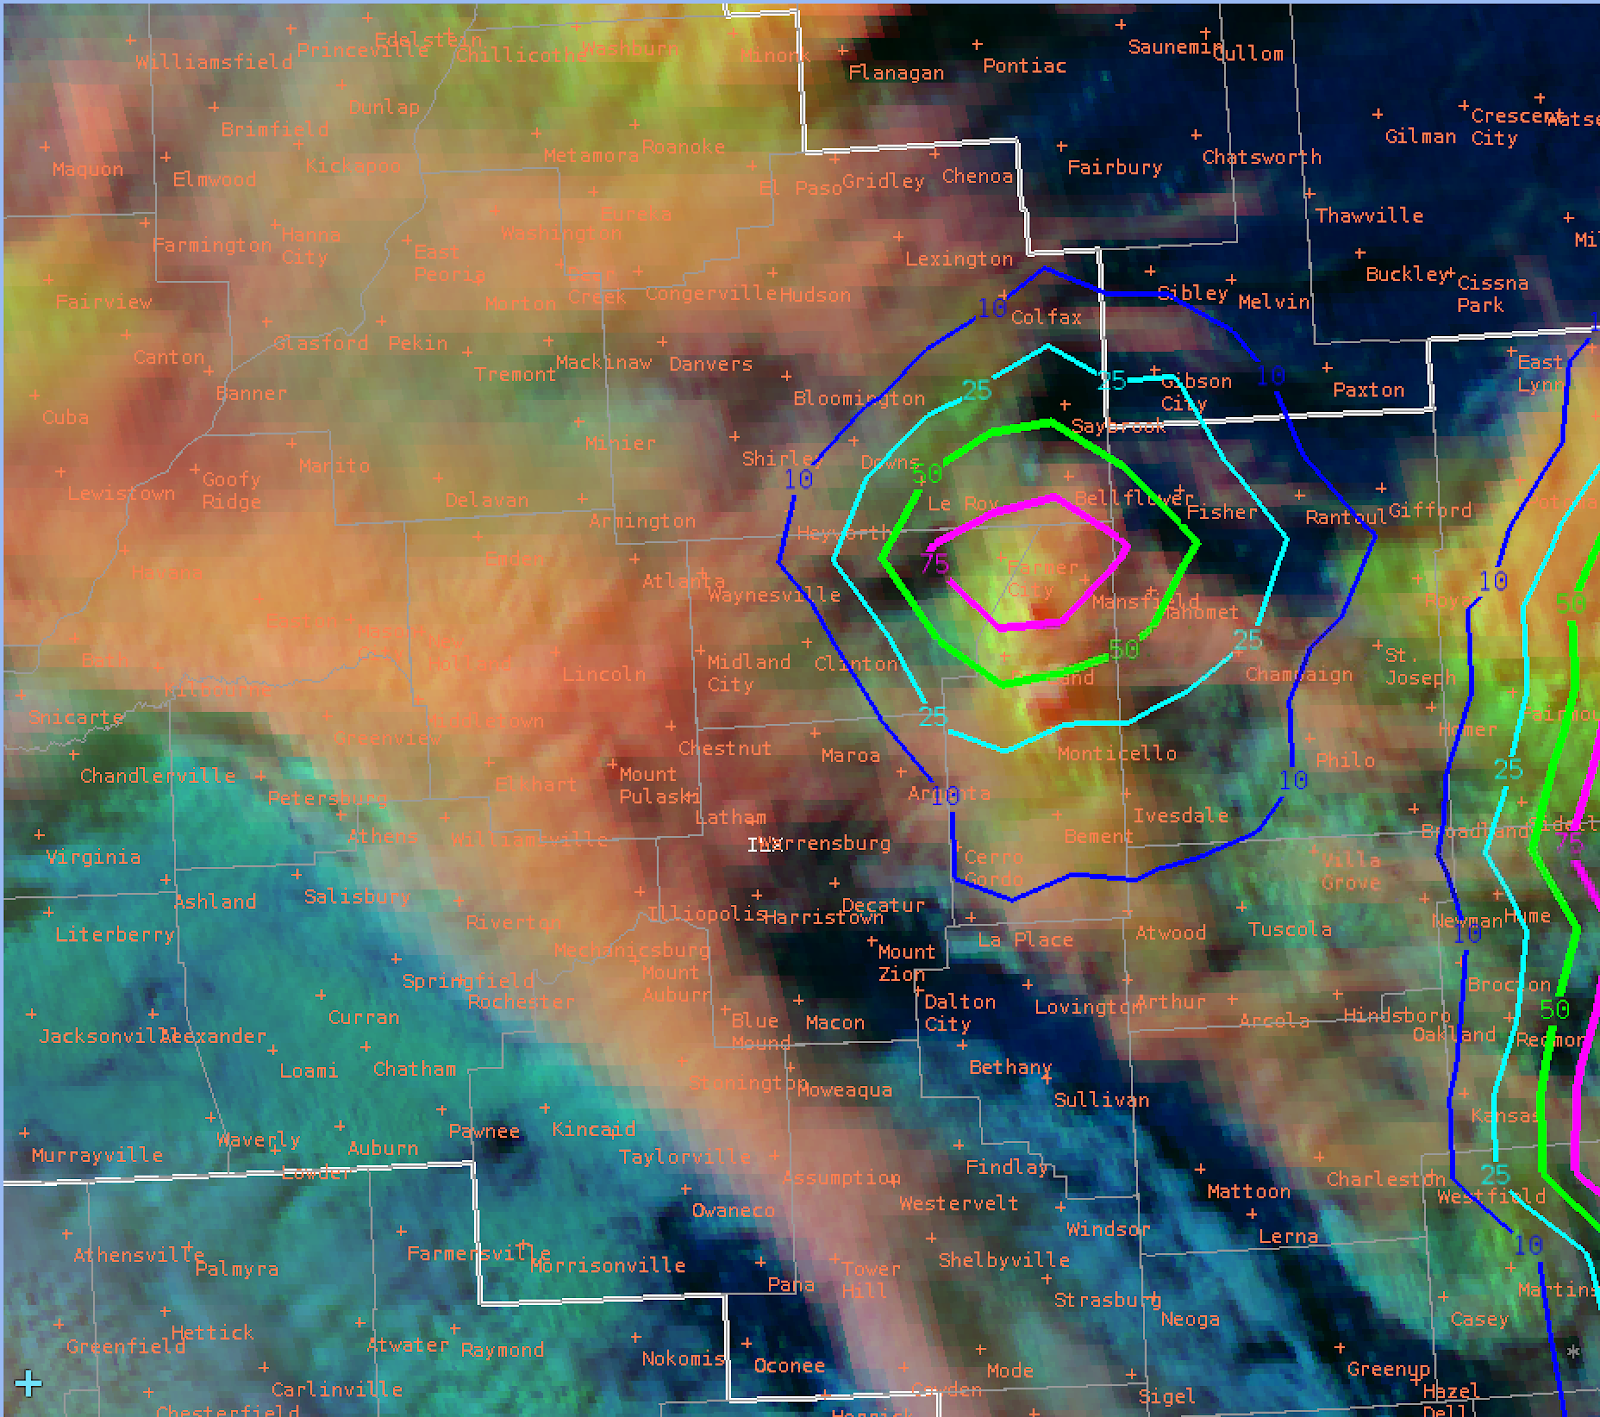
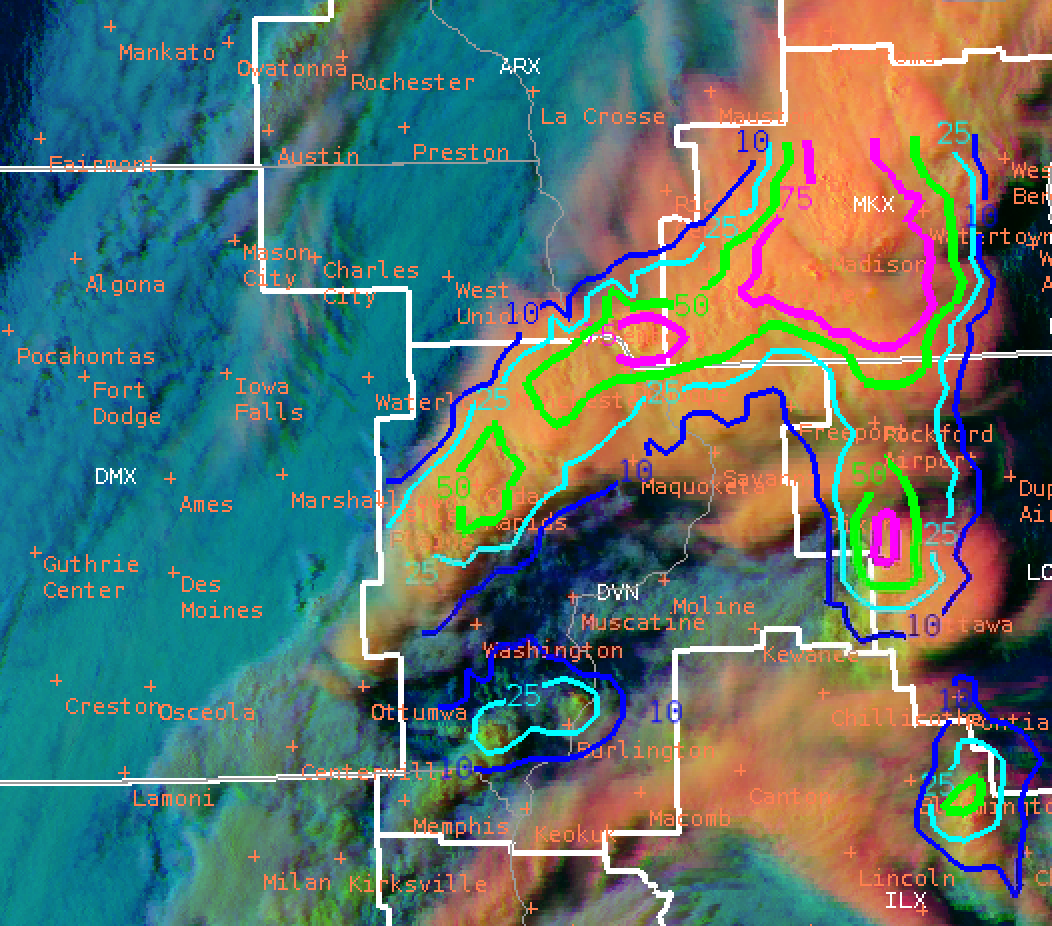
With regards to lightningCAST, ProbSevere, and GLM, around 1932Z, once again the LightningCast was showing good lead time for areas downstream of storms. The main cell at this time I was watching was in the southeast Part of our CWA, which had a nice contour of 75% to the north and east of that cell extending well north of the storm core.

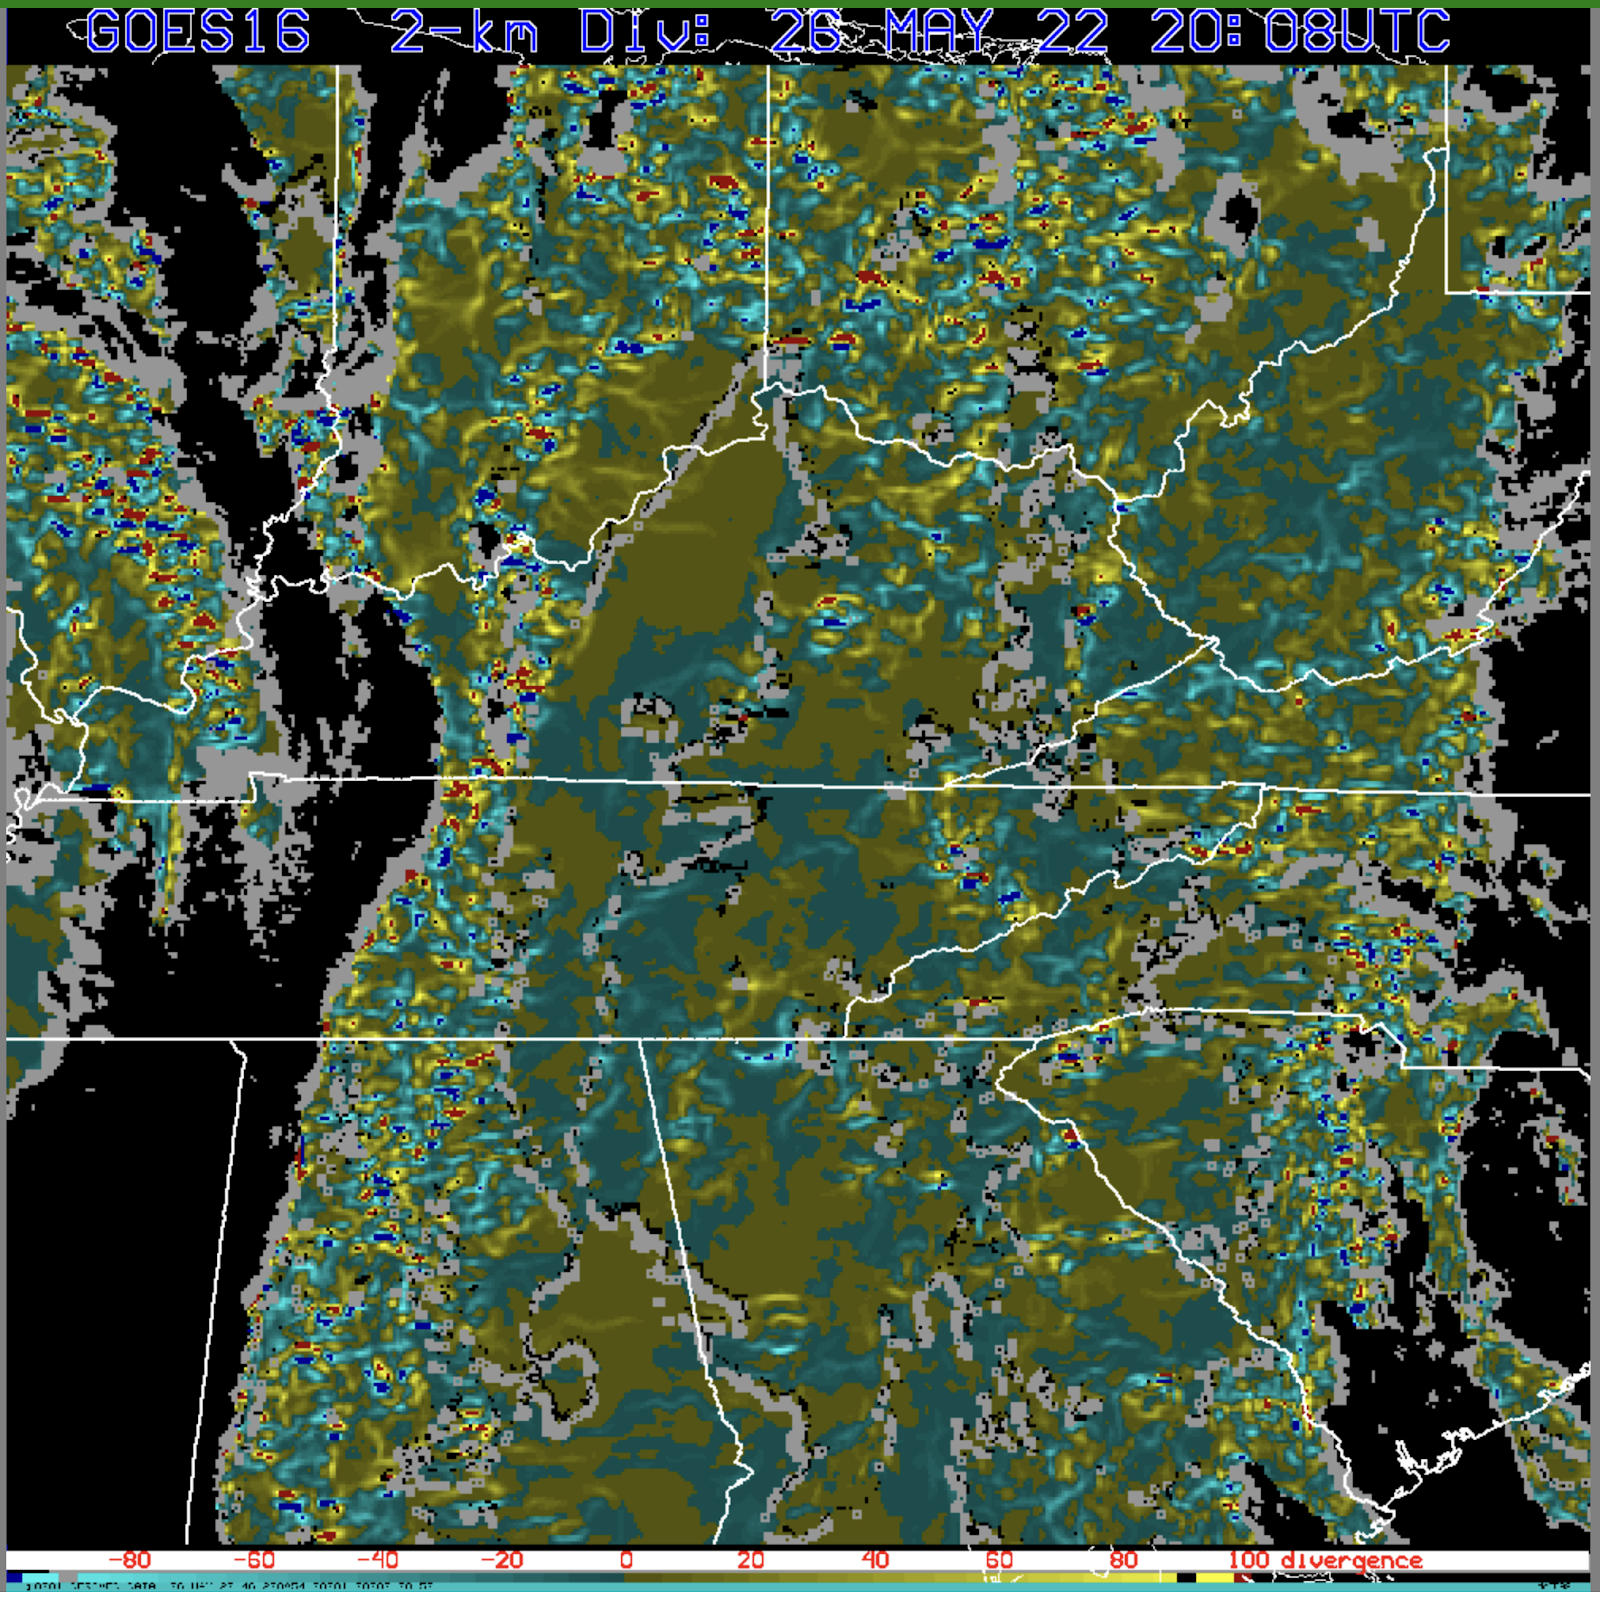
At 20Z, the Optical Flow divergence field appeared to match up well with observed convection at this time. It thus showed quite well with the shear field.

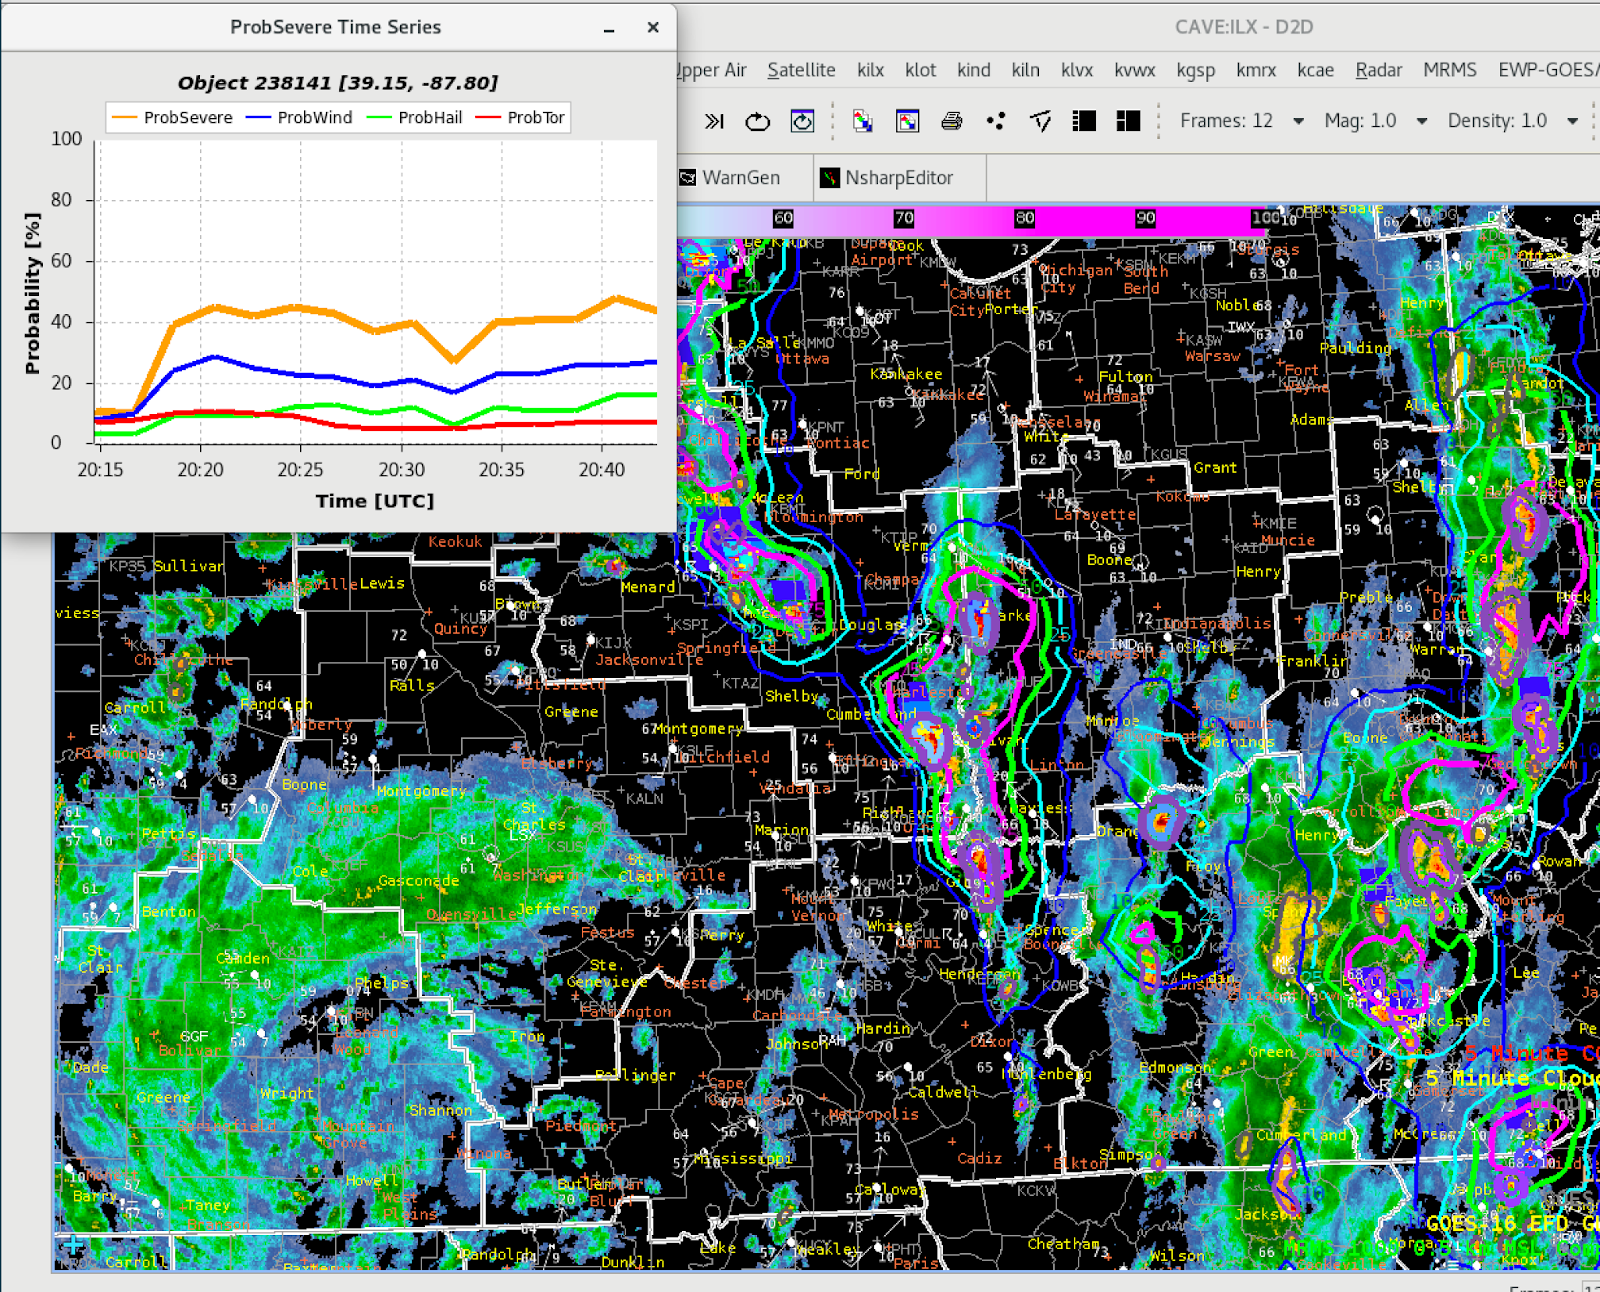
ProbSevere’s time series graph continues to show added value, allowing the forecaster to see the trend in a storm's severity and probability of severe potential. This image was at 20:40Z.

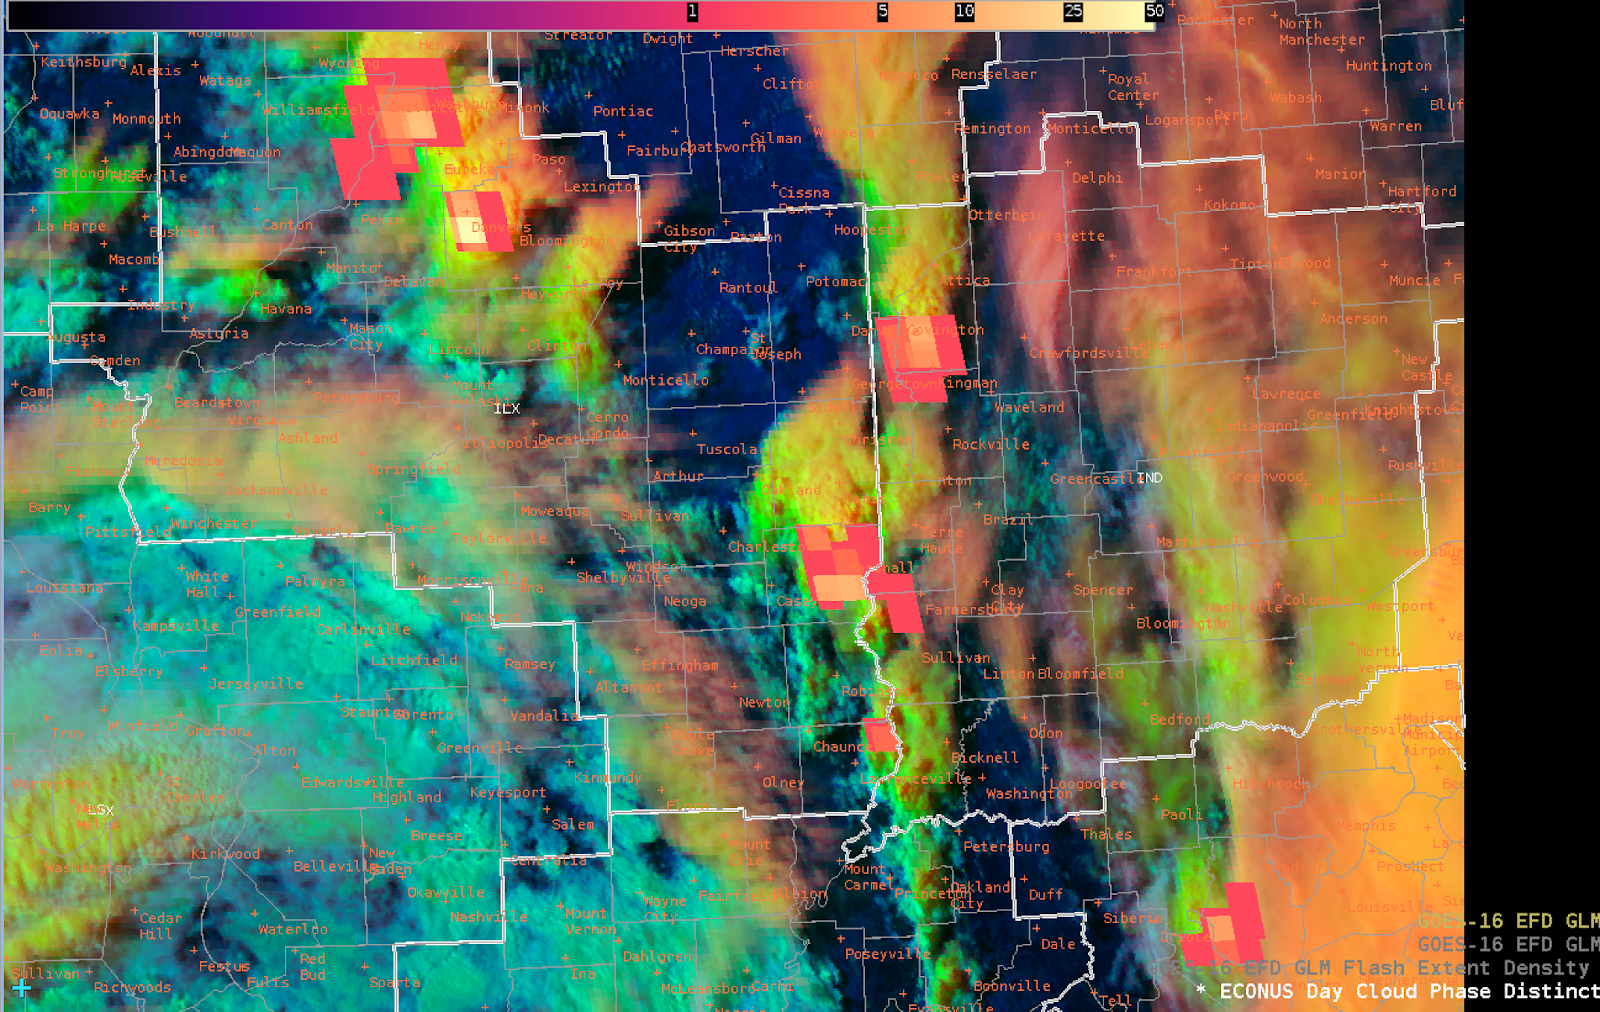
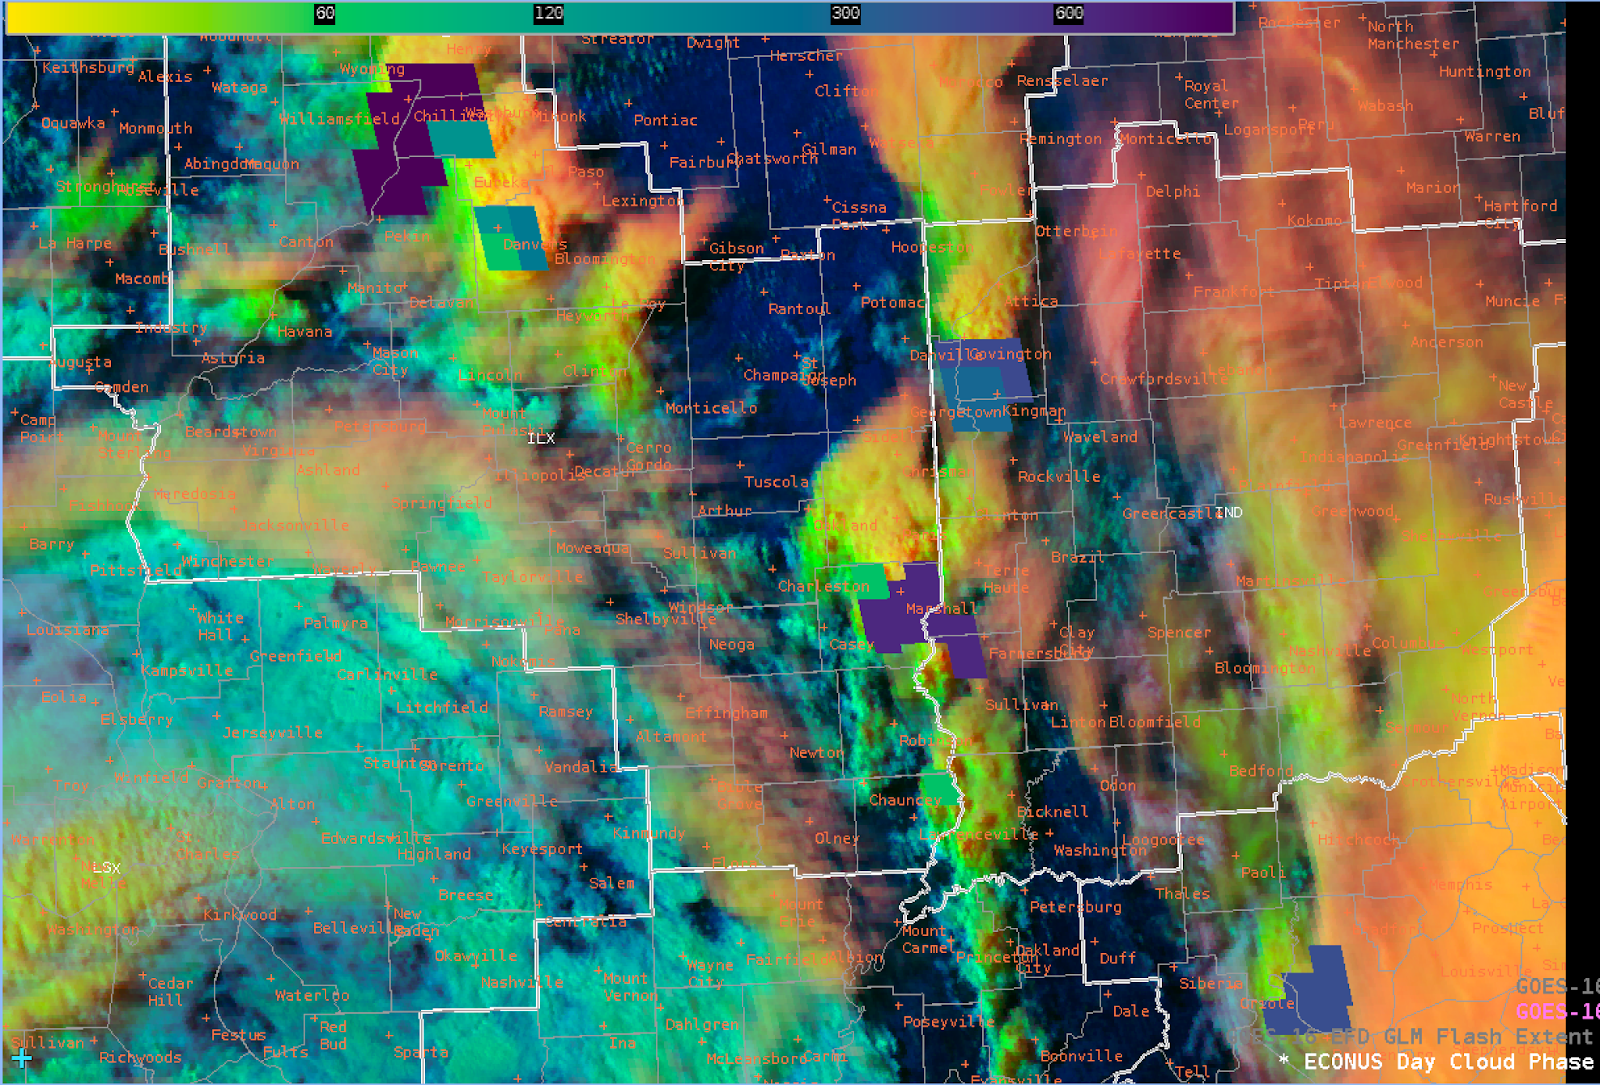
Around 21Z, I noticed a jump in GLM FED for the area of storms in the northwest part of the CWA. Alongside this, the GLM TOE also increased, along with a decrease in MFA with the same storm cell. This area corresponded with increased flash rates in the EarthNetworks. I modified the GLM FED scale to 20-25 as a maximum to see the activity better, as well as lowering TOE to 50 as a maximum.

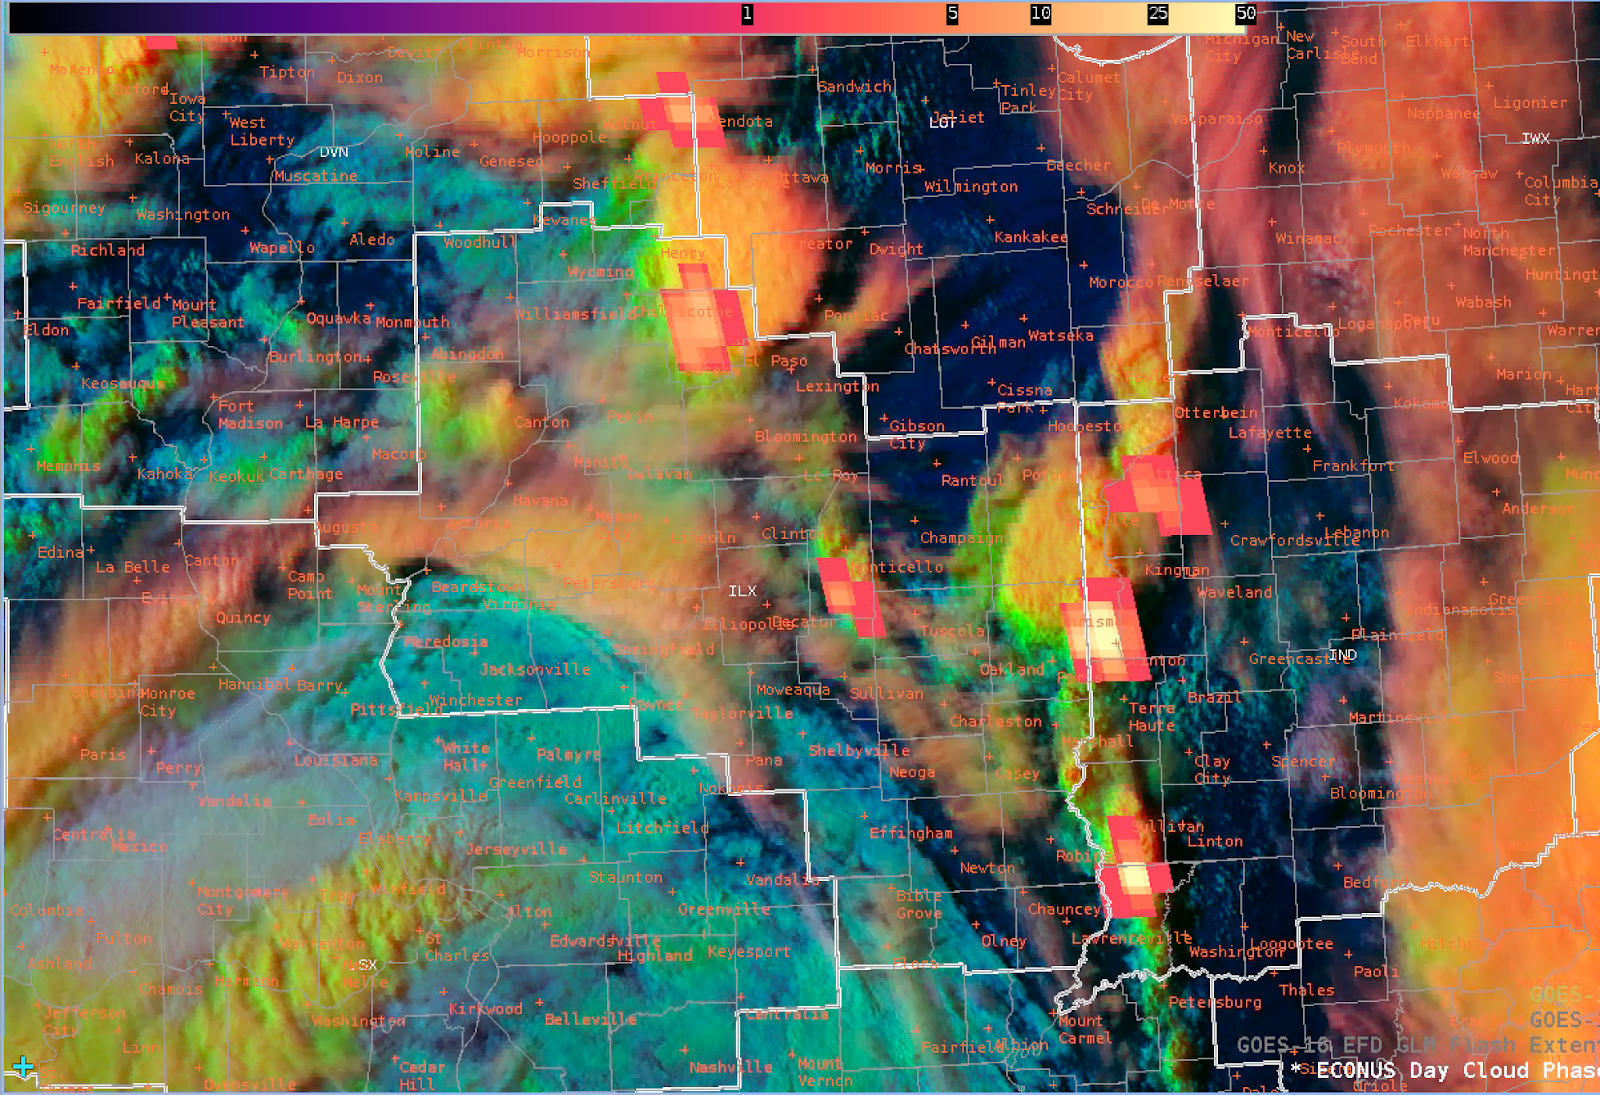
Around 22Z, the GLM TOE showed a good correlation with the 3 strongest storms based on dBZ and ProbSevere, one to the north, and two in the far southeast, bordering Indiana. For this display of TOE, I lowered the contours to a max of 50, which seemed to work well.

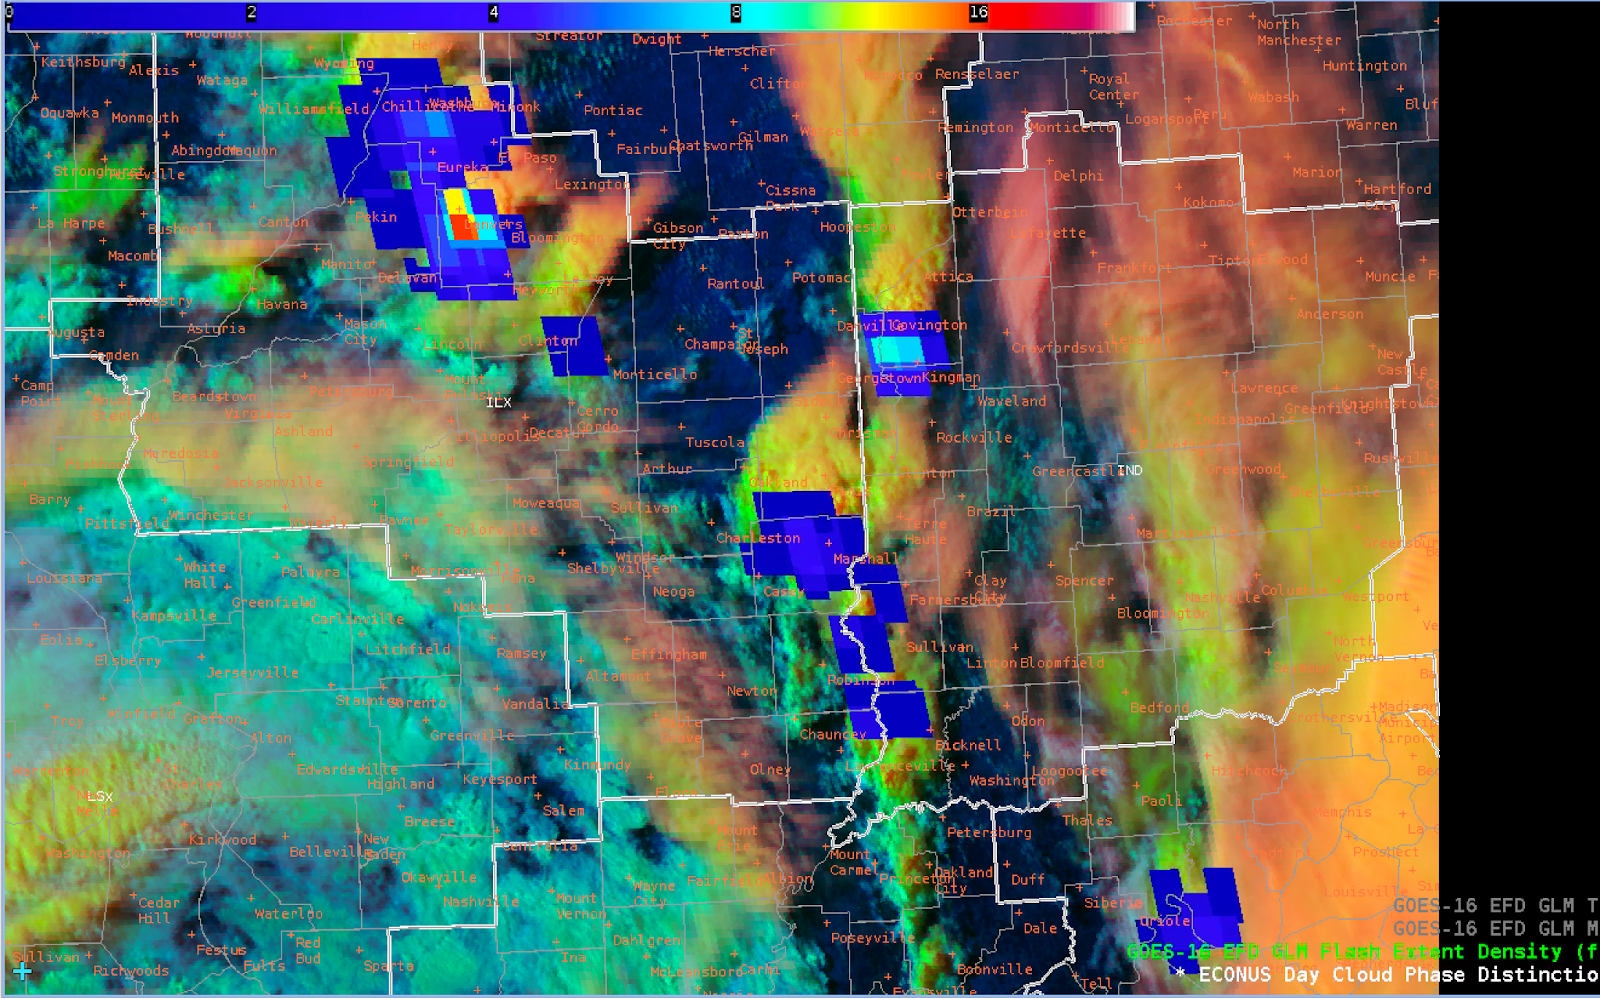
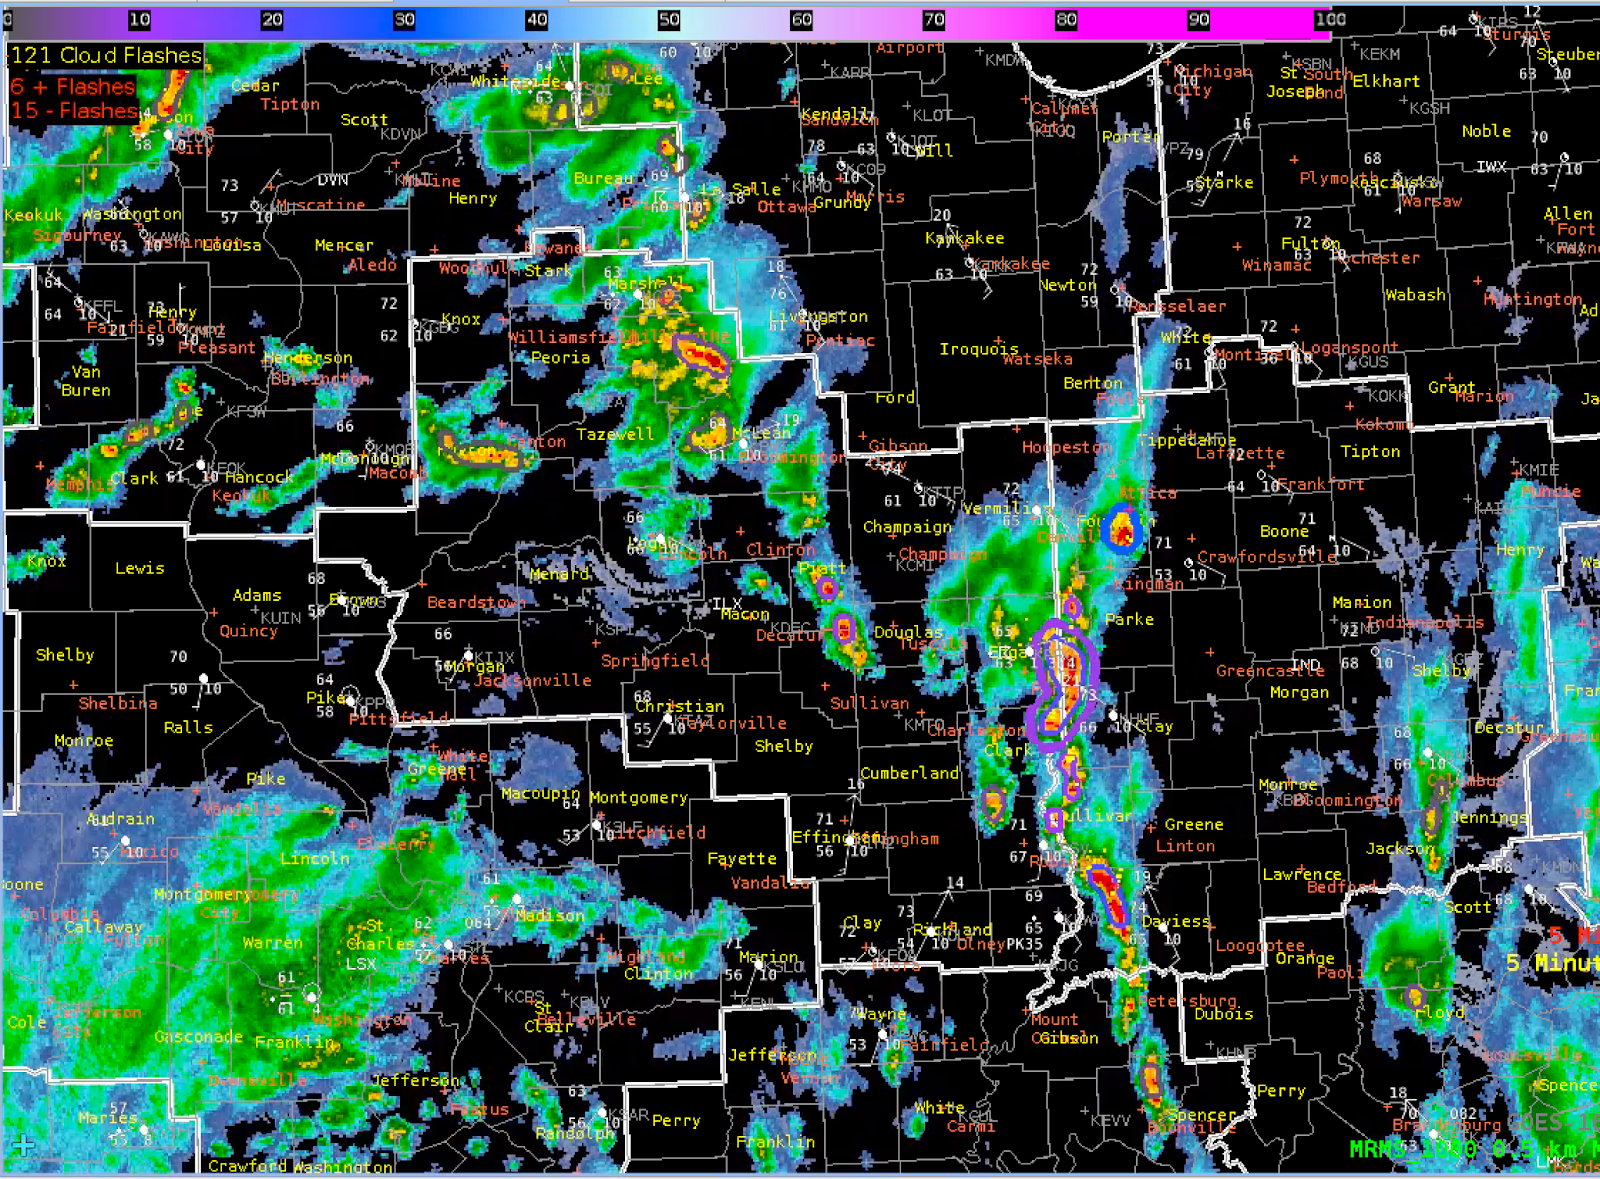
Around 22:12Z, the LightningCast showed an uptick in probabilities of 75% north of a cell that was starting to show towering CU on the day cloud phase. This was before GLM and ground-based radar showed uptick in lightning activity.

Are the edges of LightningCast contours related to the detection of GLM? See below image…The contours do not close off.

Snowfan


Overview of severe weather and products for GSP

An interesting day today. Initially it did not look super favorable for severe weather, with the primary threat being wind. In the end, there was some of that along with scattered hail, but weak tornadoes were the biggest issue.

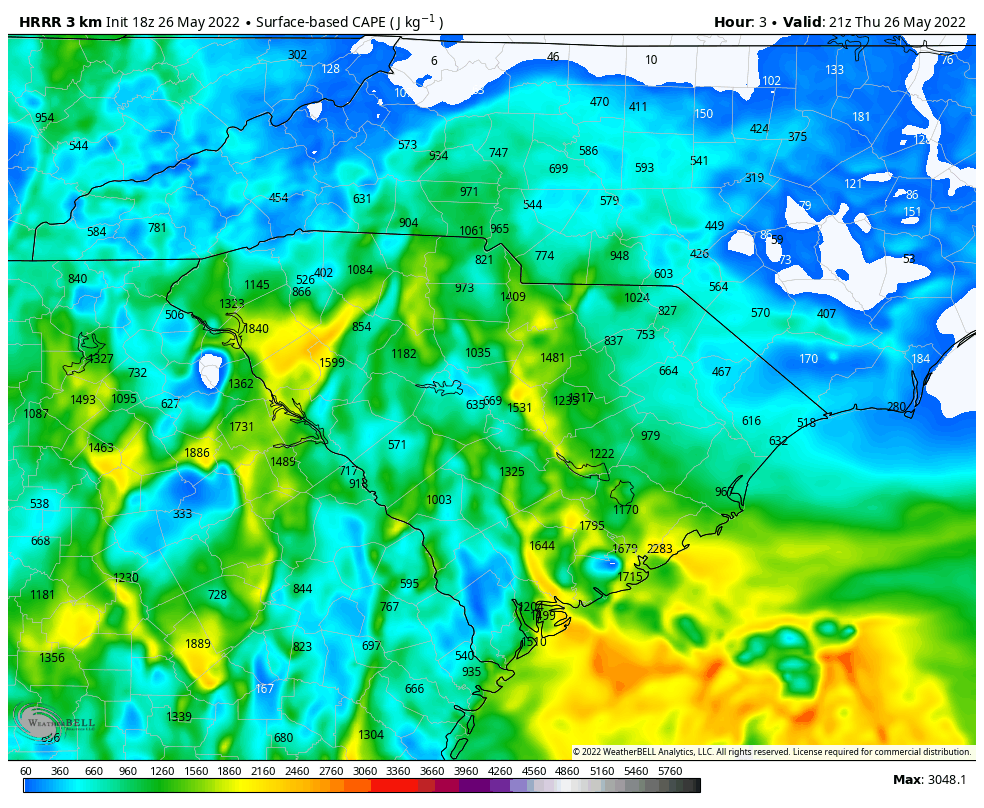
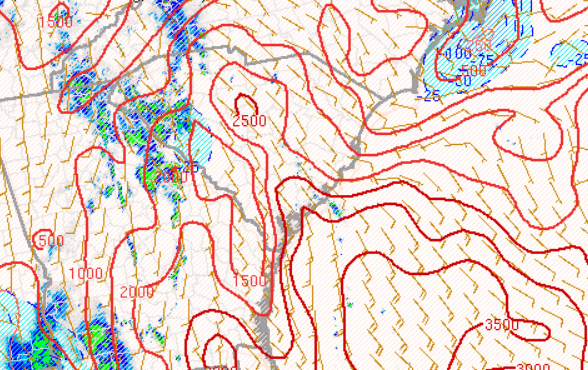
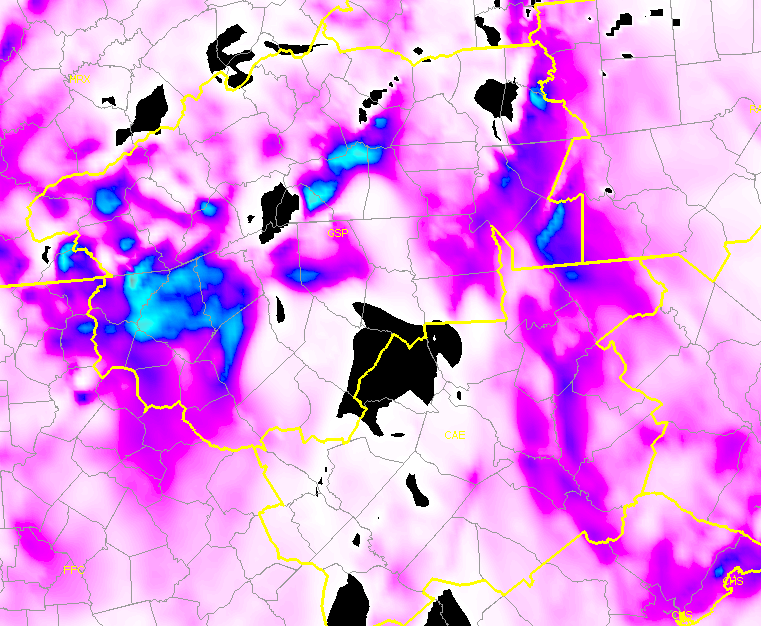
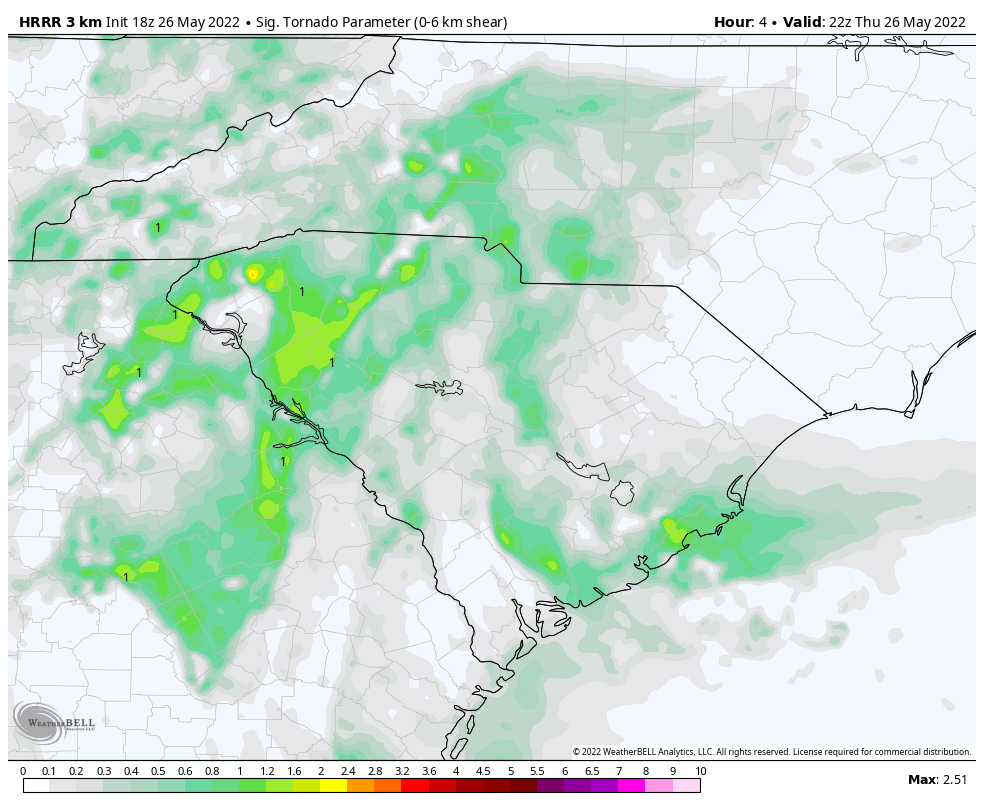
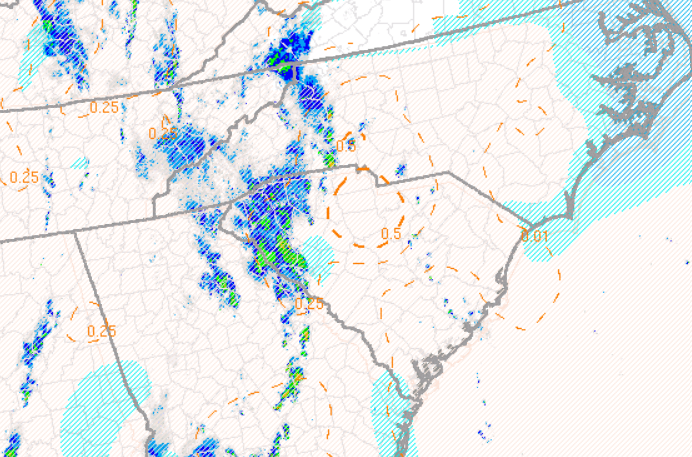
Lets start with some product evaluation. Here are screen shots in order for 21z and 22z. In each case the LHP is shown first, then HRRR, then SPC analysis. This is for CAPE at 21z and STP at 22Z. 

22z

You’ll notice that the HRRR and PHS agreed well and had the right idea. The CAPE in the PHS was higher and closer to reality, but the locations were off. In the end the peak was in the middle of the CWA. Still, not bad. Similar obs can be made for STP.

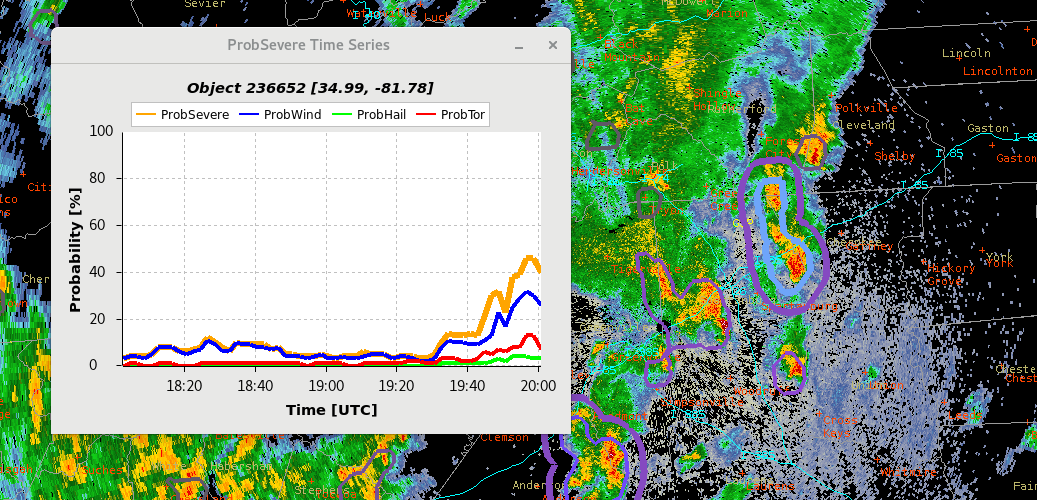
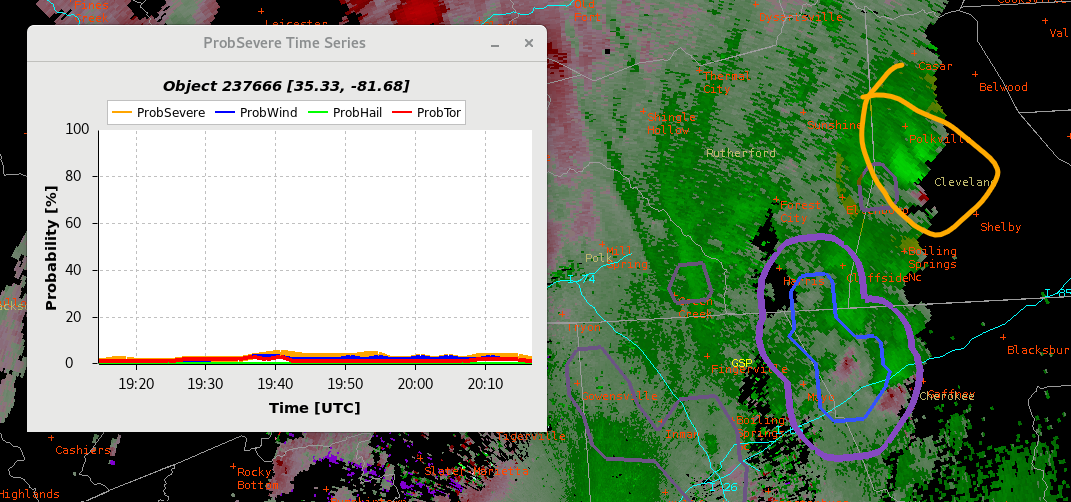
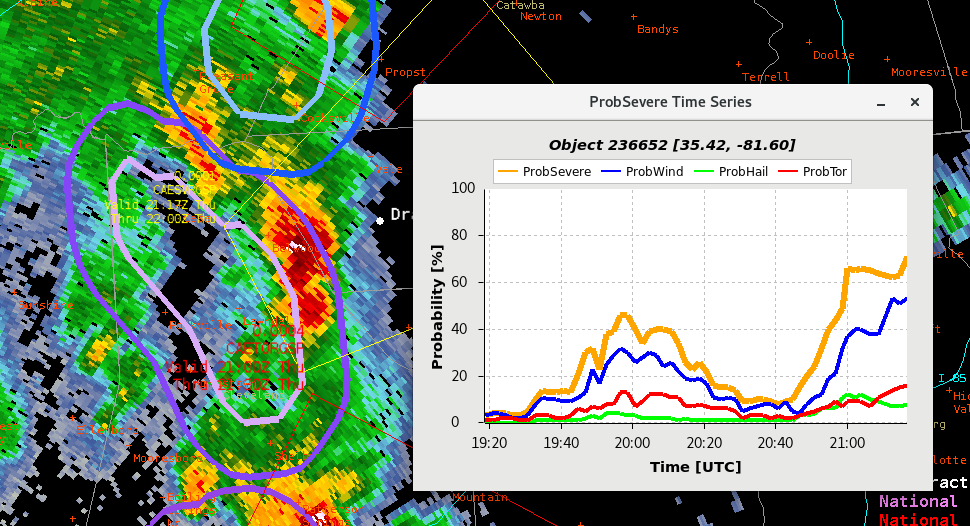
Considering Prob Severe it seemed low on the tornado threat for most of the day but generally did pick up on the emerging tornado threats to a degree. Wind seemed to be running a little hot overall with only 1-2 reports but numerous storms showing decent wind probs.

This shows a few of the Prob Severe time series for possible tornadoes that were warned in real life.  Day cloud phase and GLM were useful in seeing these emerging storms before they produced potential tornadoes.

This storm did eventually produce a wind report and had the highest prob wind all day.

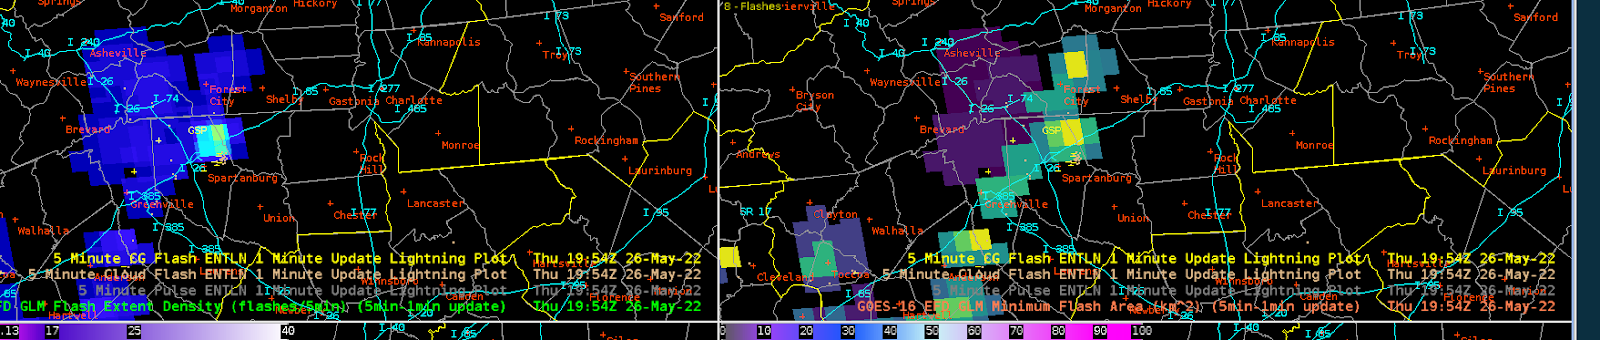
Here is a GLM example showing the min flash area alerting me to threats before FED was showing too much.

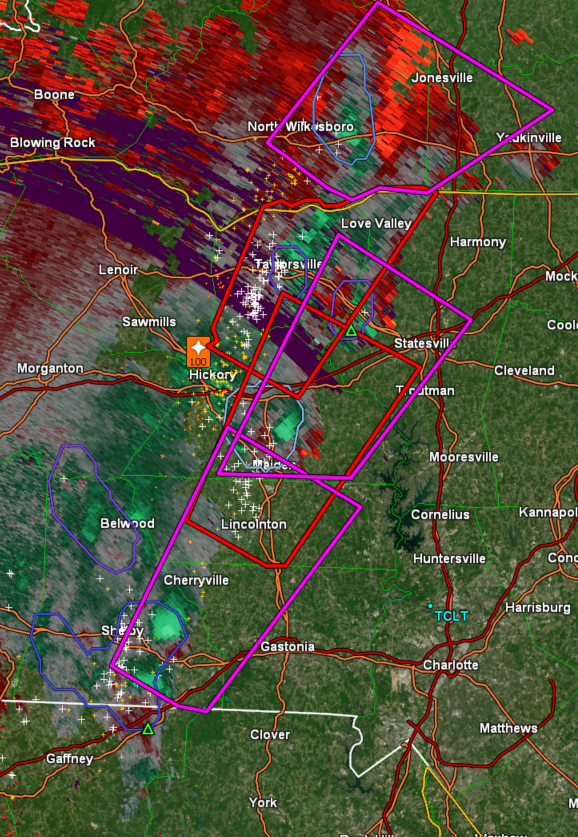
Lastly, it is interesting to consider why we had such a prolific number of weak (potential) tornadoes along the boundary in the middle of the state. It was not particularly impressive of a set up, but something about it was quite favorable in the end. See below with up to 4 circulations at one time. (Real warnings plotted)

Some Random Guy


Thursday, May 26, 2022

LightningCast for a PGA event

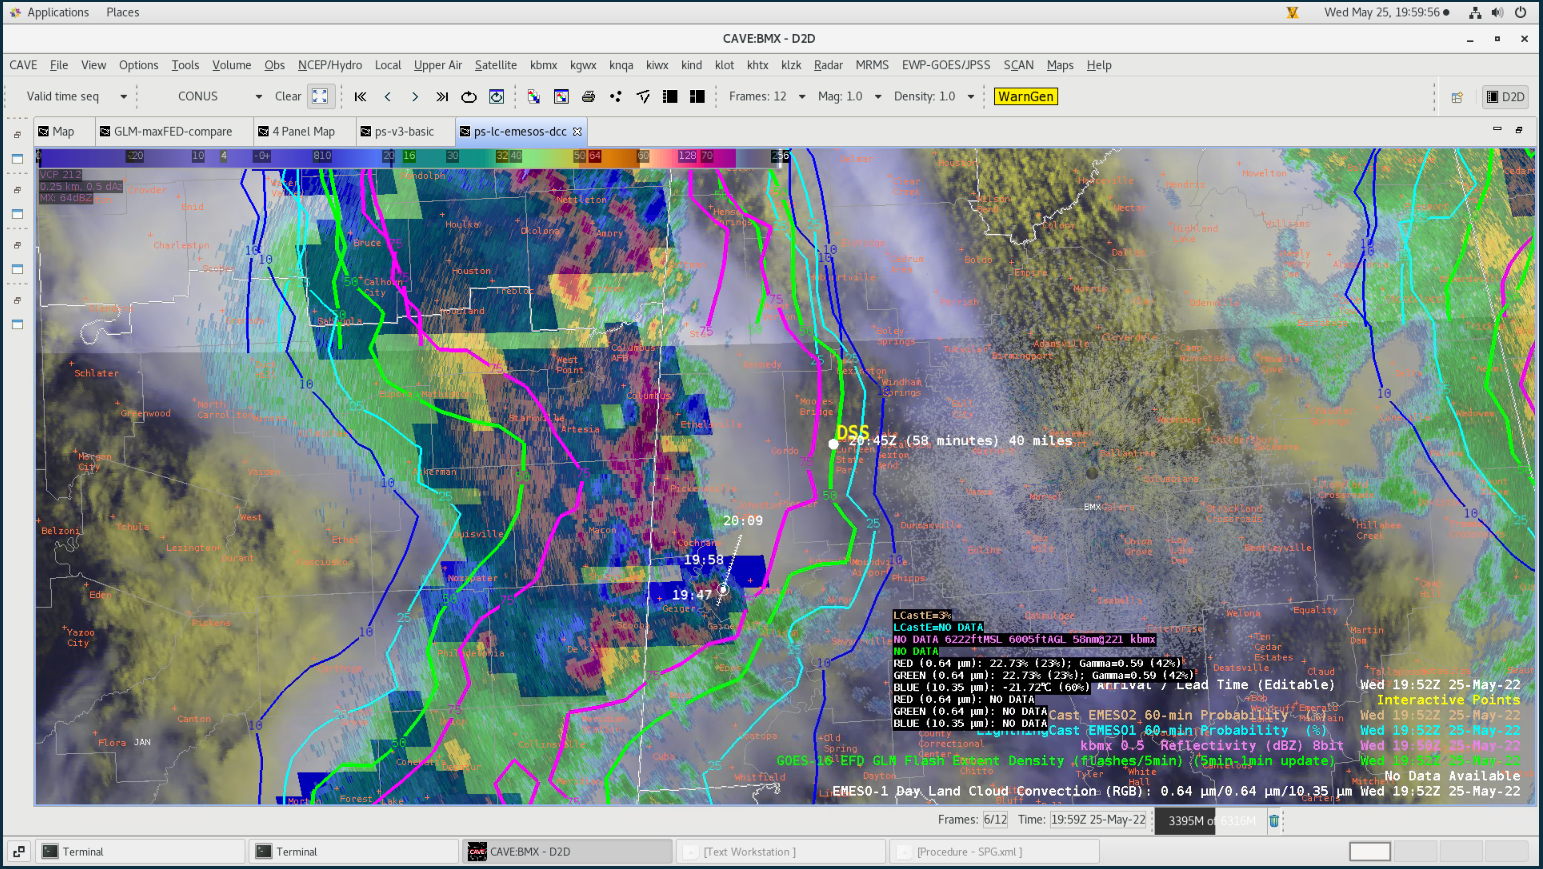
Lightning was a major concern for a PGA event southwest of Lexington, KY. It was a tricky situation, with lots of high cloud cover, but LightningCast gave a fairly consistent signal of high lightning probability near the site (the black "H" in the animation below). One HWT forecaster noted how the probabilities ramped up before the GLM indicated that lightning was advecting toward the event. LightningCast, used with other forms of lightning guidance and interrogation, can help increase situational awareness and confidence for DSS situations.

Figure 1: LightningCast contours (10%, 25%, 50%, 75%), GOES-16 GLM flash-extent density (shaded blue to yellow regions), and GOES-16 ABI Meso2 Day cloud convection RGB (background)


ProbSevere v3 improving upon v2 in Indiana and Illinois

ProbSevere v3 (PSv3) was providing improved guidance to HWT forecasters in Northern Indiana yesterday, compared to ProbSevere v2 (PSv2). Along and south of a warm front, PSv3 was consistently 20-30% higher, with ProbWind showing the highest threat. The shear and CAPE were marginal in this environment, and the lightning and radar-reflectivity parameters were meager in most of the storms. However, the low-level wind field (evident in ProbSevere's 1-3 km AGL MeanWind predictor) was quite favorable for a severe wind threat (30 - 40 kt).

Below are several sampled storms in AWIPS showing much higher PSv3 values, compared to PSv2. Each of these storms went on to produce one or more severe wind reports. A post-mortem analysis of each storm revealed that the 1-3 km MeanWind, the 0-3 km lapse rate, and the STP (effective layer) were among the most important predictors for these storms. The normalized satellite growth rate was also a strong contributor, as well as the ENI lighting density, in several stronger storms. 


DSS in the Birmingham CWA

 PHS

The initial outlook on the PHS model shows limited potential in the CAPE and STP in this area around the DSS at 20Z. However, it shows an increased potential for 21-22Z which may be the time of most concern for my DSS area.
The initial 20Z model showing limited instability and the contoured ProbSevere to show ongoing convection.

PHS shows a tongue of instability and associated STP as the main convective line lifts northward. This would indicate that the main concern would occur around 22Z.

Based on the line of storms to the west of our DSS event and the associated shower activity lifting northward ahead of the line, the PHS model was accurately representing the convective potential. LightningCast also shows a decrease during this time period which increases consistency and confidence in what the forecaster is seeing.

"Verification"

This lack of convection was observed as showers moved through the area without any lightning or wind potential. There was some redevelopment behind the line and to the south of our event that indicated some concern. At 22Z, you can see the line of storms already being analyzed by ProbSevere lining up nicely with modeled instability and other plotted severe weather parameters.

ProbSevere contours and PHS model line up nicely in the 22Z 2-hour model forecast and show consistency in where the area of greatest concern is likely to be.


LightningCast & GLM for DSS

Initially the LightningCast for our DSS event surged to near 50% or slightly above. This was an initial concern for the DSS area.

As these storms weakened, the probabilities of lightning also fell to under 25%. I liked that these probability decreases were not rapid, but a gradual fall after the initial peak. GLM and LightningCast both had a consistent drop in probability and lightning activity as the “storms” weakened.

It is becoming clear that the rate of change of all of these satellite products is the most important information that a forecaster can gain. While an initial picture of the probabilities looks concerning, pairing this with other satellite products for context and seeing the overall trend of this data led to an easy decision to wait for additional data. Taking this at face value would lead to a quick (and potentially unnecessary) reaction.

Initial threat of lightning as illustrated by the LightningCast product.

The showers on the SE side of this line have decreased in intensity and have lost most of their lightning potential. The probabilities have decreased accordingly.

LightningCast, GLM, radar, and satellite showing the decreasing trend in lightning threat and the approach of moderate to light showers on the DSS event.

Showers are expected within the next 30-40 minutes and the trend in lightning appears to be going down consistently. GLM has also been helpful in showing that no cloud flashes have been observed at this stage.

There were some minor inconsistencies that I noticed since the Meso-sectors were both over our CWA. These were mostly minor, but I noticed at one point, a location had a probability of >50% or 0% and did not intersect with GLM measurements.

Inconsistencies in GLM and LightingCast Meso1/Meso2 probabilities. It seems the accurate probability here was 0% based on the lack of ground-based lightning network reporting.

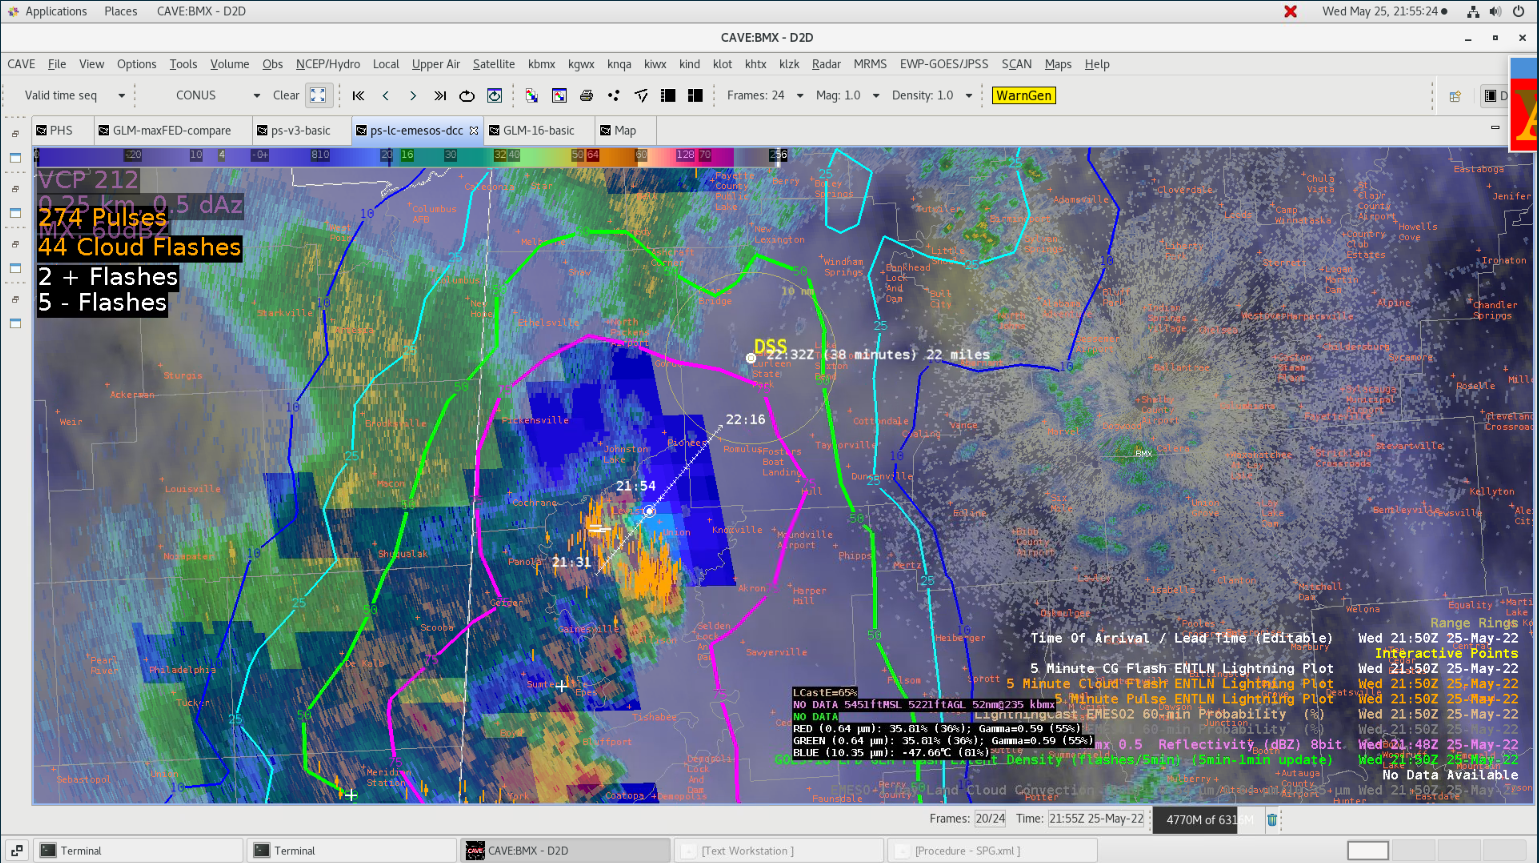
As PHS indicated there was a second and more concerning wave of convection moving from the SW toward the DSS event area later in the afternoon. GLM and LightningCast probabilities both show the strengthening of this pulse and the increased lightning activity as it moved into the BMX CWA.

21:26Z, the storm indicated a 10% chance of lightning at the DSS event area.

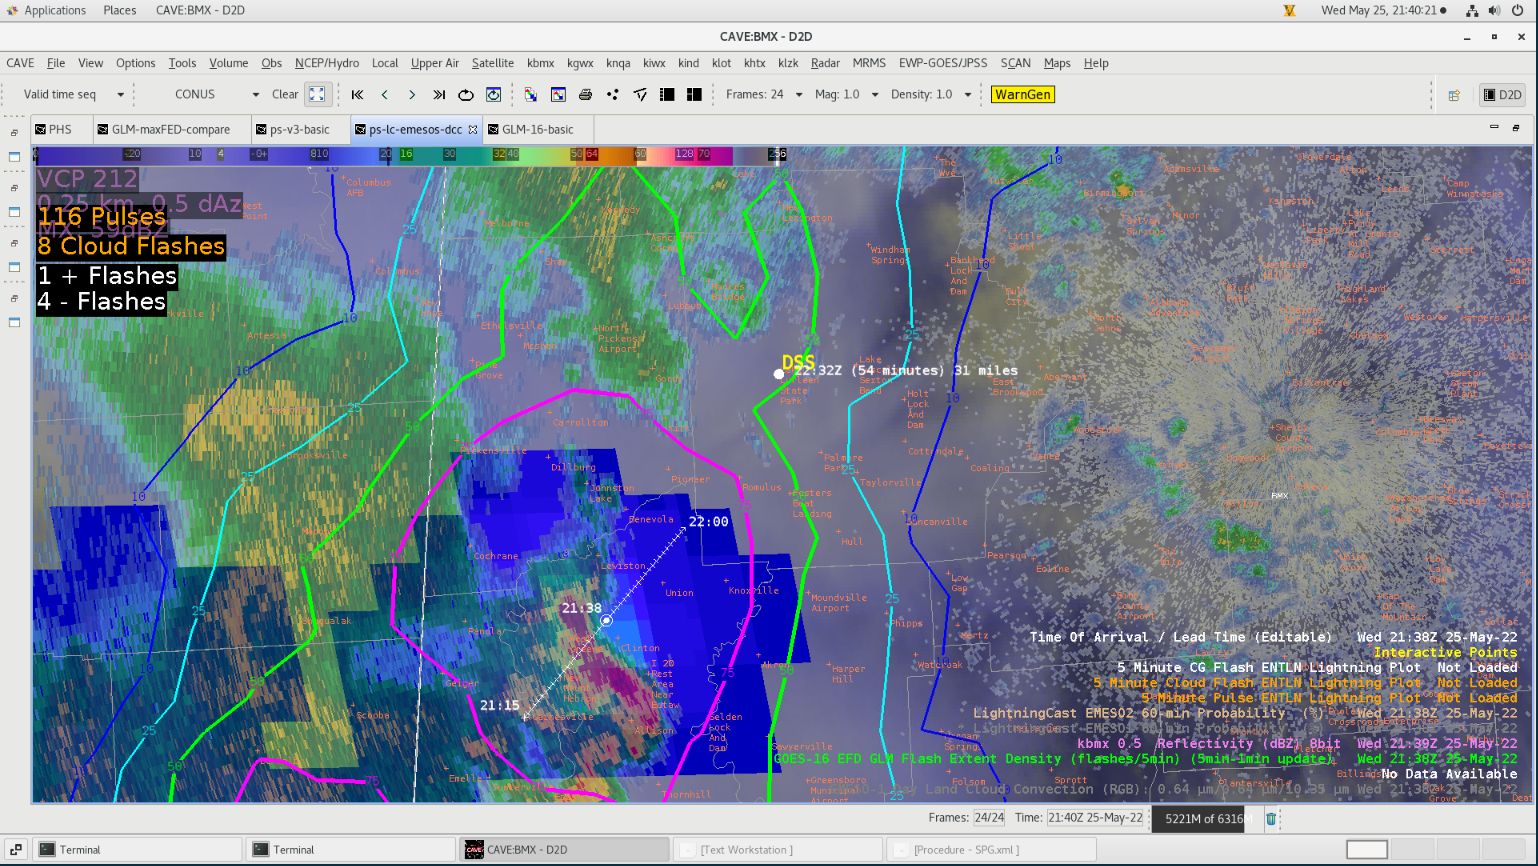
21:36Z, the storm indicated a 50% chance of lightning at the DSS event area.

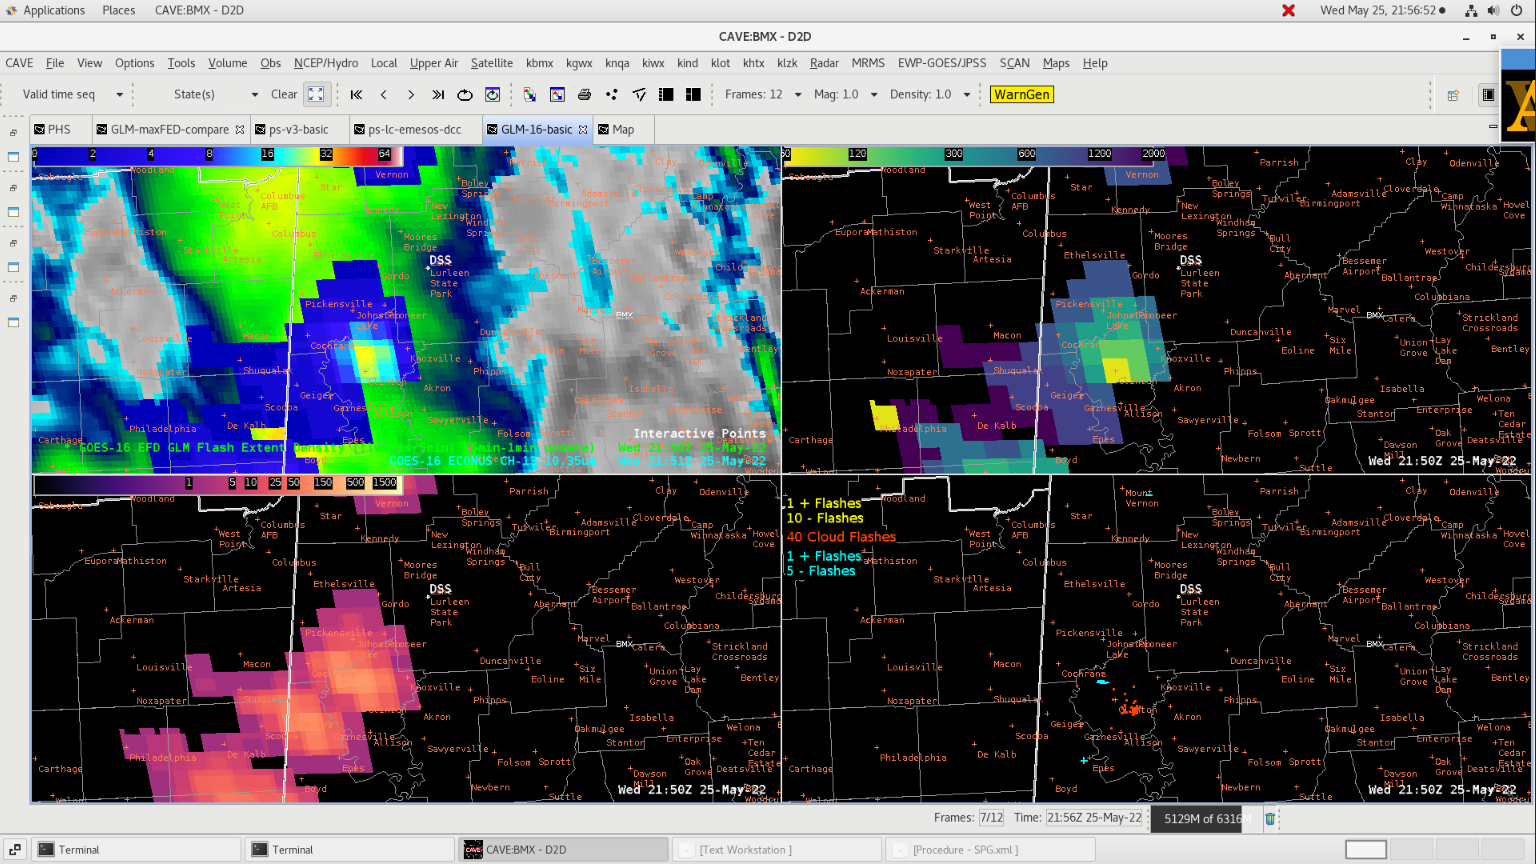
The 45-minute warning was given at 21:50Z to the event coordinator that a storm with the potential of producing lightning and winds in excess of 30 mph was approaching the event area. GLM was a key part in this decision as it continued to show strengthening with lightning pulses indicating that the storm was at least maintaining its strength. The LightningCast probabilities were also increasing as they approached the area with the 75% contour moving into the area by 21:52Z.

GLM (top) and LightningCast at the 45-minute DSS decision point.
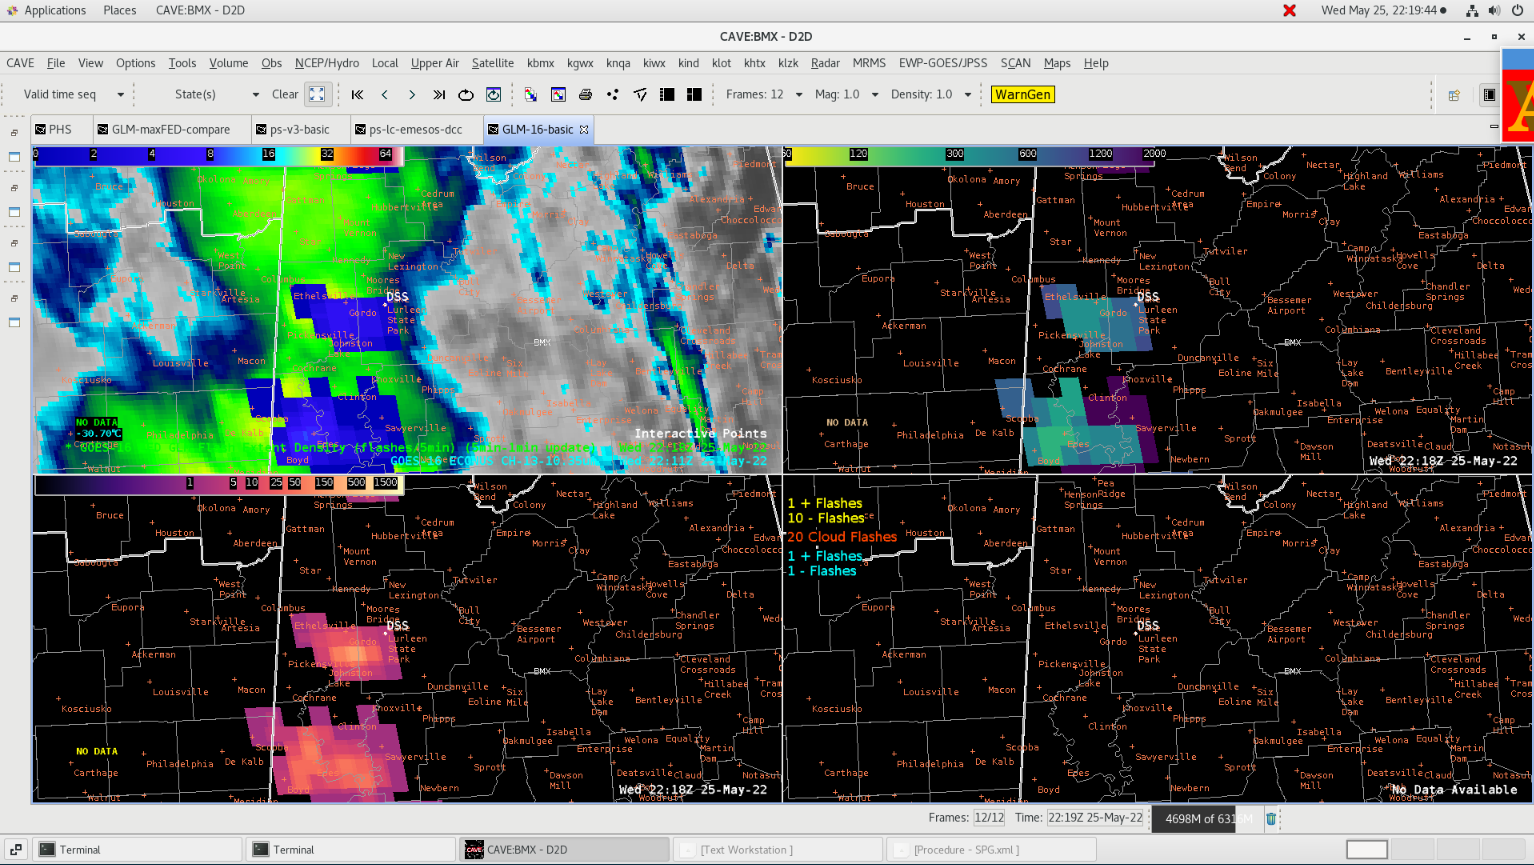
The pulses weakened significantly as it approached the area and this was consistently evident in the GLM display and the LightningCast probabilities.

GLM (top) shows the MFA increasing and the FED decreasing. This was consistent with radar data and observed lightning pulses. The LightningCast probabilities also decreased.

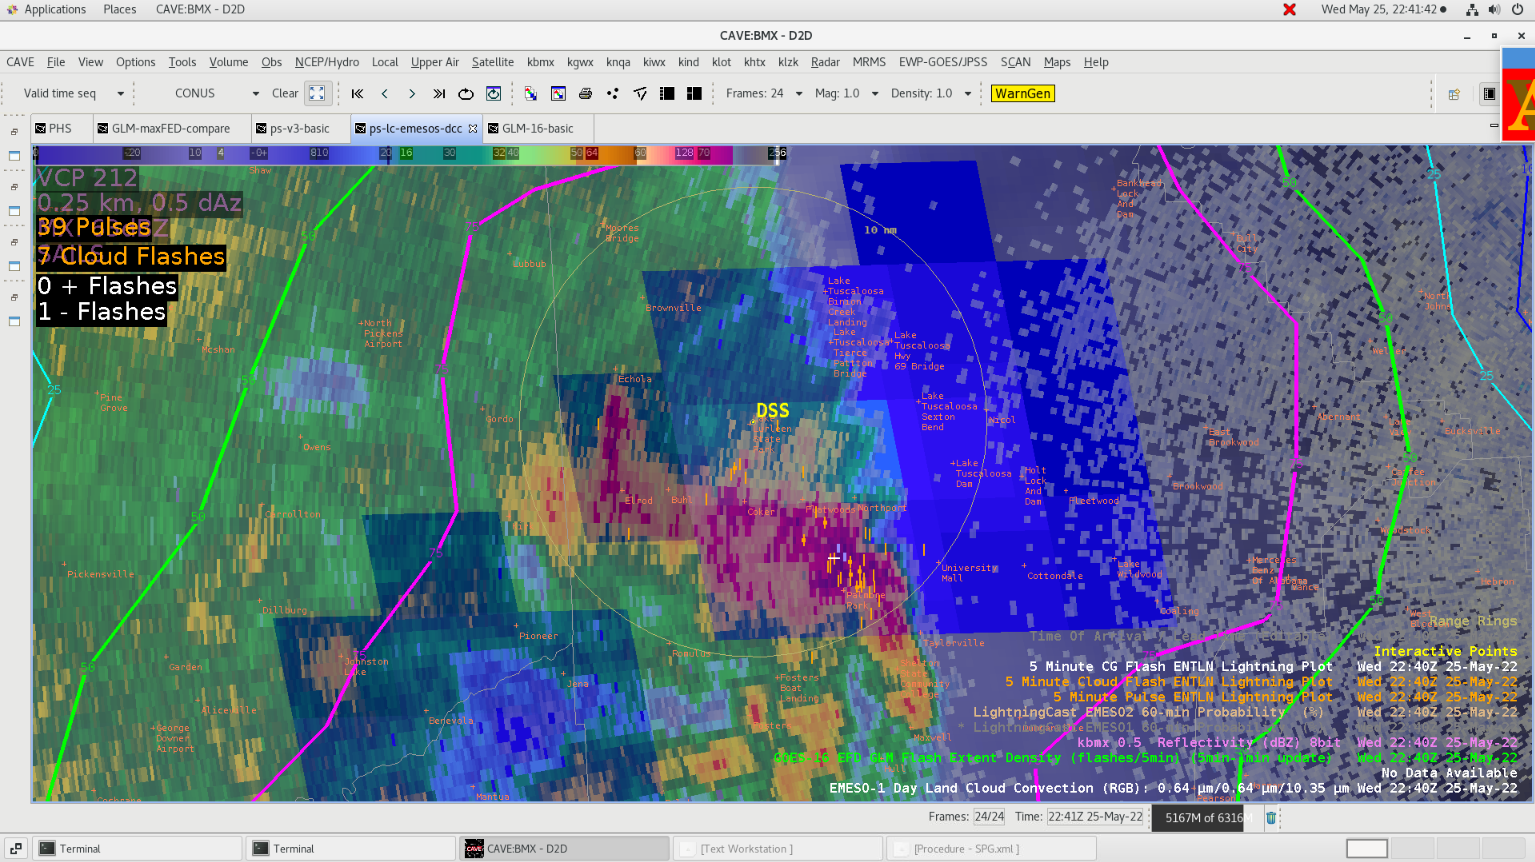
Lightning occurred in the area around 22:38Z with GLM showing another pulse beginning as the storm moved through our DSS area.

In general, I found GLM to be much more useful today outside of the supercellular mode with more multicellular convection observed over central and southern AL and especially so for identifying strong cells within a linear structure.


ProbSevere v3

In a DSS setting there isn’t a real reason to use ProbSevere v3 because winds far below the 50-knot threshold could cause problems at our DSS events. That being said, there was great information in the trend graphic as I could see the growth and decay of storms that were already in progress. This allowed me to focus my attention on the strongest storms.

NUCAPS

Ongoing convection ahead of the line of storms limited the NUCAPS ability to produce good data. Availability of soundings was also an issue as the data came in between 19-20Z with storms ongoing near my area of interest.

Optical Flow Winds

For the optical flow winds, there wasn’t much in the way of DSS that I could find a use for. The divergence field again could be useful, but with the suite of GLM I was seeing the divergence and strengthening of the storms in multiple products. Visualization is still the main hurdle with OFW.


Once the anvil for some of these storms developed it was difficult to use. Especially as debris clouds developed and overspread the area in advance of additional convection behind the initial line.


- Overcast Ambiance


Analyzing the convective environment prior/during storm activity

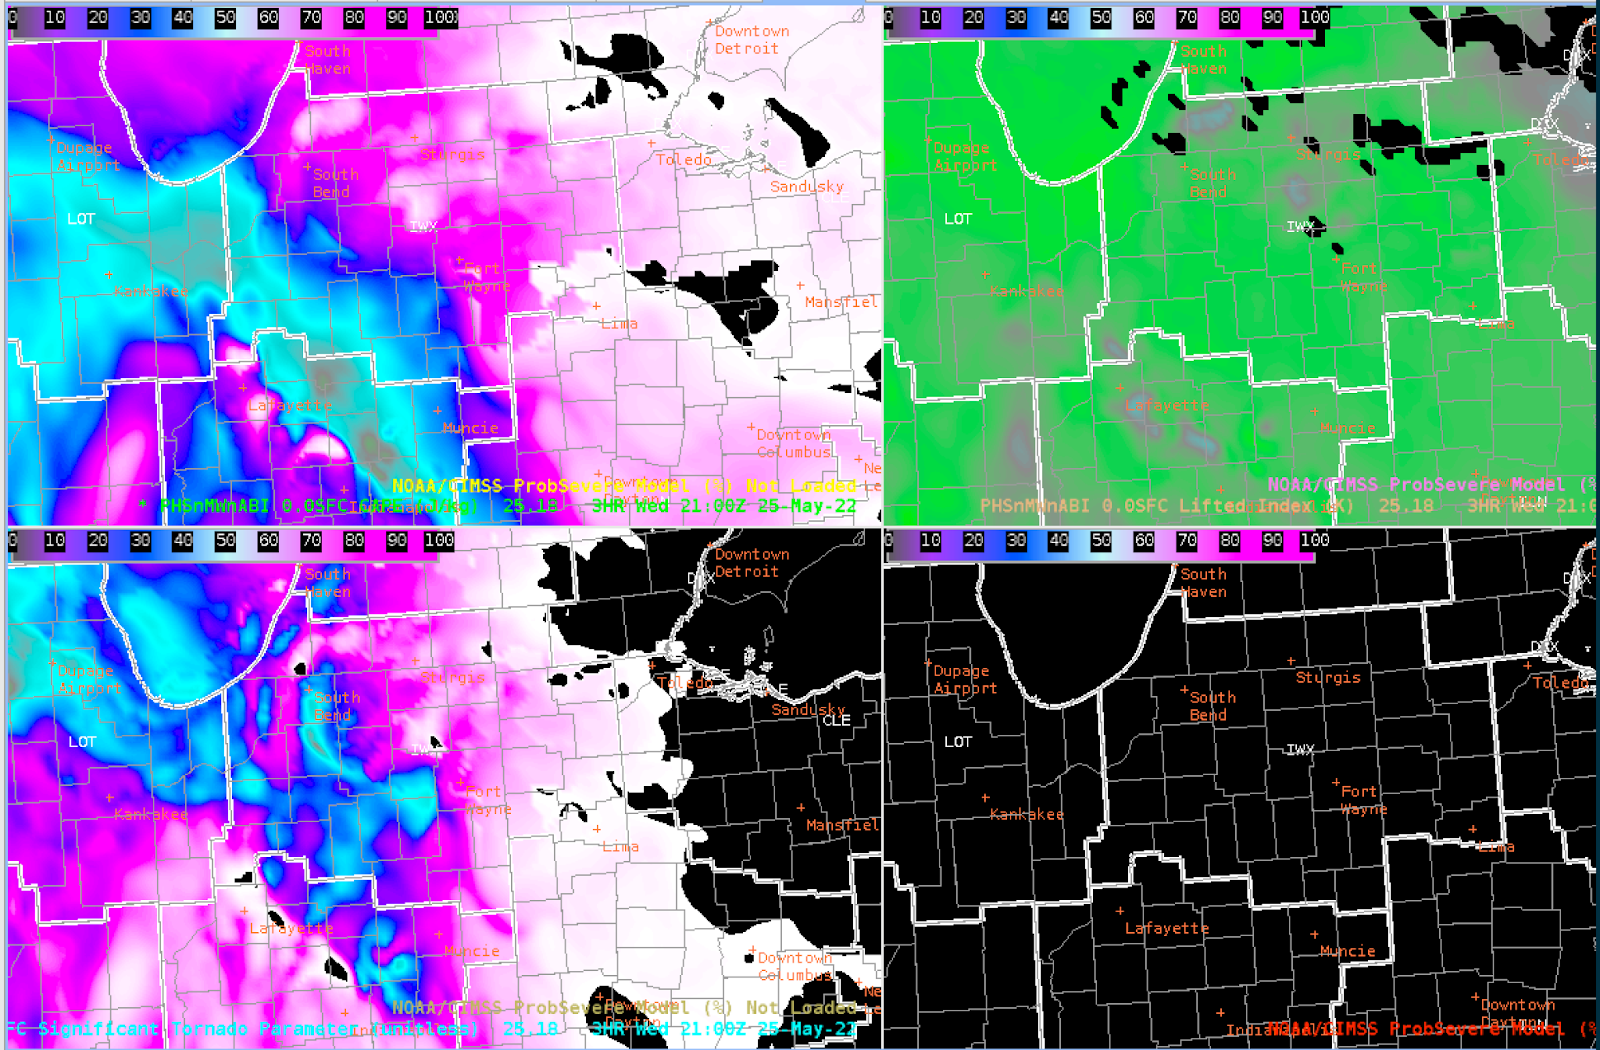
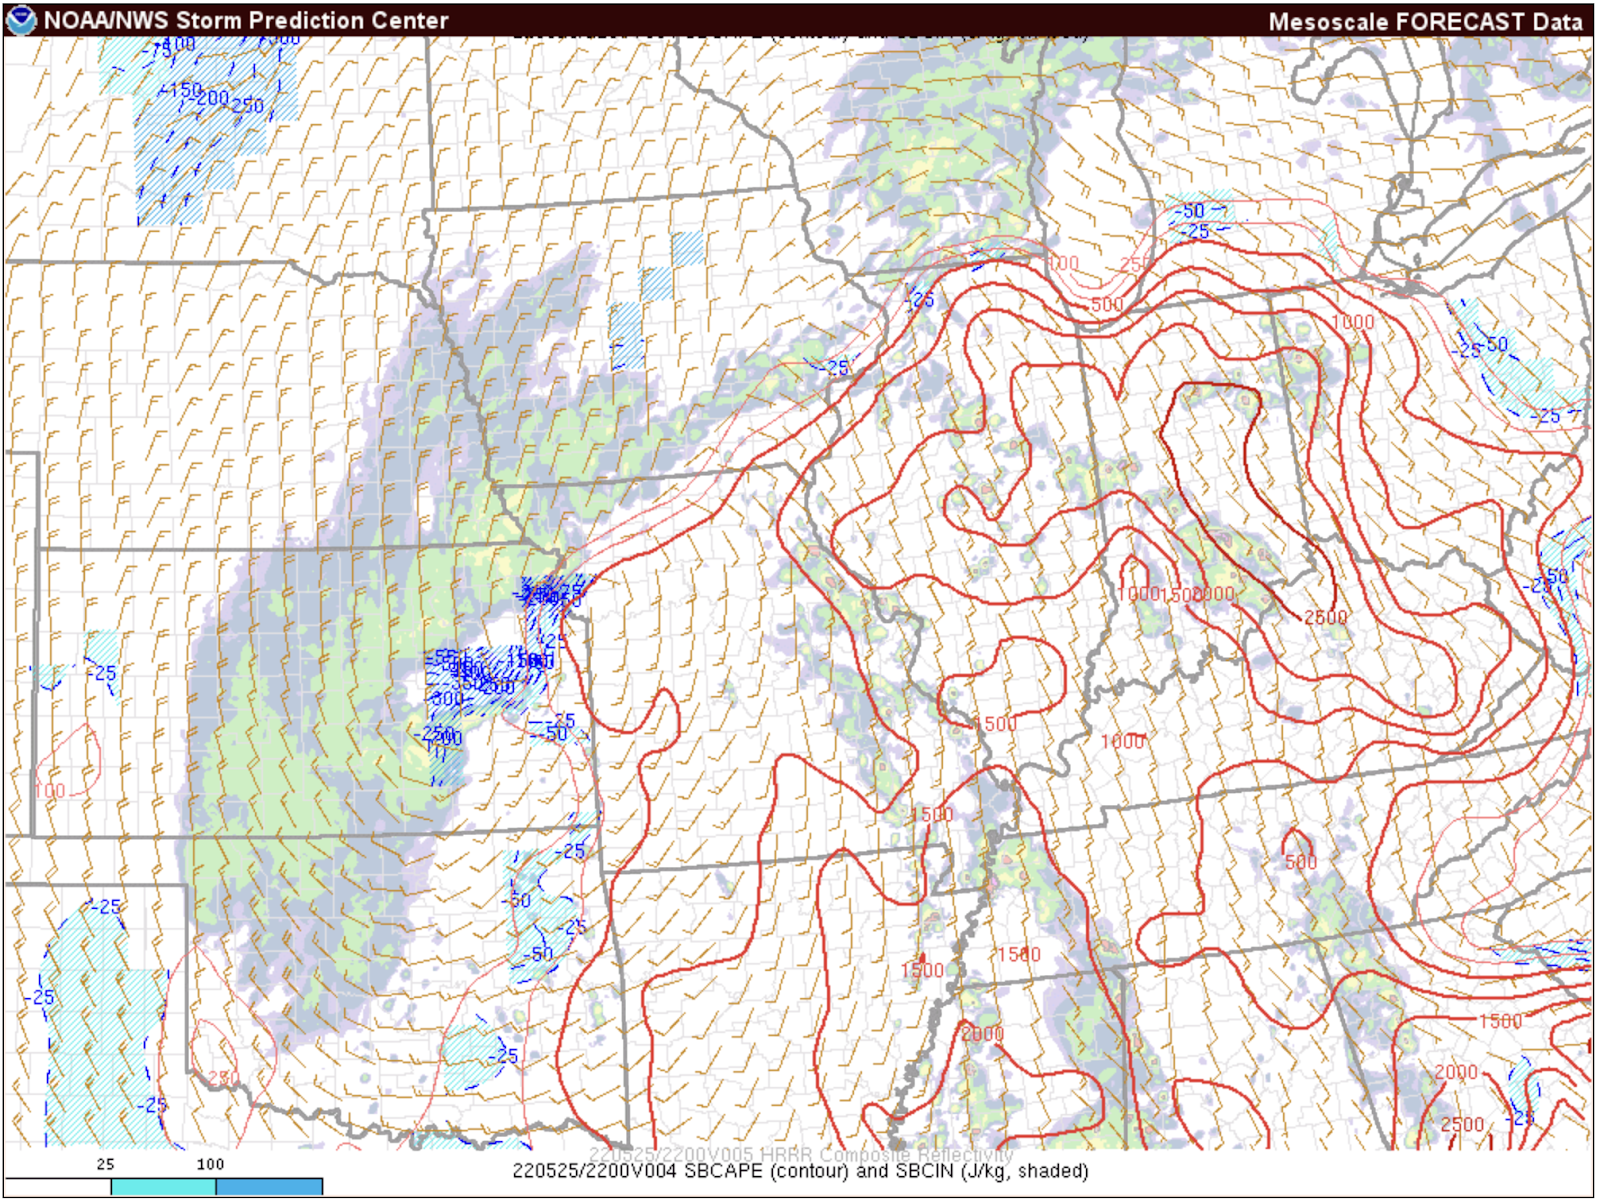
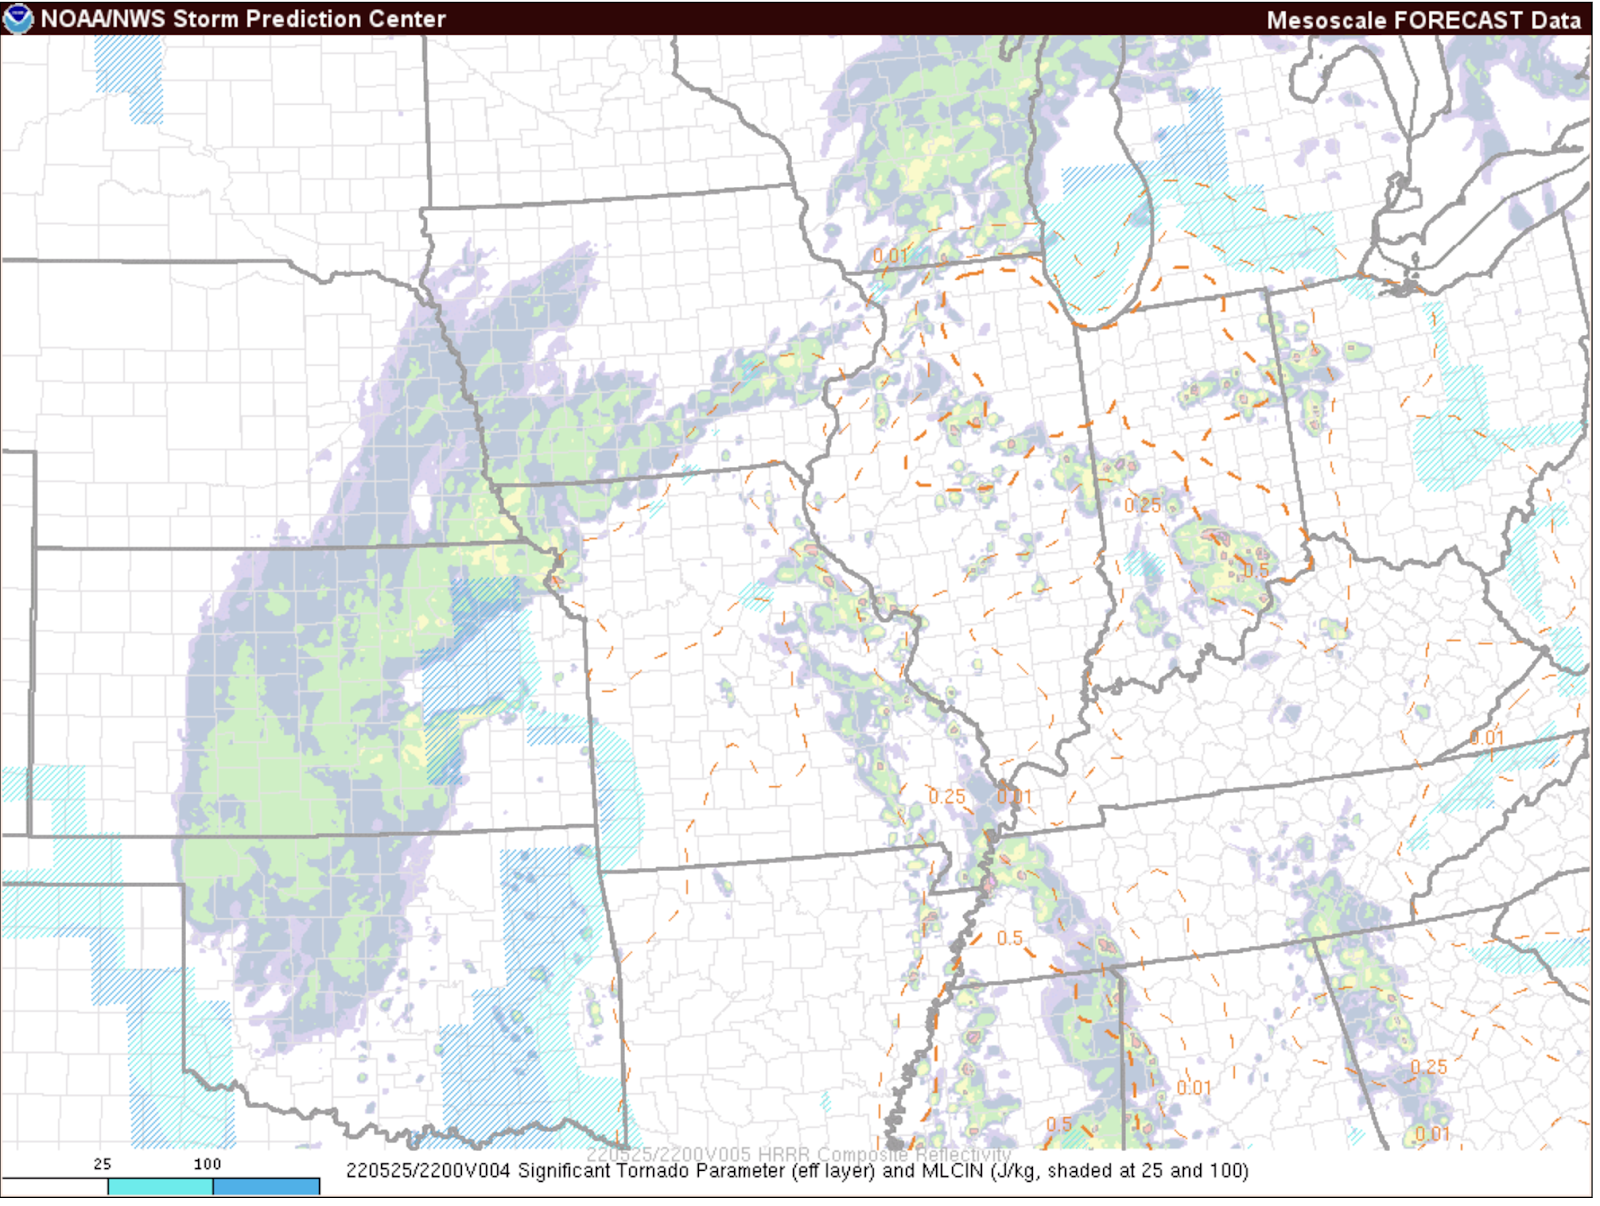
 I decided to look at the various parameters prior to storm initiation. When looking at PHS, it appeared our prime time for storm activity was going to be 21-00Z, when SBCAPE was forecast to be high, along with low LIs. I noticed that the STP was also elevated, upward of 3 as the activity moved northward into the southern portion of our CWA.


When comparing this to the SPC mesoanalysis page, the parameters from PHS seemed to agree fairly well with the mesoanalysis. It did appear, though, that the STP was a tad faster than what the mesoanalysis page showed. And the PHS decreased the instability an hour or two prior to 00Z, whereas the SPC page showed that instability remained elevated up to 00Z. The STP parameters in the PHS were a tad higher than the mesoanalysis page as well, with the meso page only 0.5 to 1.

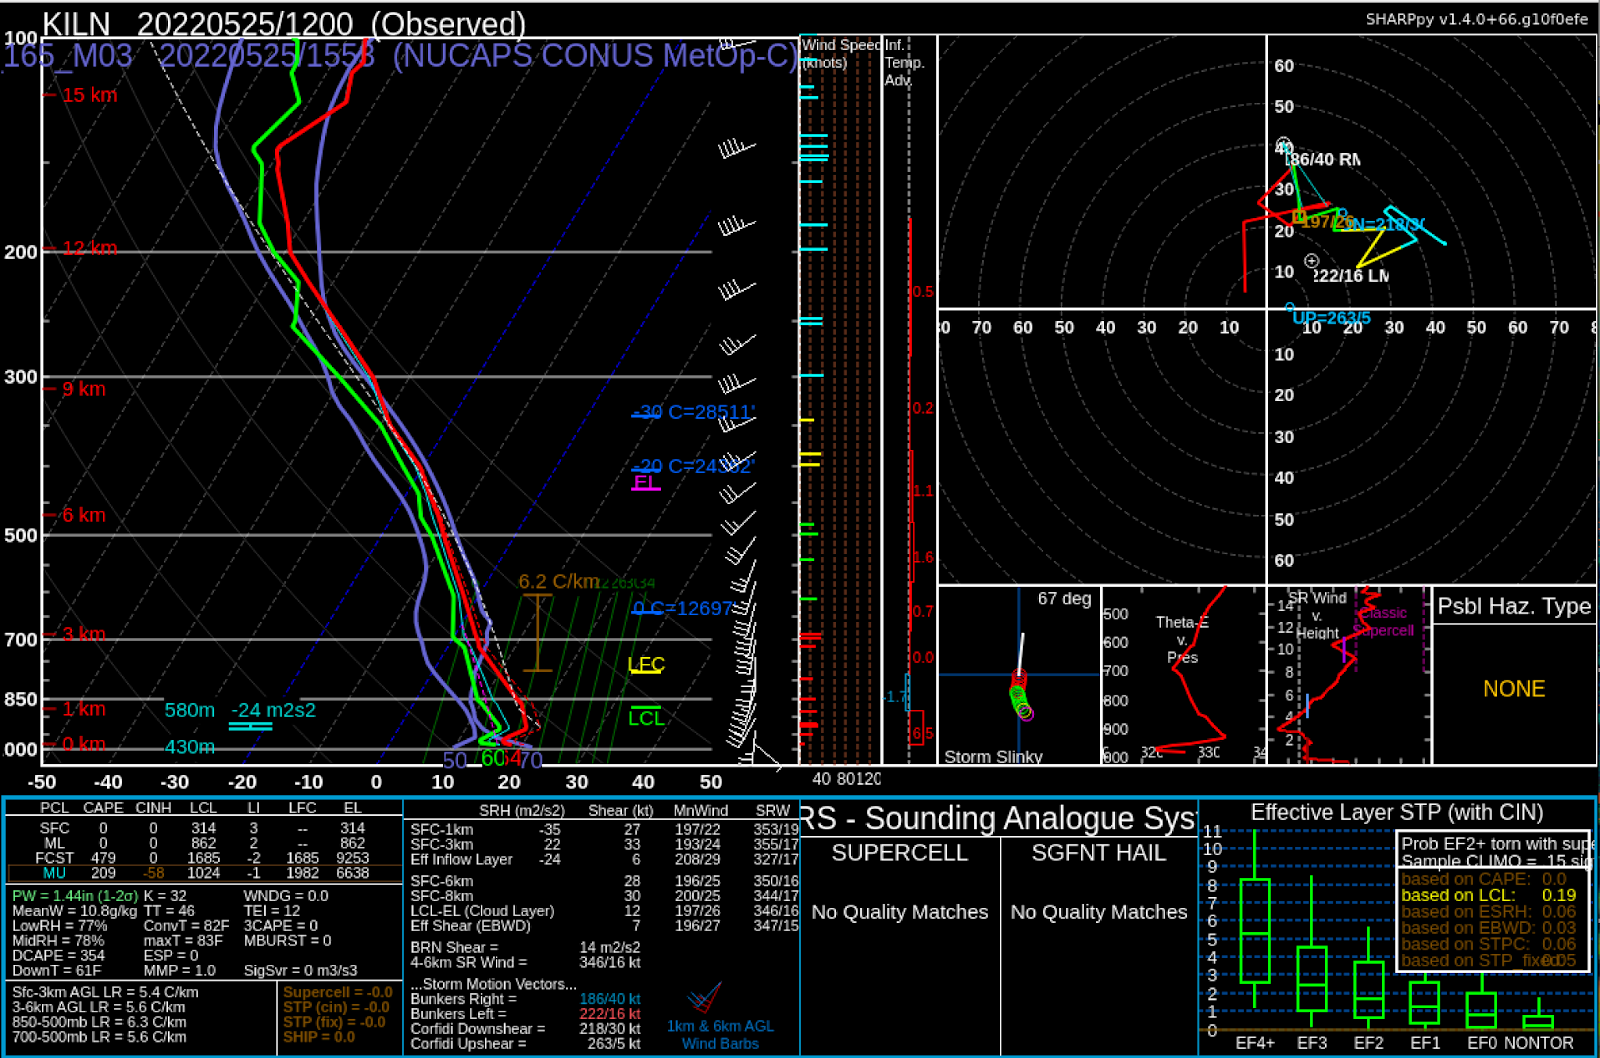
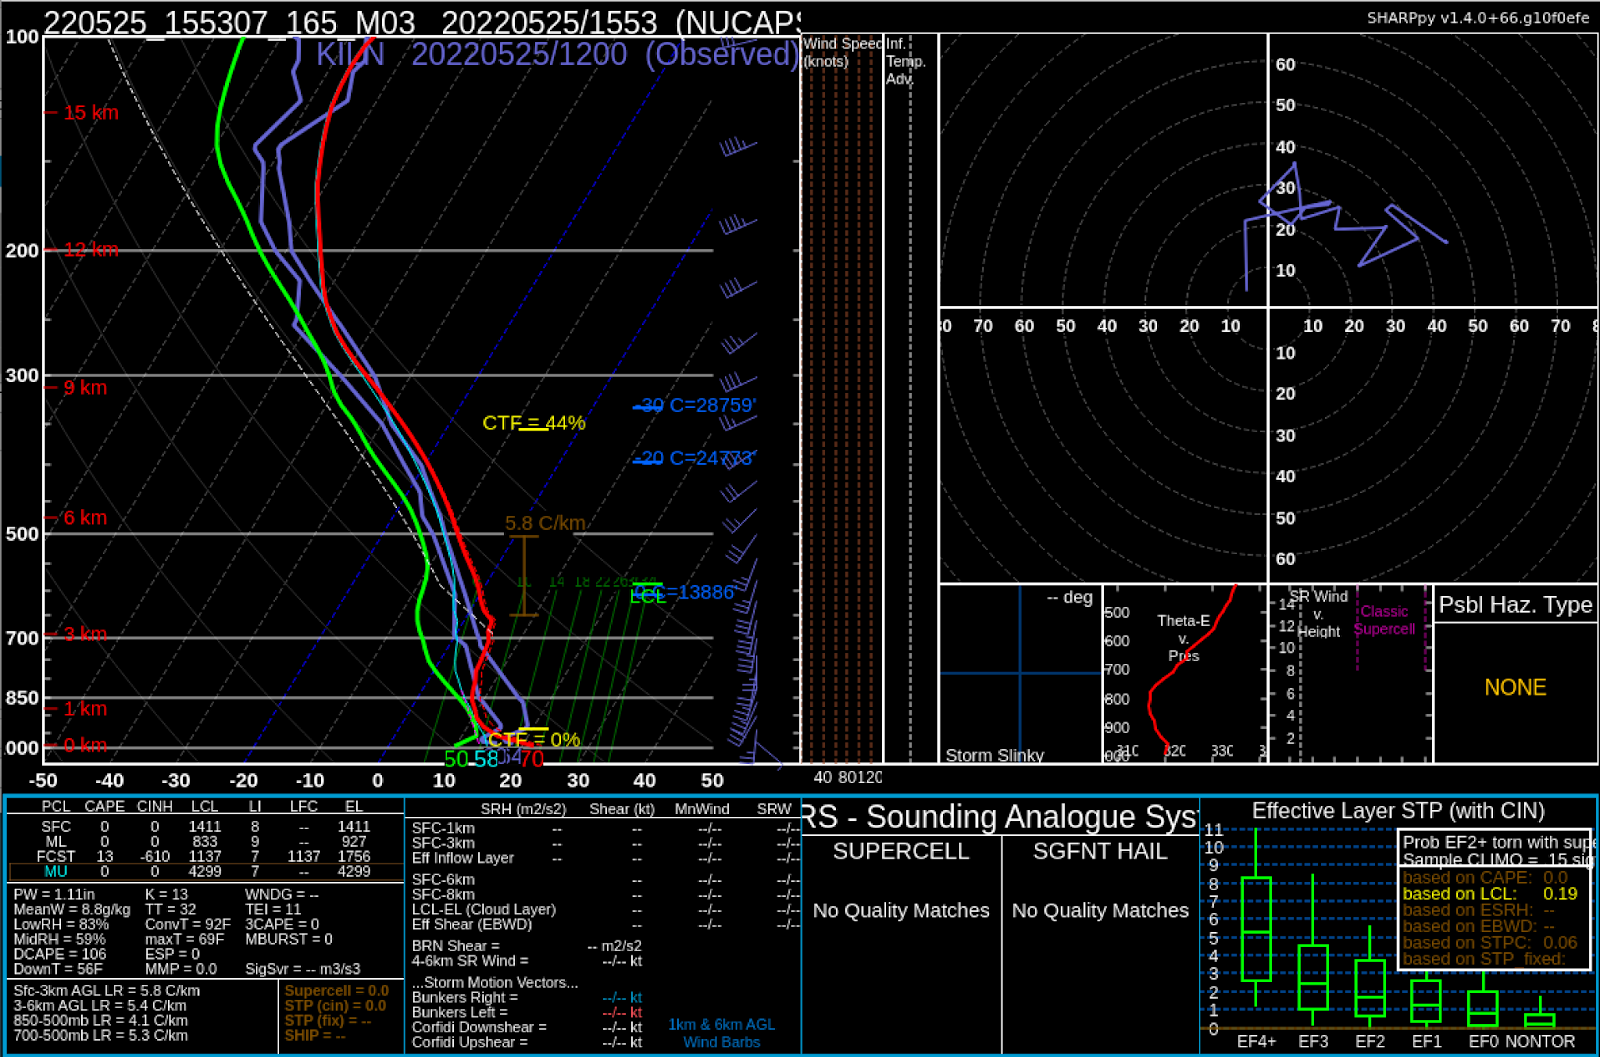
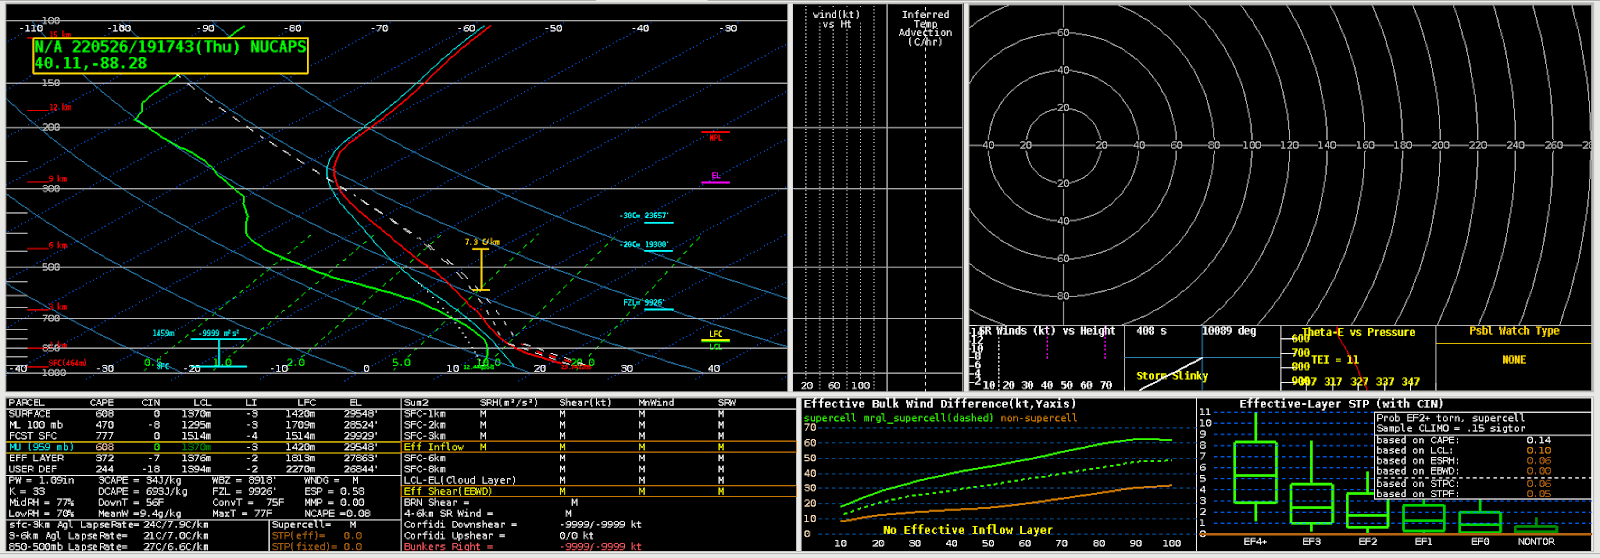
A look at the NUCAPS soundings in SharpPy showed a relatively stable surface layer in observations at 12 UTC. By 1550 UTC, NUCAPS showed the surface layer to heat up from insolation but still remain largely stable.
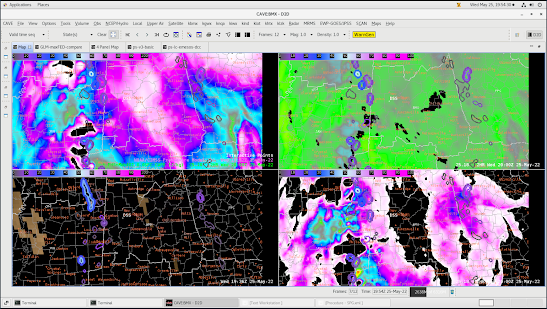
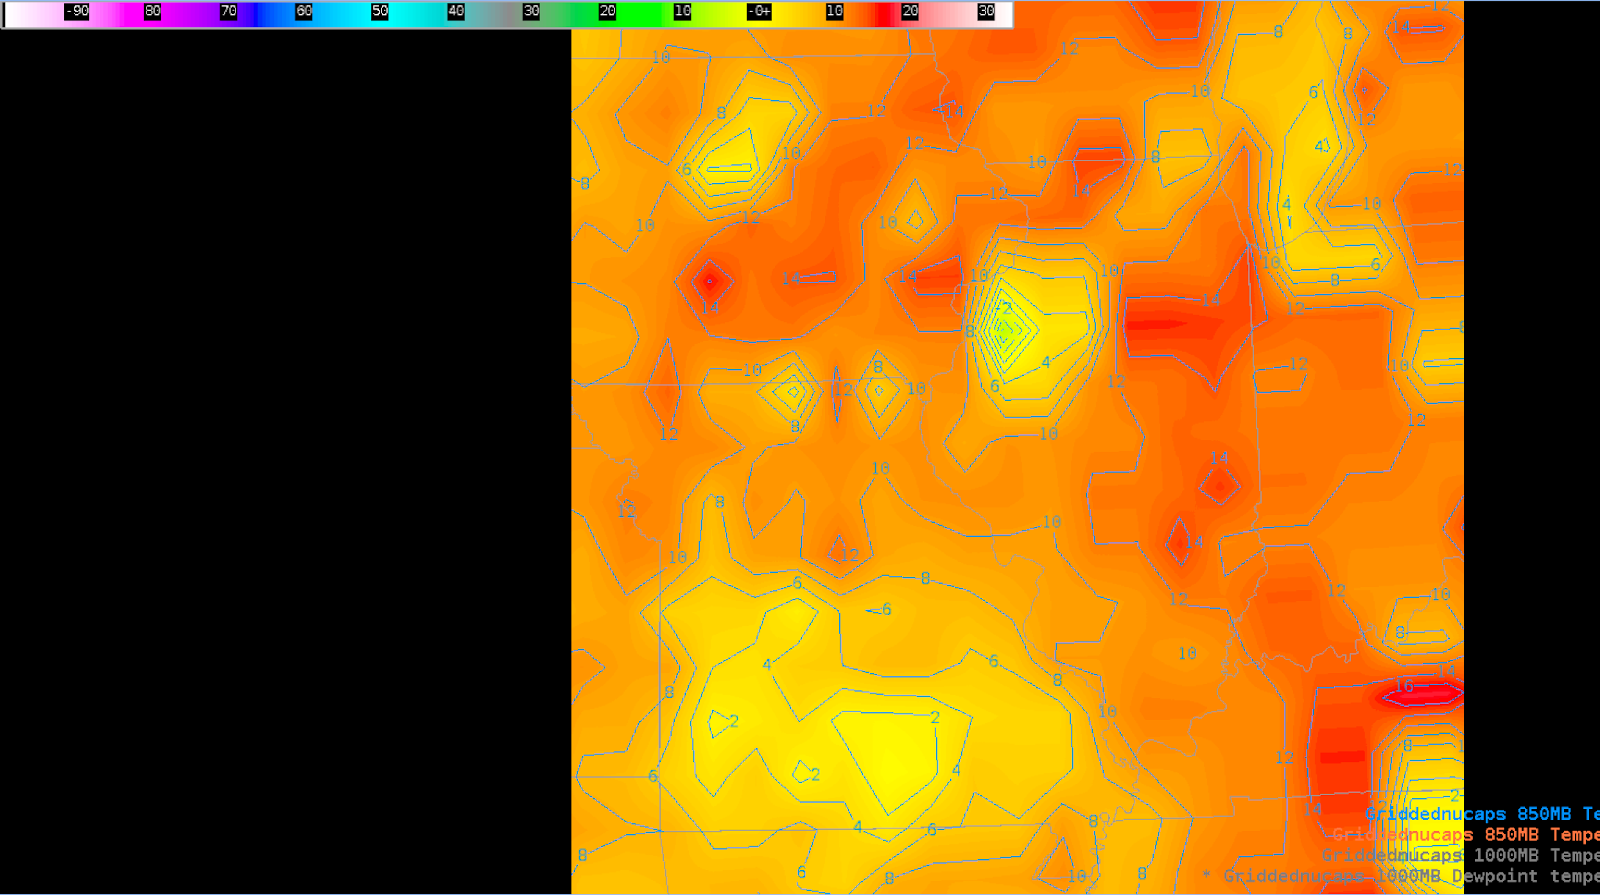
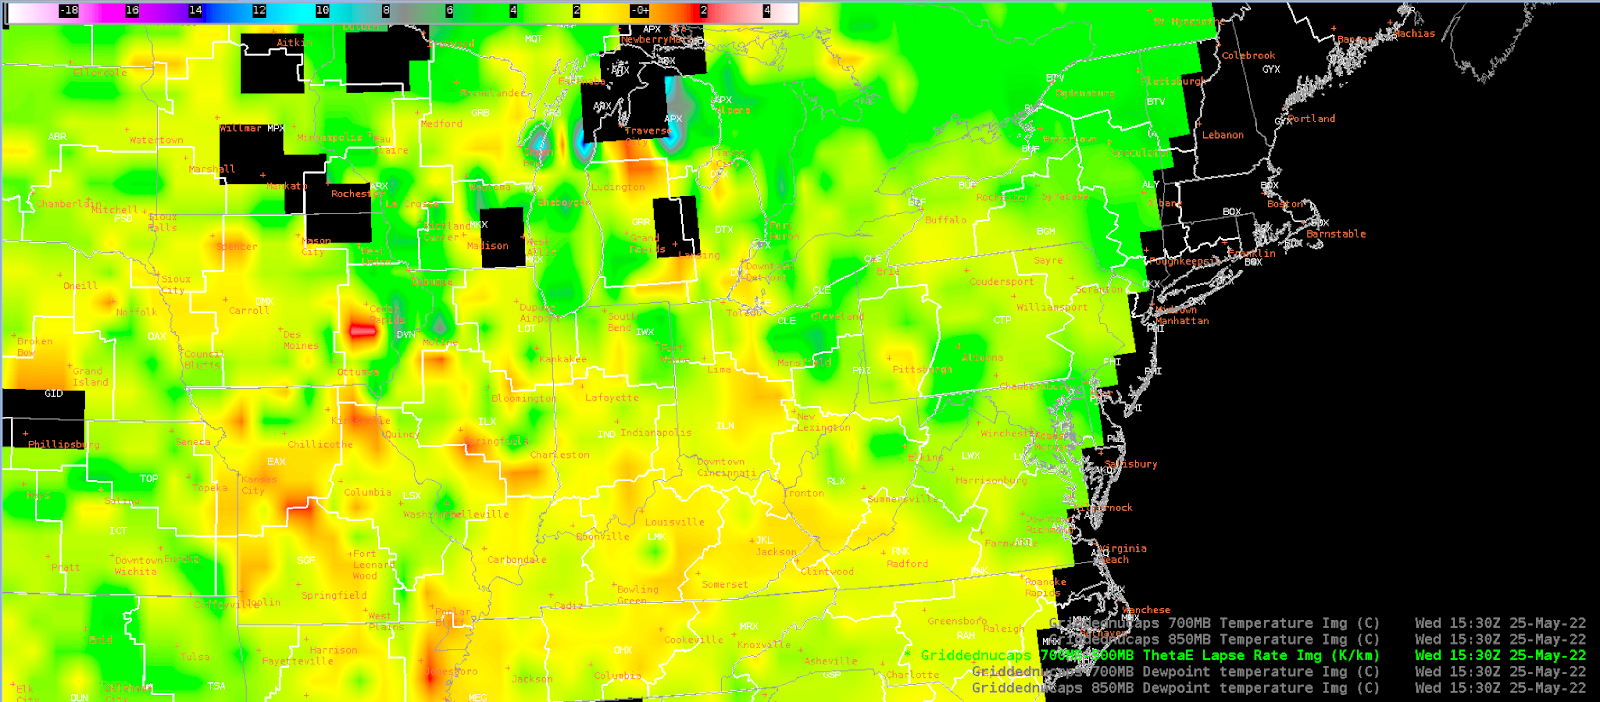
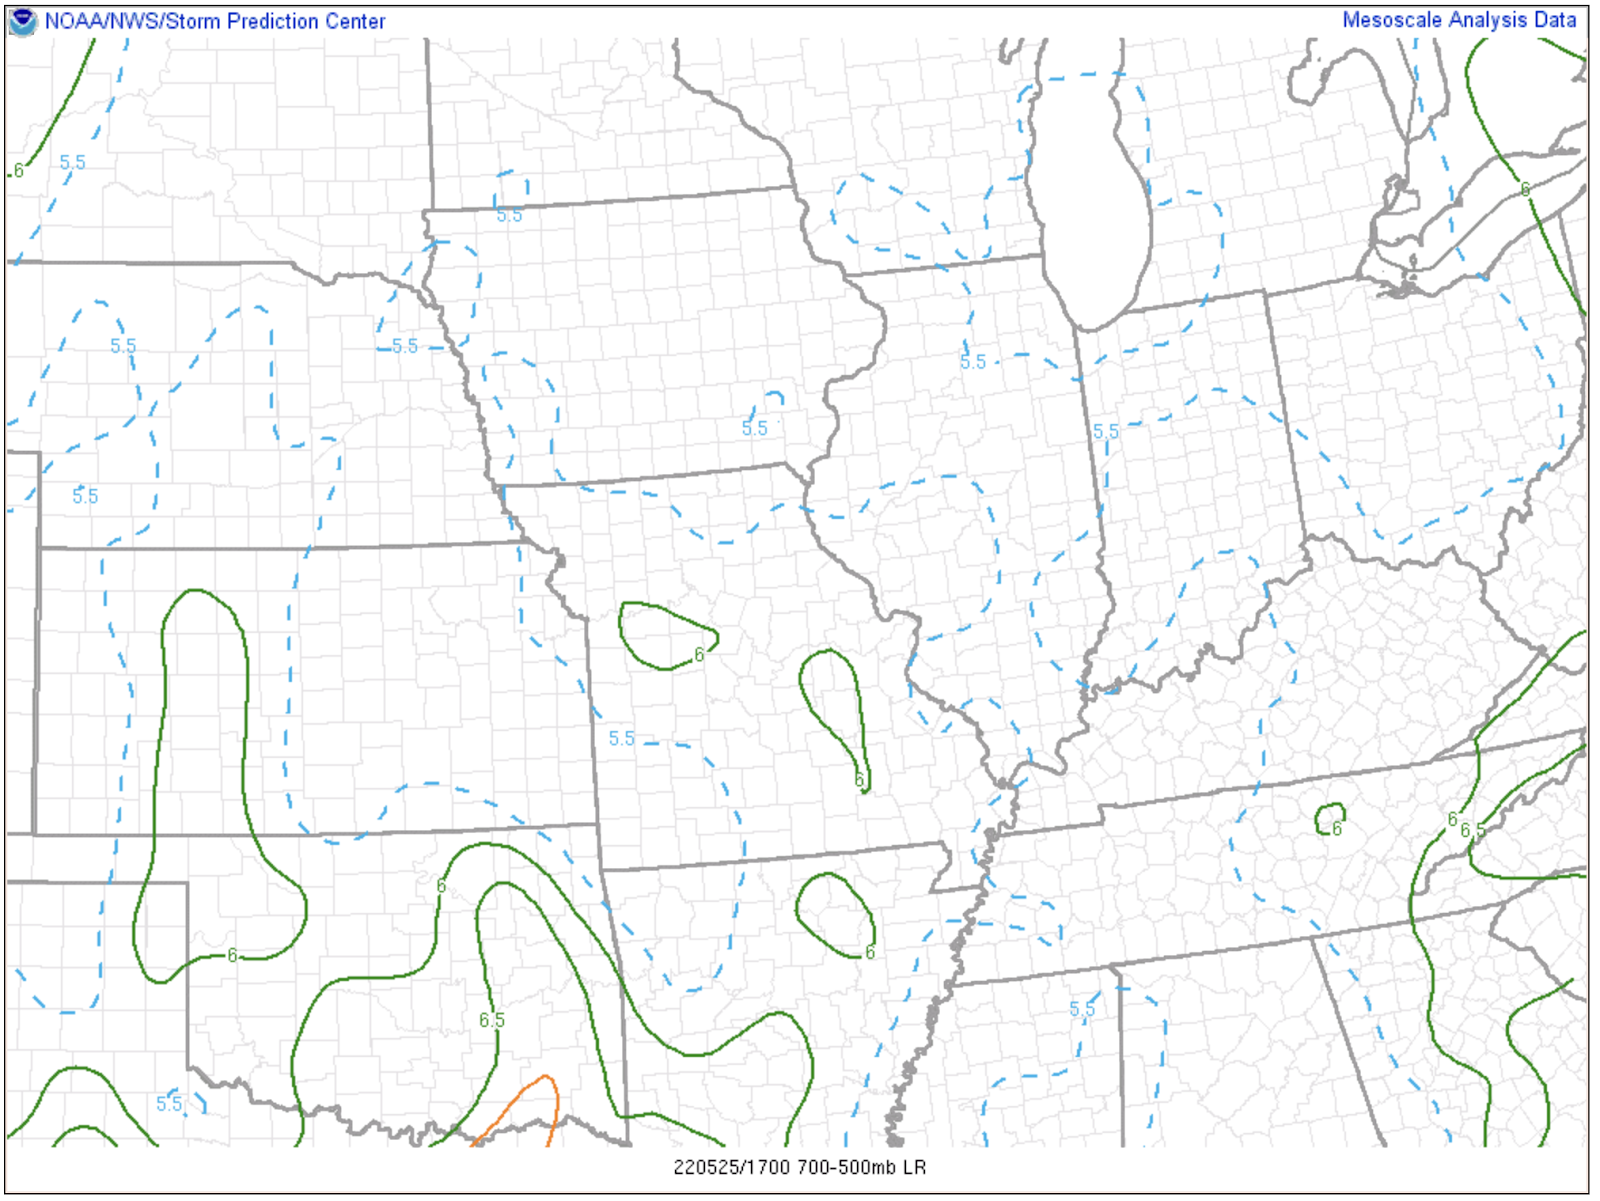
Looking at NUCAPS gridded data, specifically for mid-level lapse rates, while the gridded data was noisy with some bullseyes, it did show the environment between 3 to 5 degC/km lapse rates, consistent with the SPC mesoanalysis page (which showed around 5.5 degC/km).

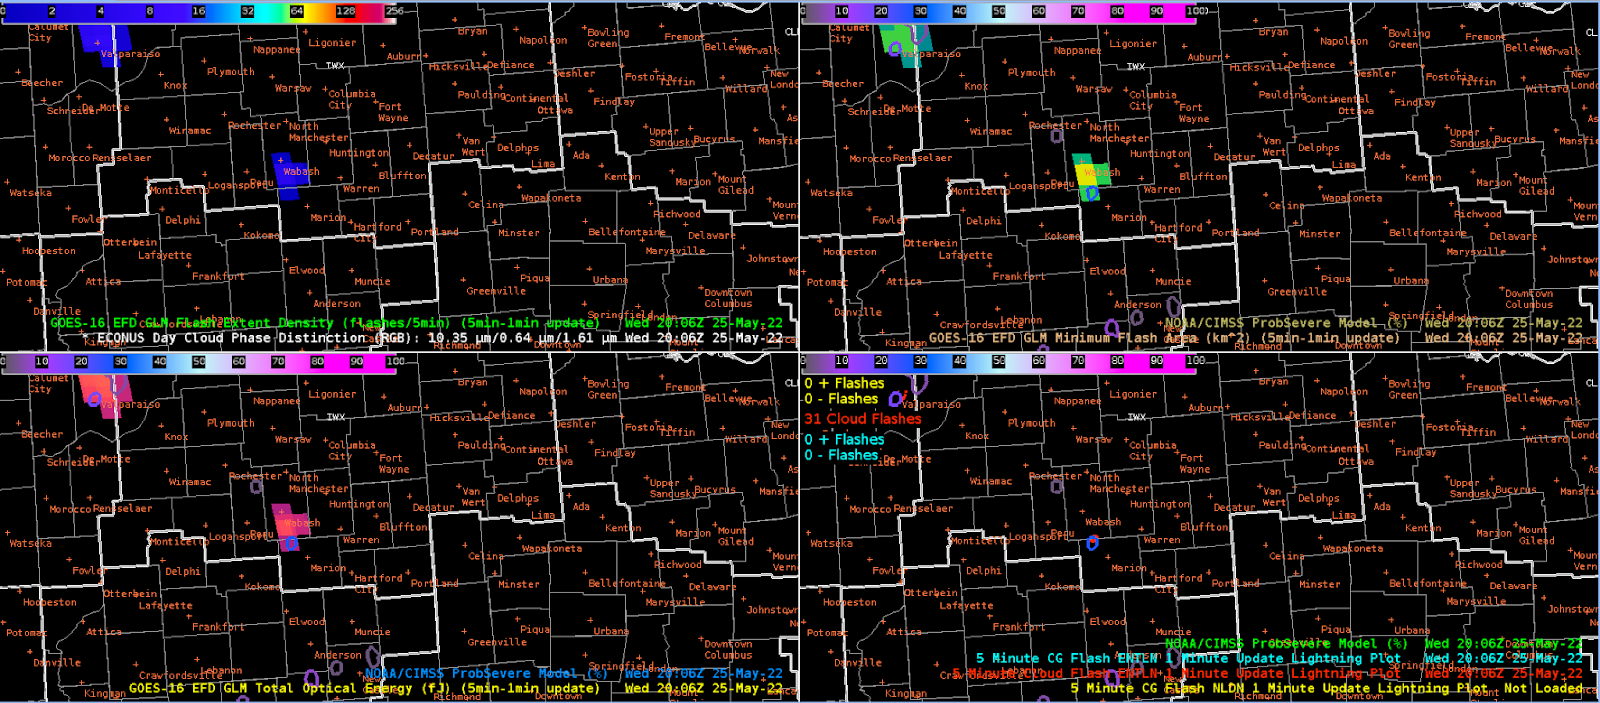
Just prior to more storm activity, GLM was picking up on a cell moving north into Wabash County, where a spike in MFA and decrease in TOE was evident. This storm was eventually warned on, where the radar showed a TBSS with a ProbSevere threshold for wind near 28%.

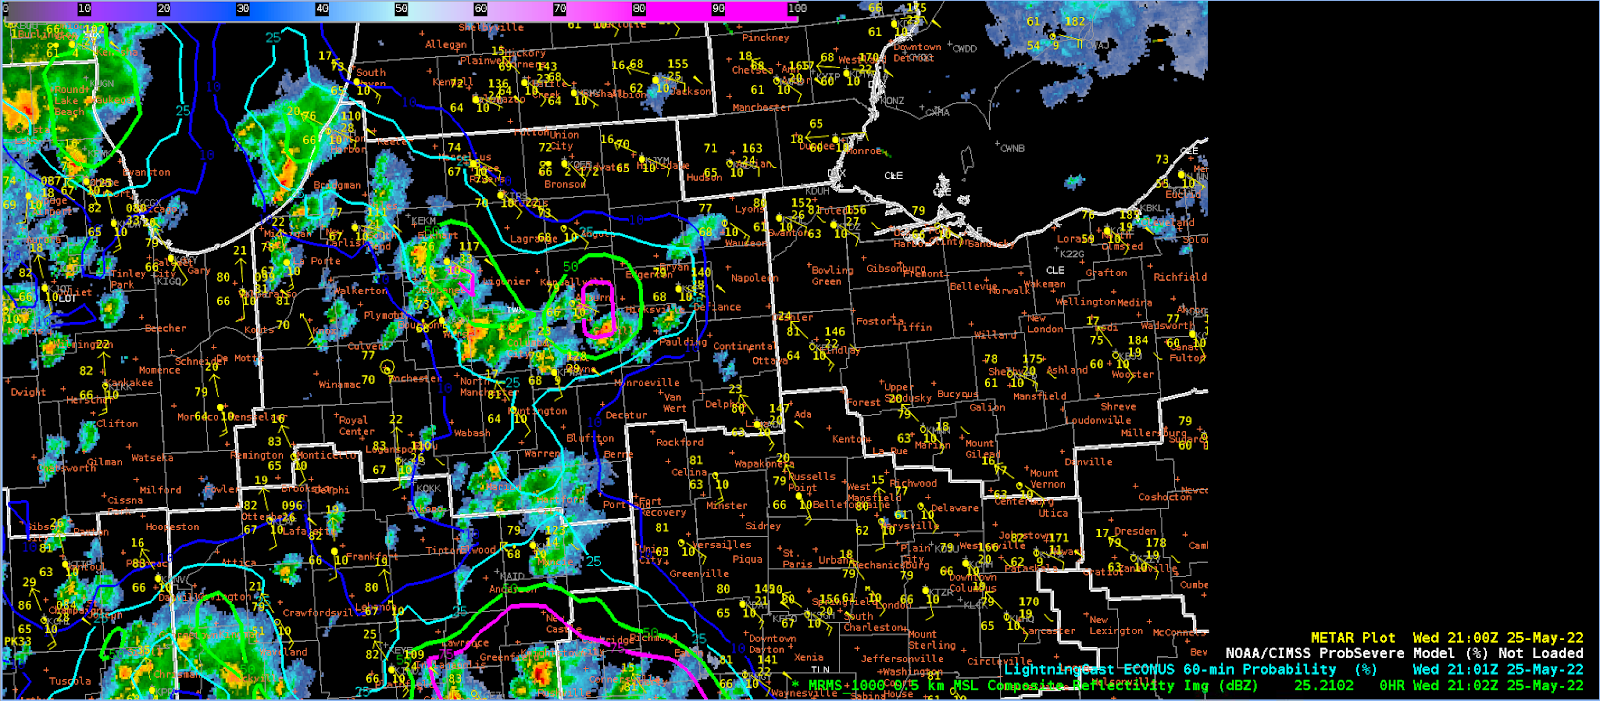
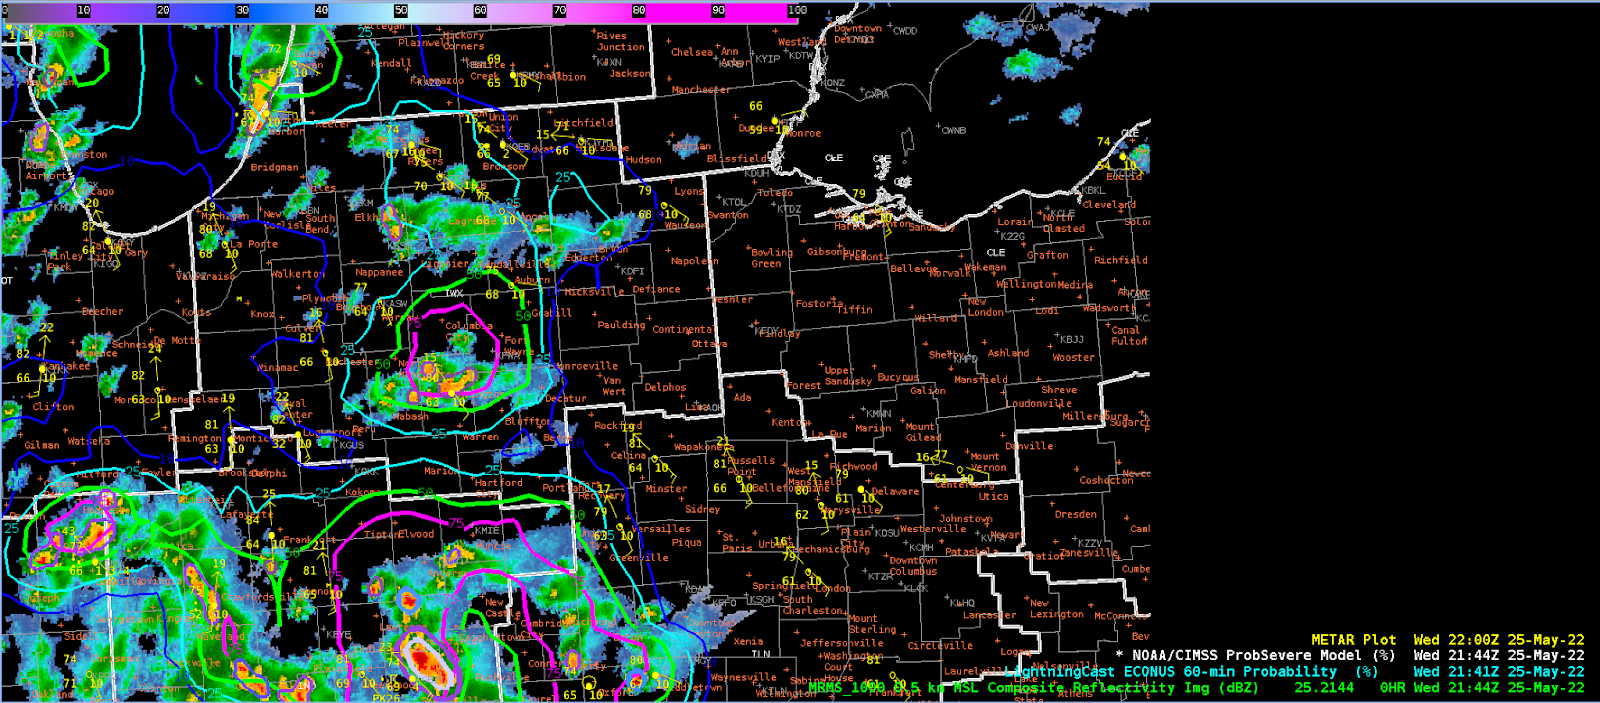
The lightningCast model, at least for KIWX, appeared to do better today in terms of the advection component, with the lightningCast downstream of the cells depicted in MRMS.

This time period was at 21:44Z, showing again how lightningCast was showing better predictive capabilities downstream of current convection.

Snowfan