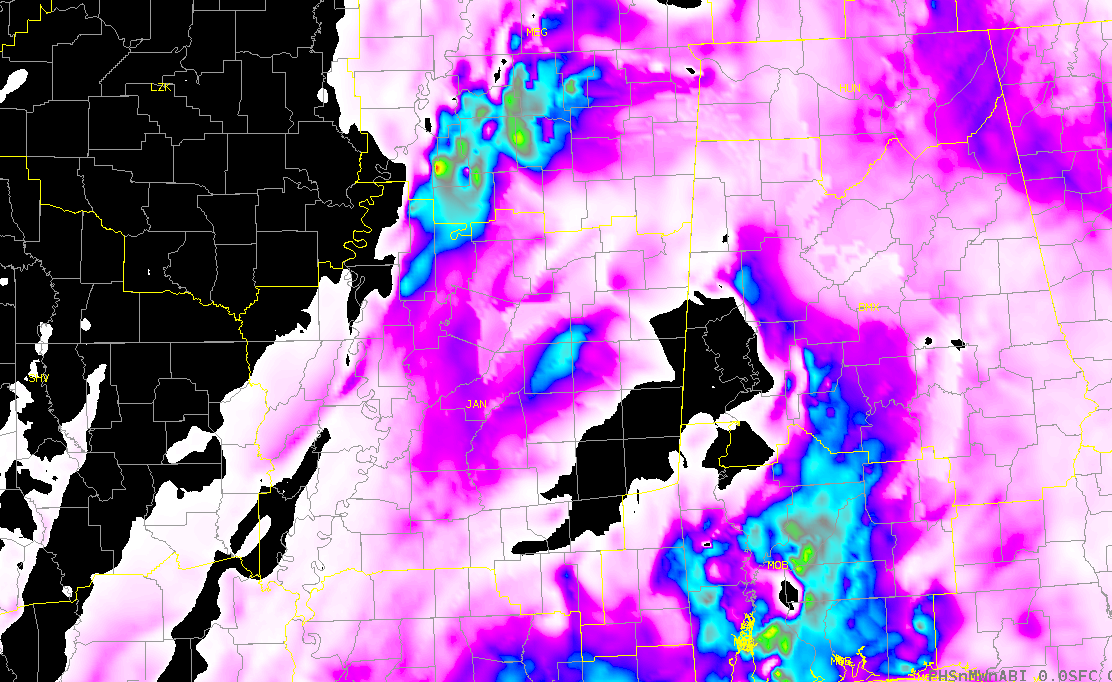
PHS
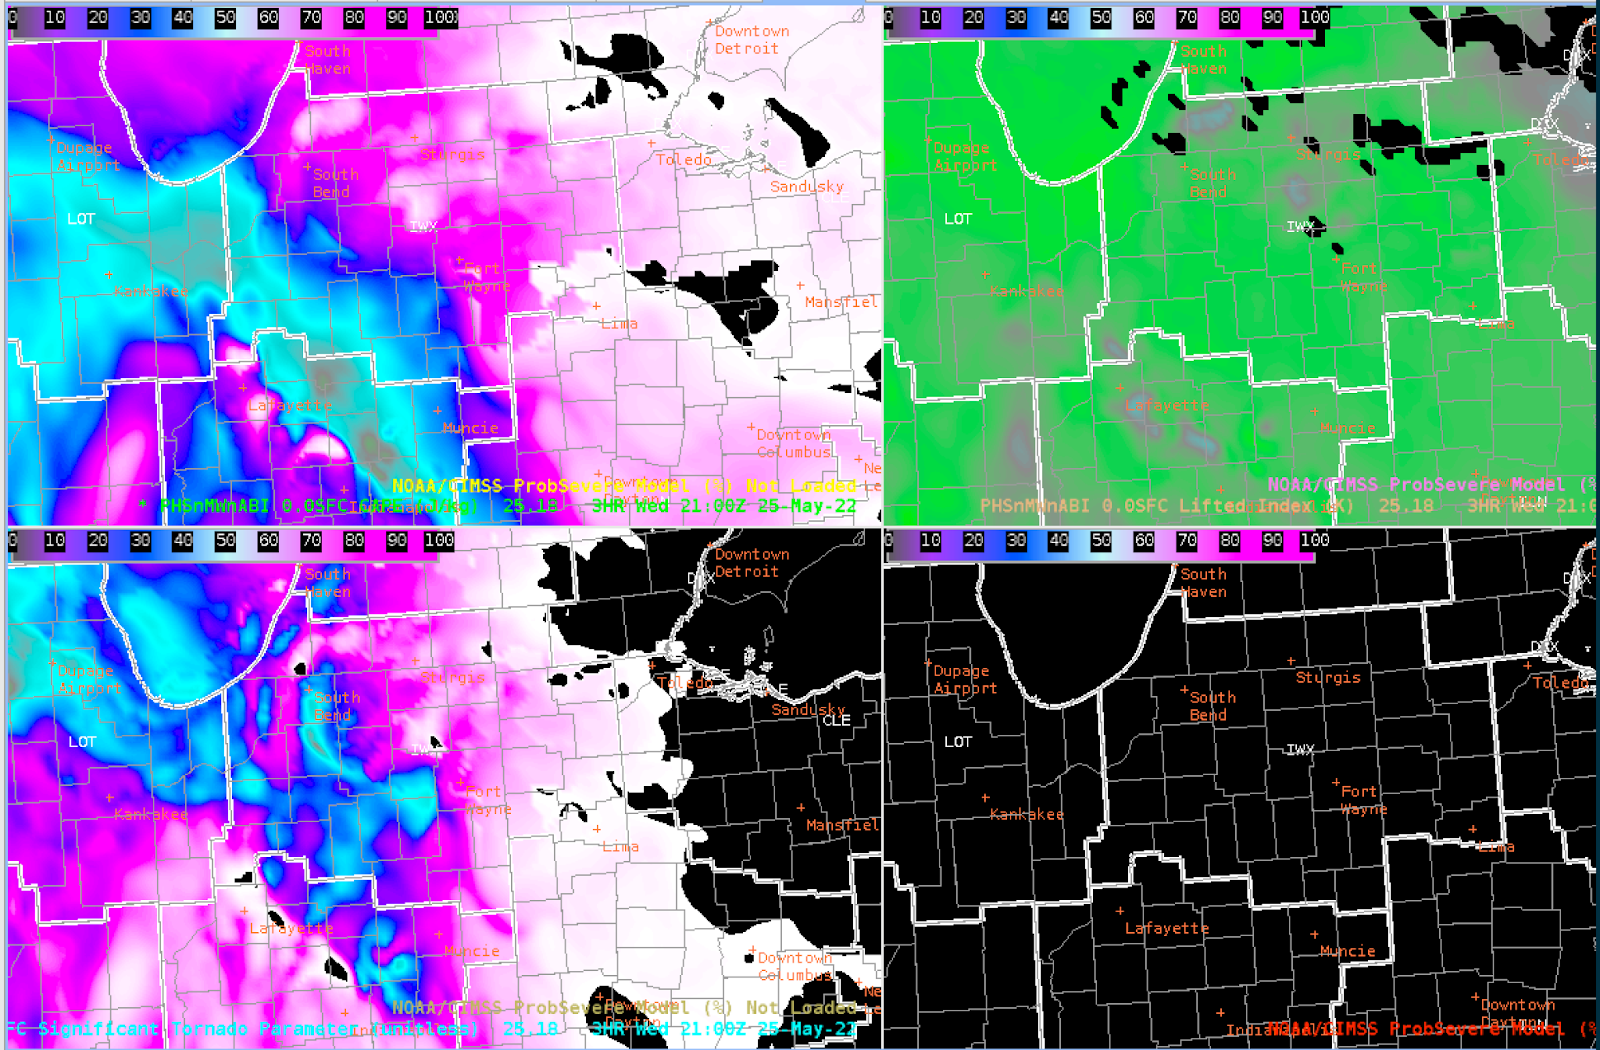
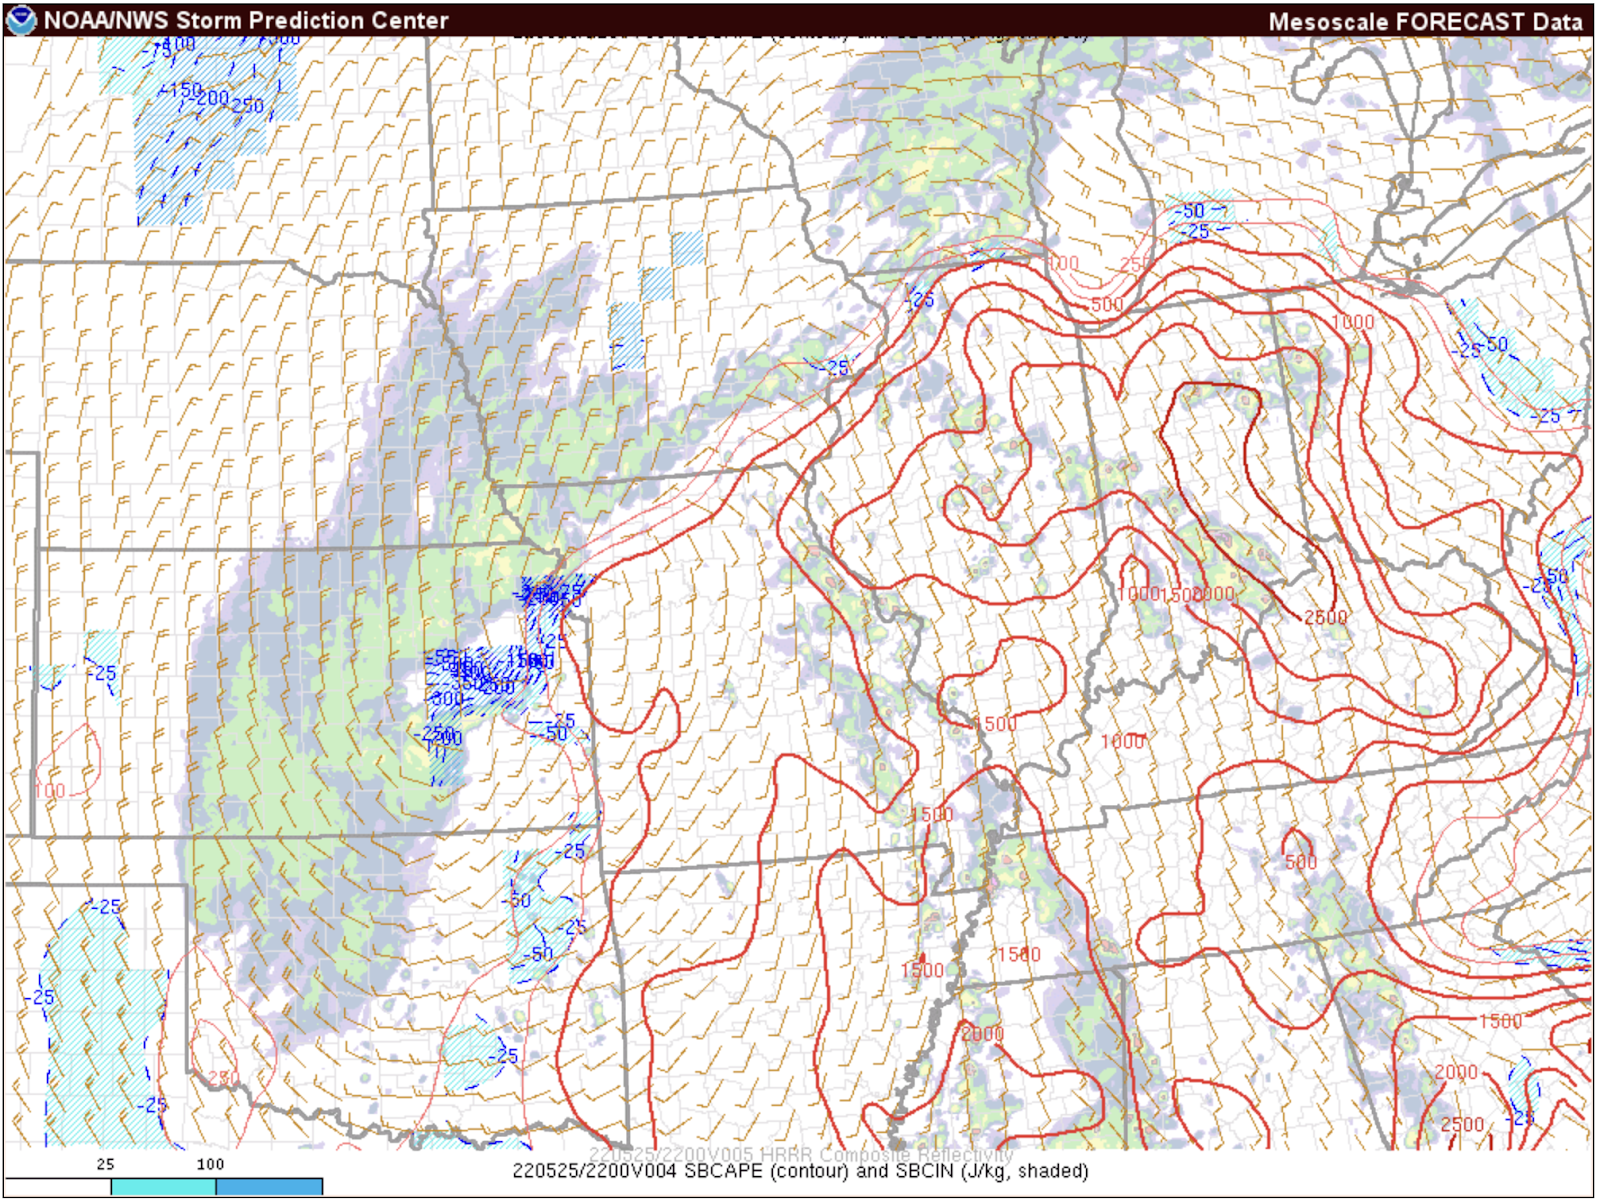
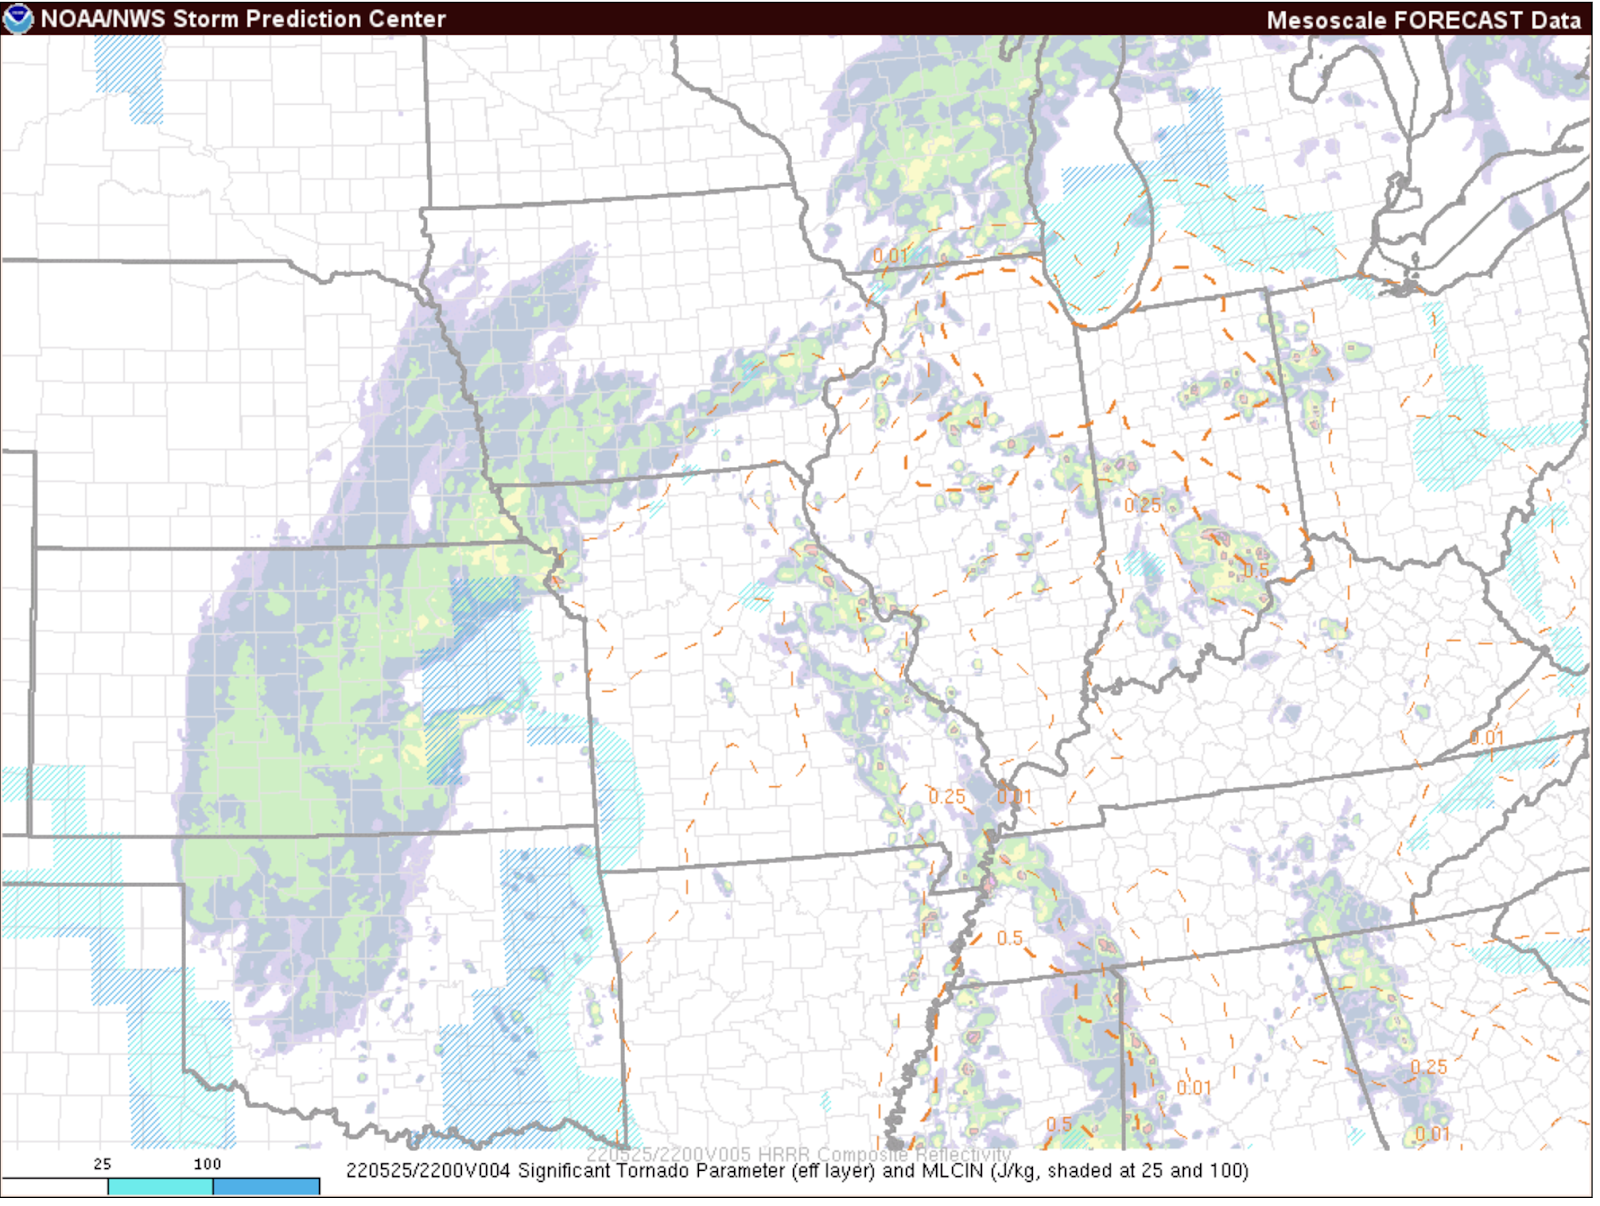
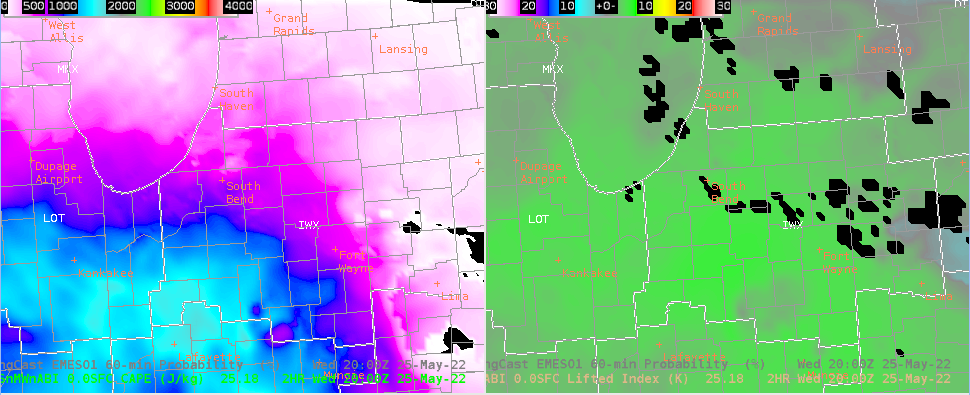
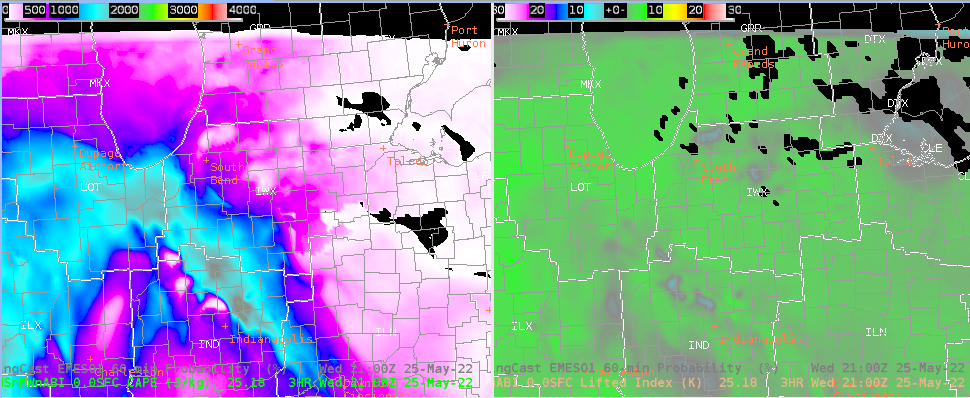
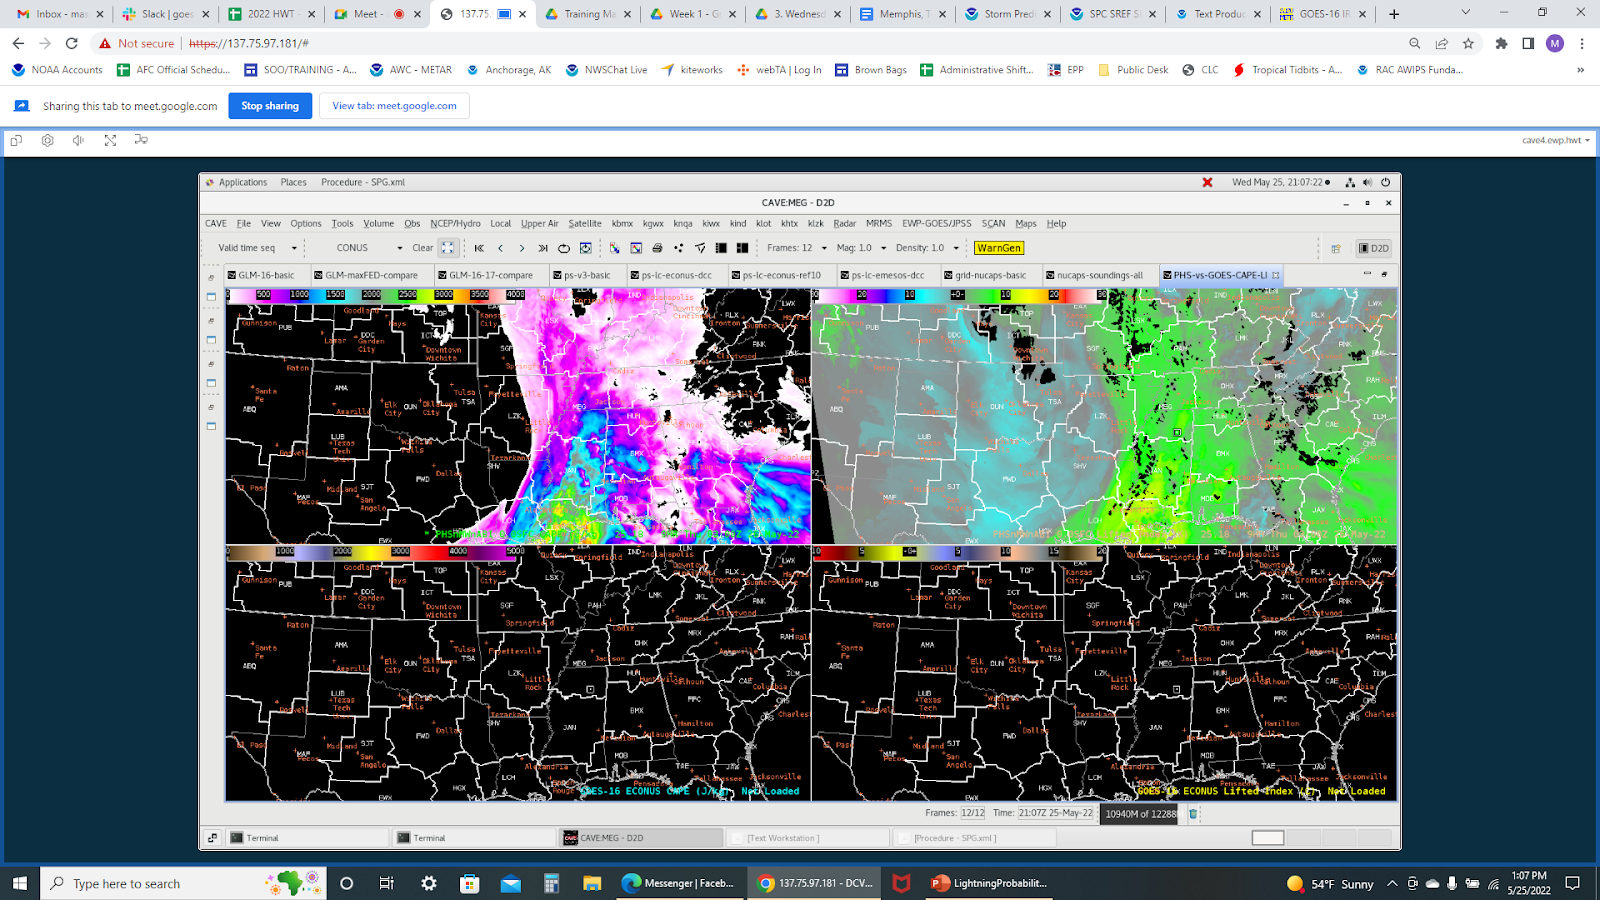
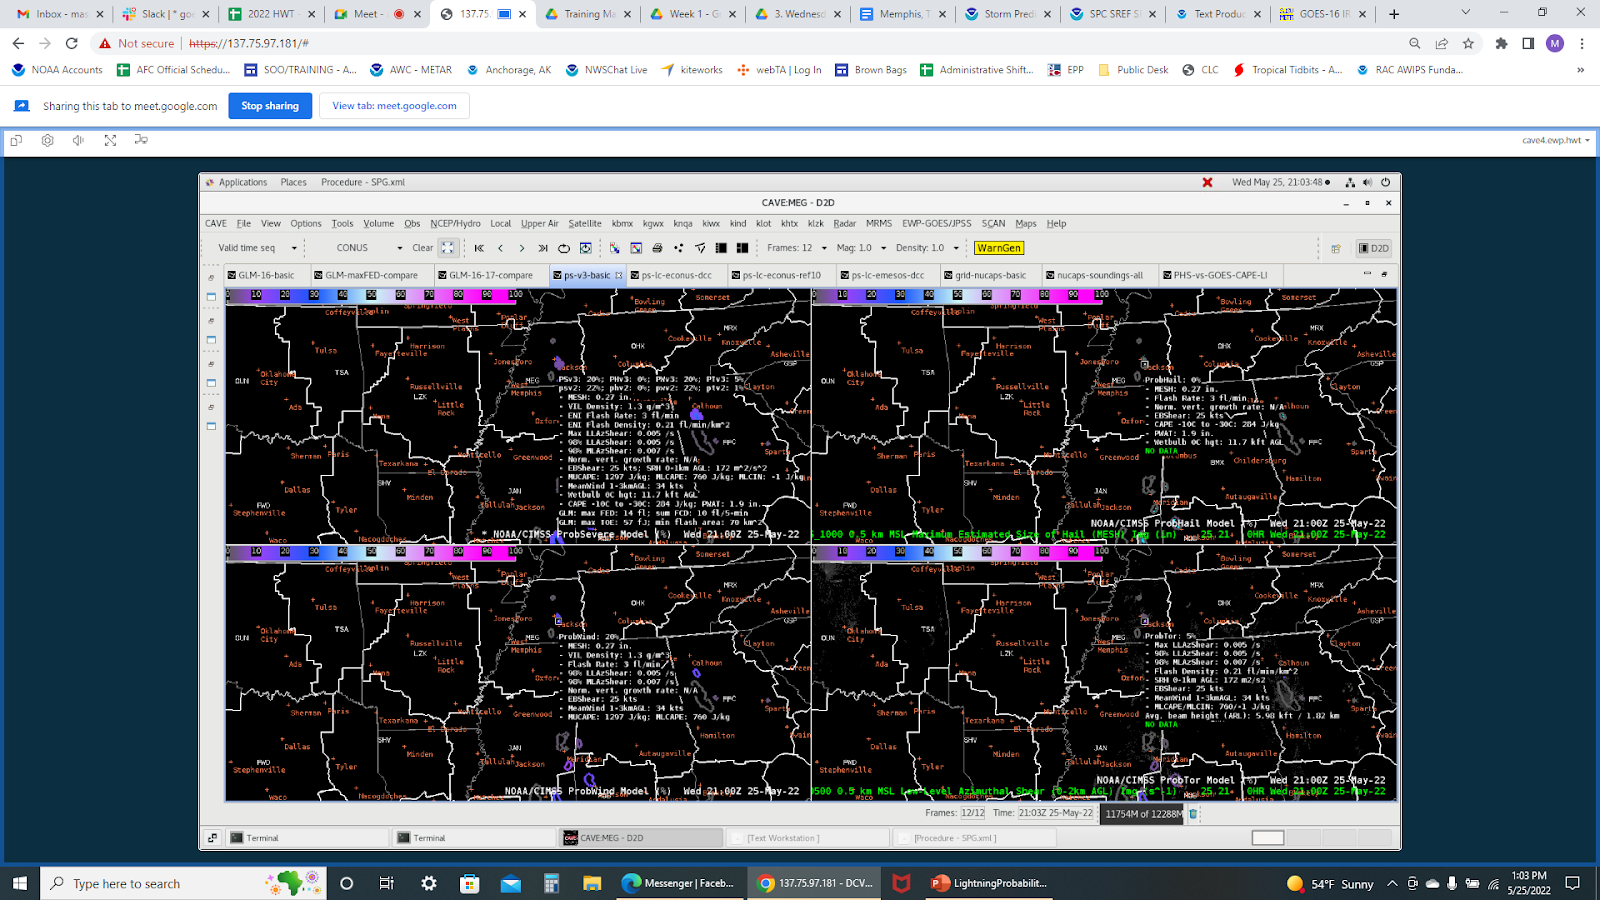
The initial outlook on the PHS model shows limited potential in the CAPE and STP in this area around the DSS at 20Z. However, it shows an increased potential for 21-22Z which may be the time of most concern for my DSS area.
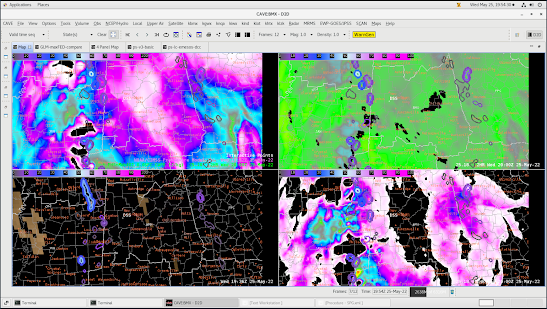
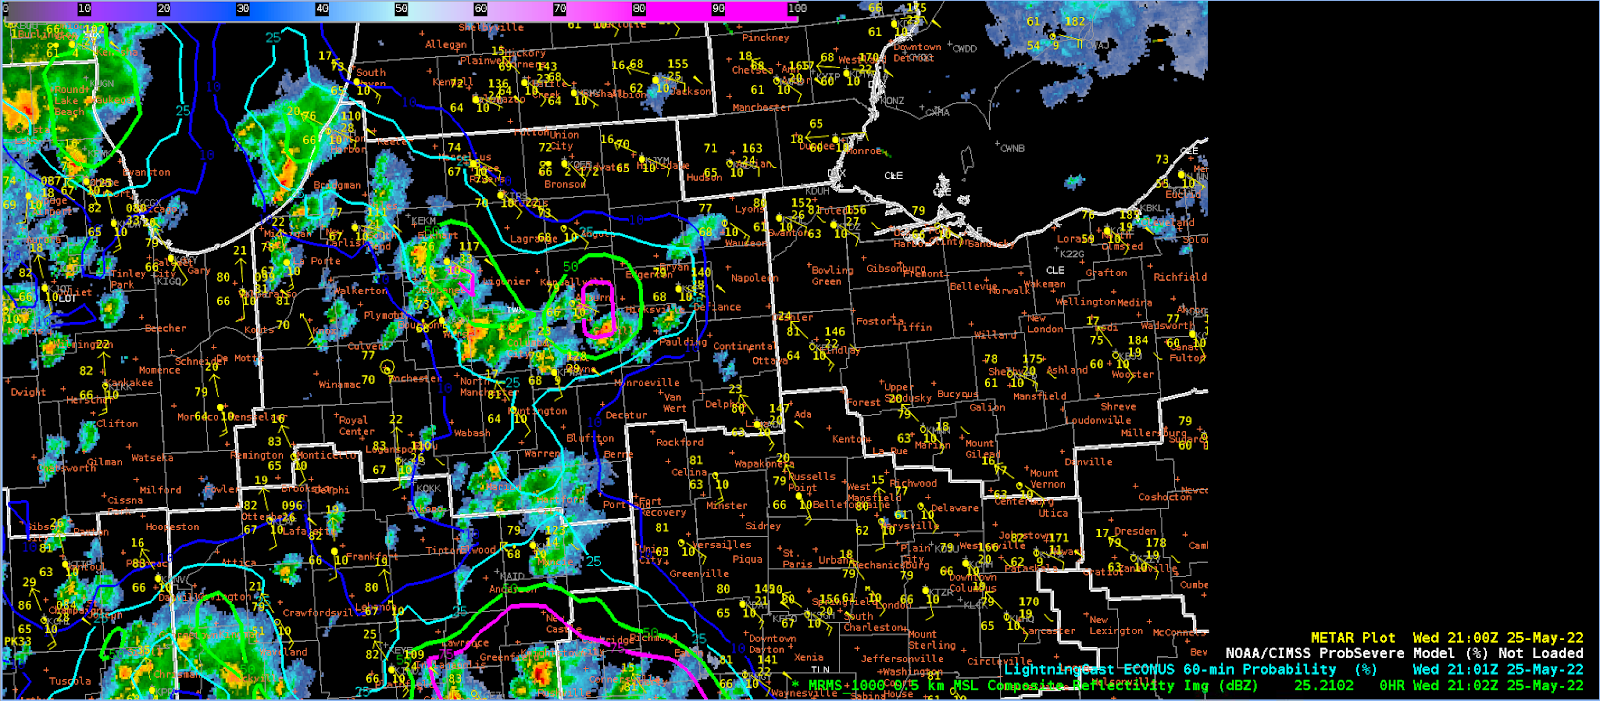
The initial 20Z model showing limited instability and the contoured ProbSevere to show ongoing convection.
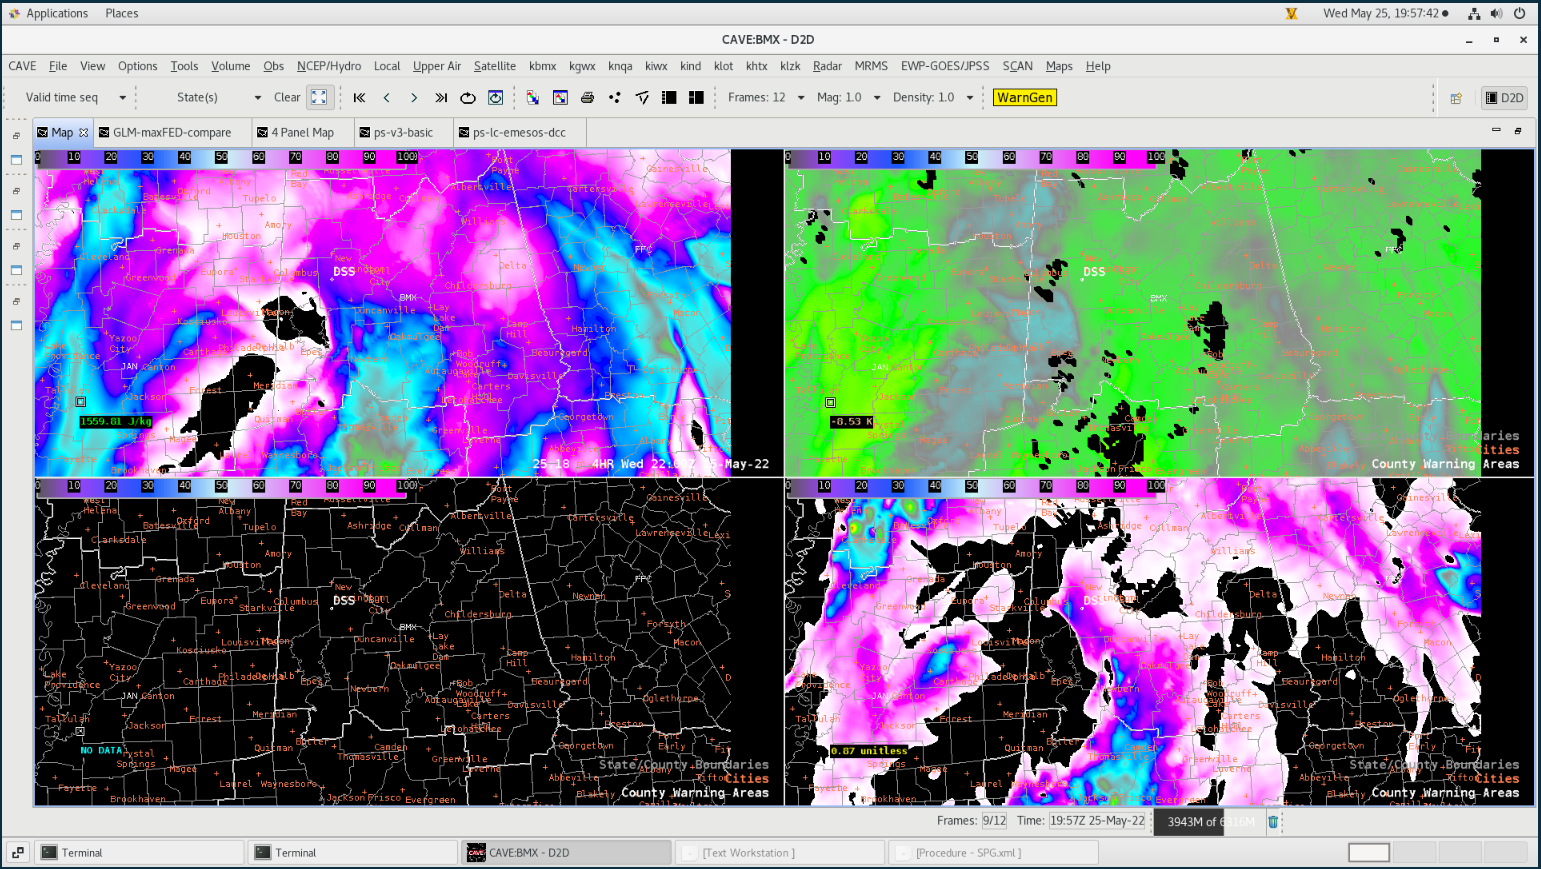
PHS shows a tongue of instability and associated STP as the main convective line lifts northward. This would indicate that the main concern would occur around 22Z.
Based on the line of storms to the west of our DSS event and the associated shower activity lifting northward ahead of the line, the PHS model was accurately representing the convective potential. LightningCast also shows a decrease during this time period which increases consistency and confidence in what the forecaster is seeing.
"Verification"
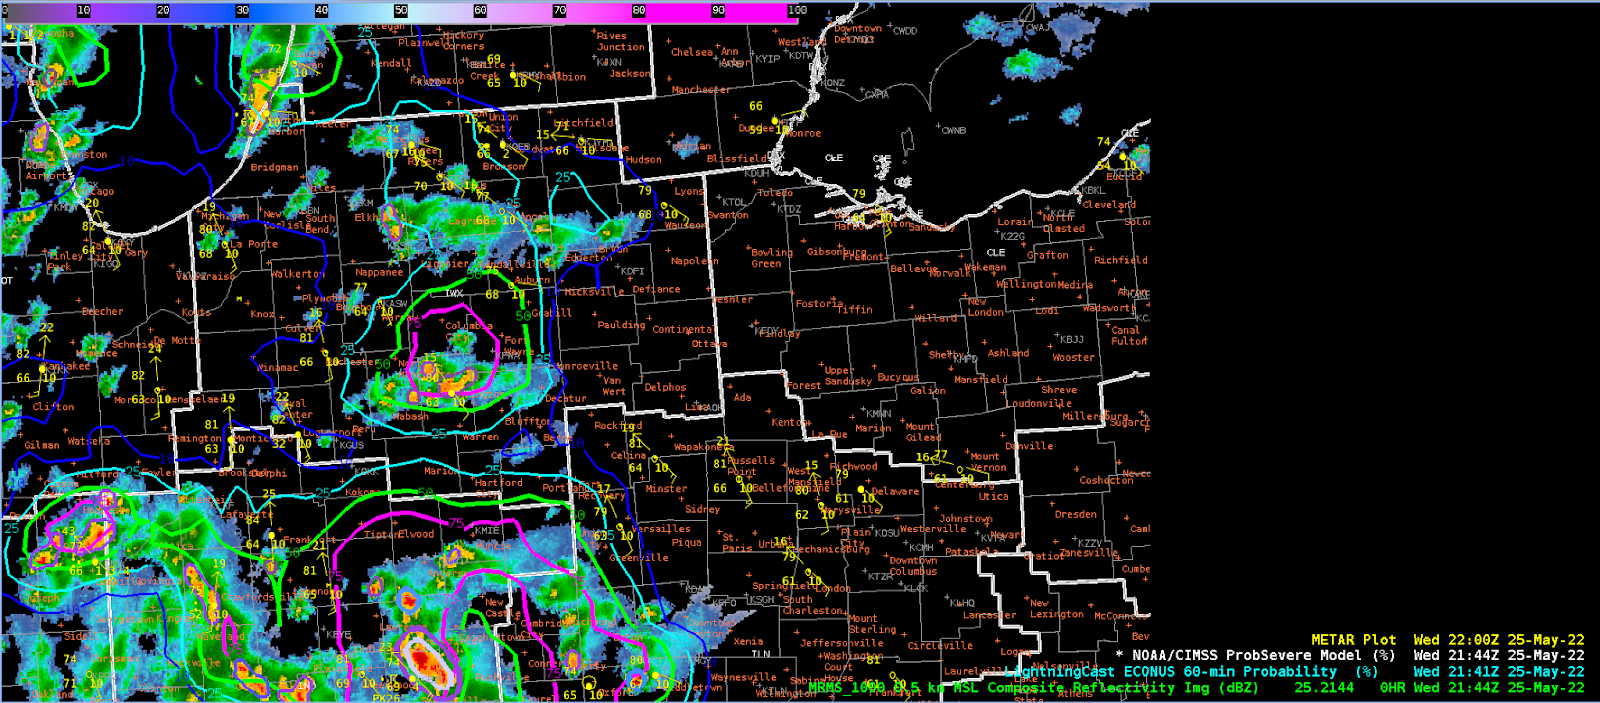
This lack of convection was observed as showers moved through the area without any lightning or wind potential. There was some redevelopment behind the line and to the south of our event that indicated some concern. At 22Z, you can see the line of storms already being analyzed by ProbSevere lining up nicely with modeled instability and other plotted severe weather parameters.

ProbSevere contours and PHS model line up nicely in the 22Z 2-hour model forecast and show consistency in where the area of greatest concern is likely to be.
LightningCast & GLM for DSS
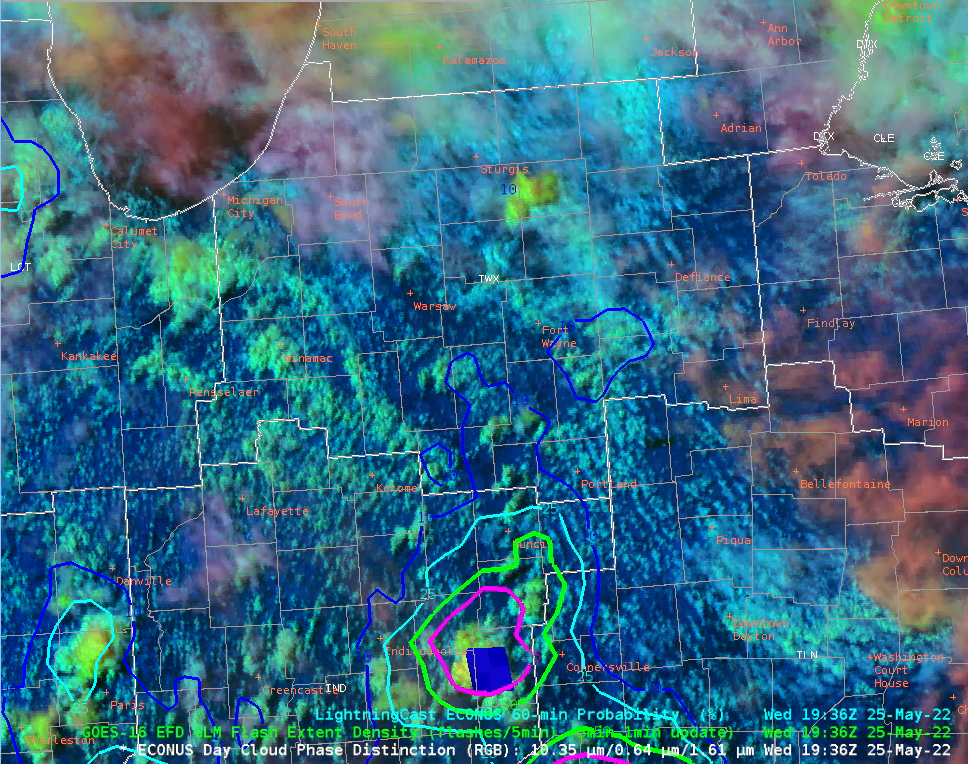
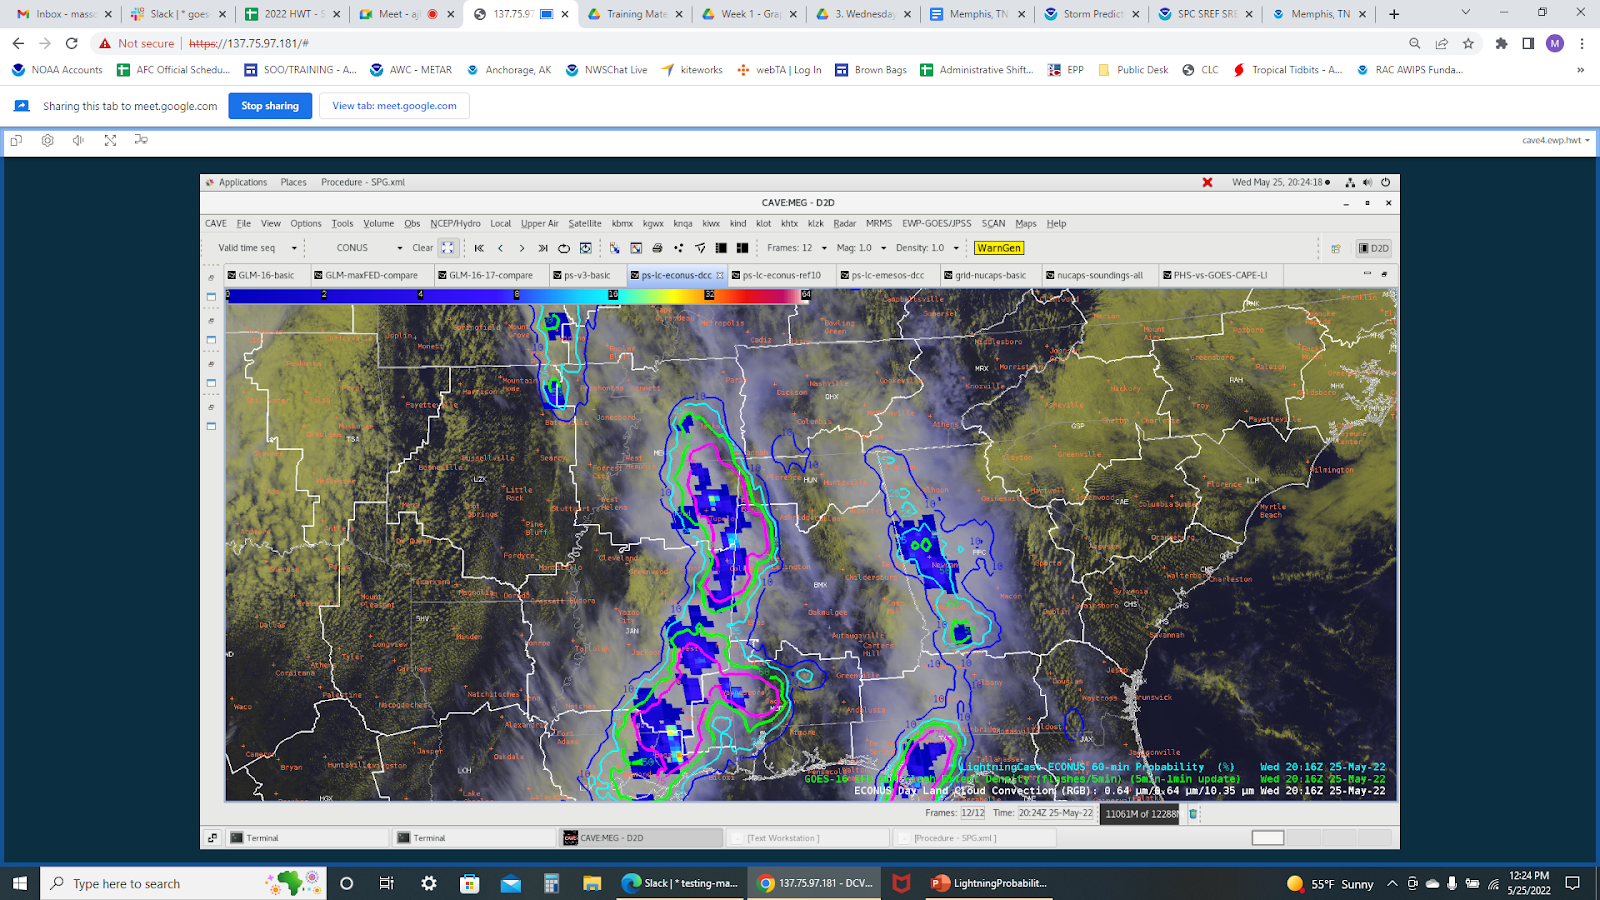
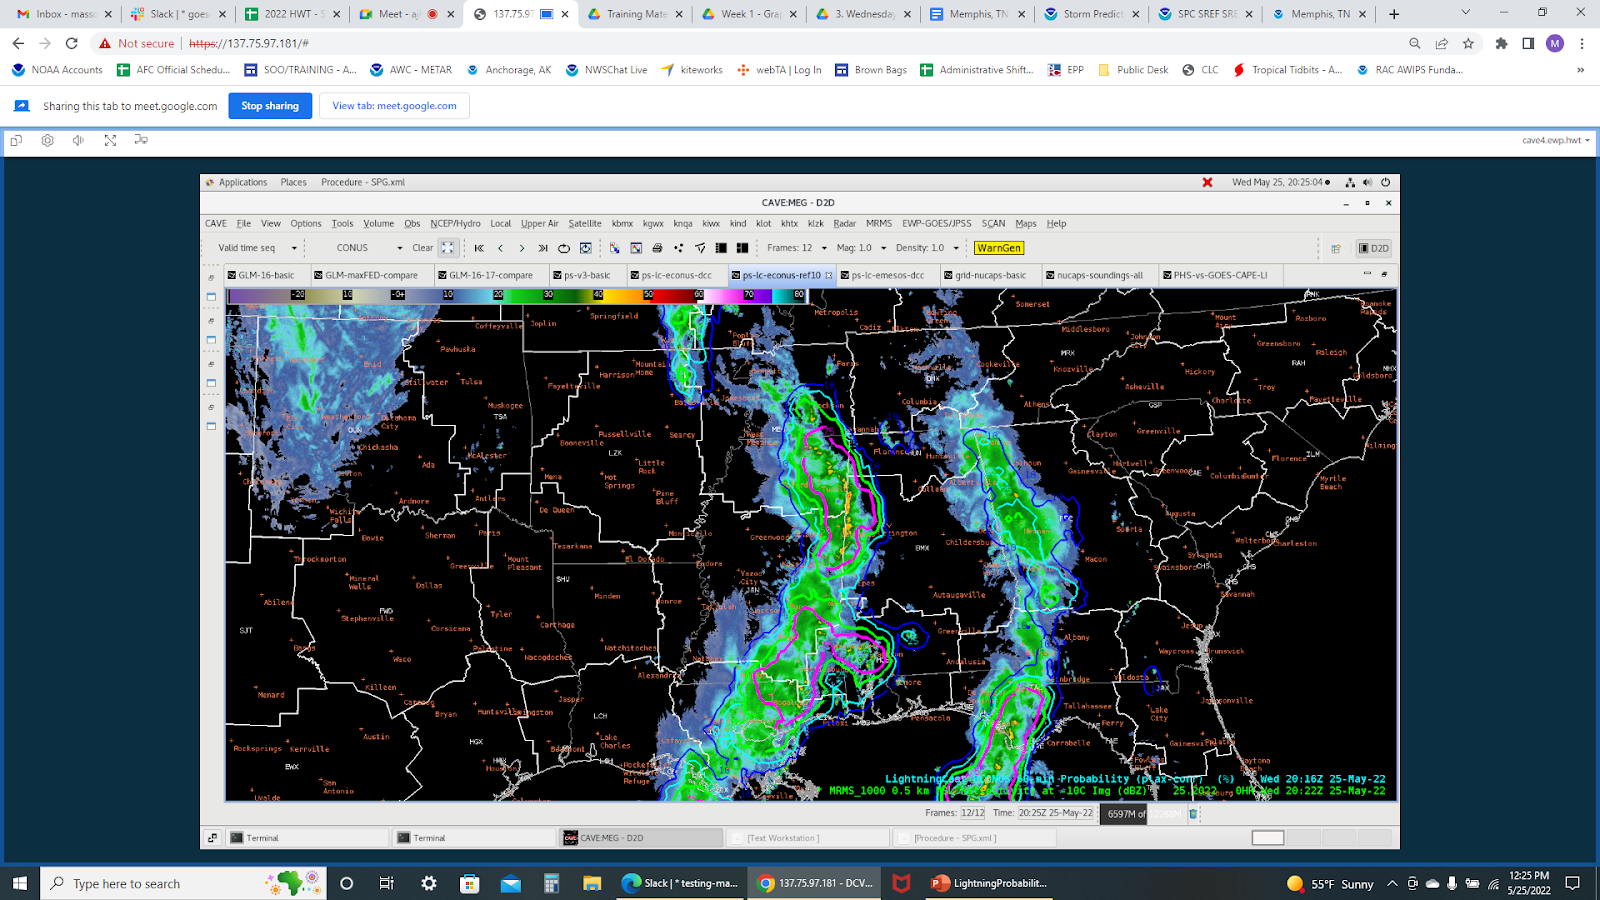
Initially the LightningCast for our DSS event surged to near 50% or slightly above. This was an initial concern for the DSS area.
As these storms weakened, the probabilities of lightning also fell to under 25%. I liked that these probability decreases were not rapid, but a gradual fall after the initial peak. GLM and LightningCast both had a consistent drop in probability and lightning activity as the “storms” weakened.
It is becoming clear that the rate of change of all of these satellite products is the most important information that a forecaster can gain. While an initial picture of the probabilities looks concerning, pairing this with other satellite products for context and seeing the overall trend of this data led to an easy decision to wait for additional data. Taking this at face value would lead to a quick (and potentially unnecessary) reaction.
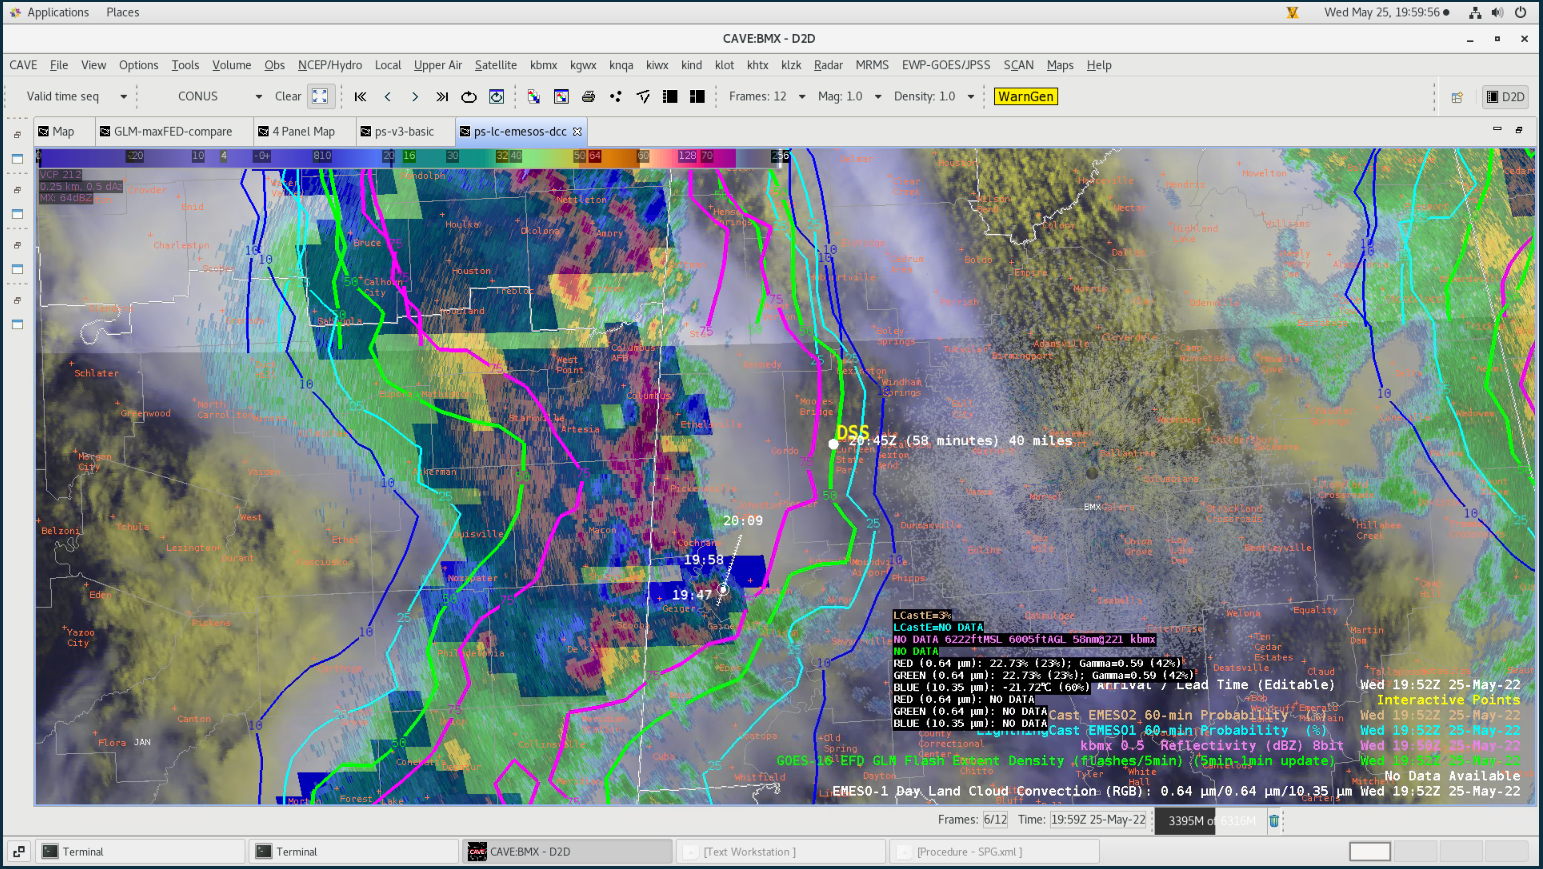
Initial threat of lightning as illustrated by the LightningCast product.

The showers on the SE side of this line have decreased in intensity and have lost most of their lightning potential. The probabilities have decreased accordingly.

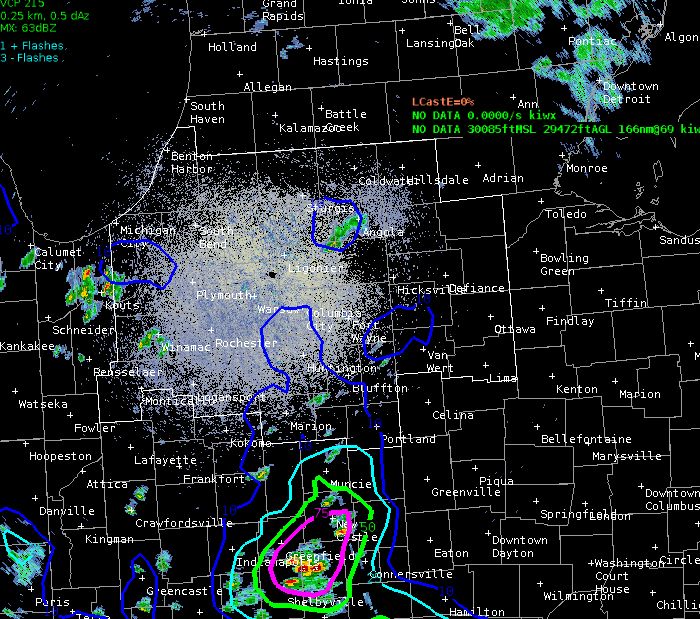
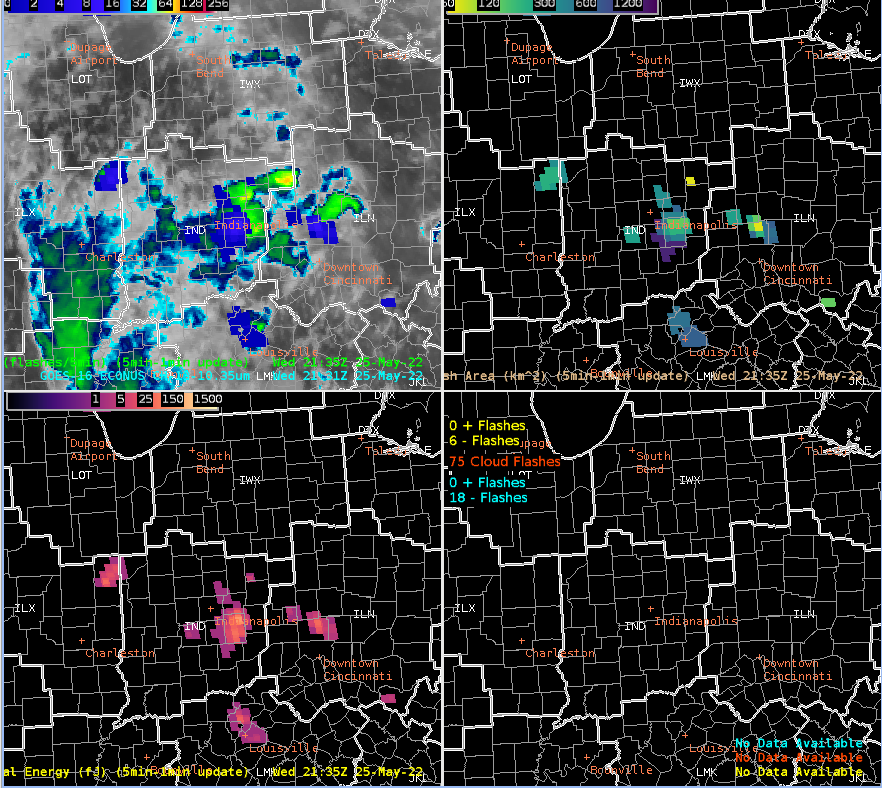
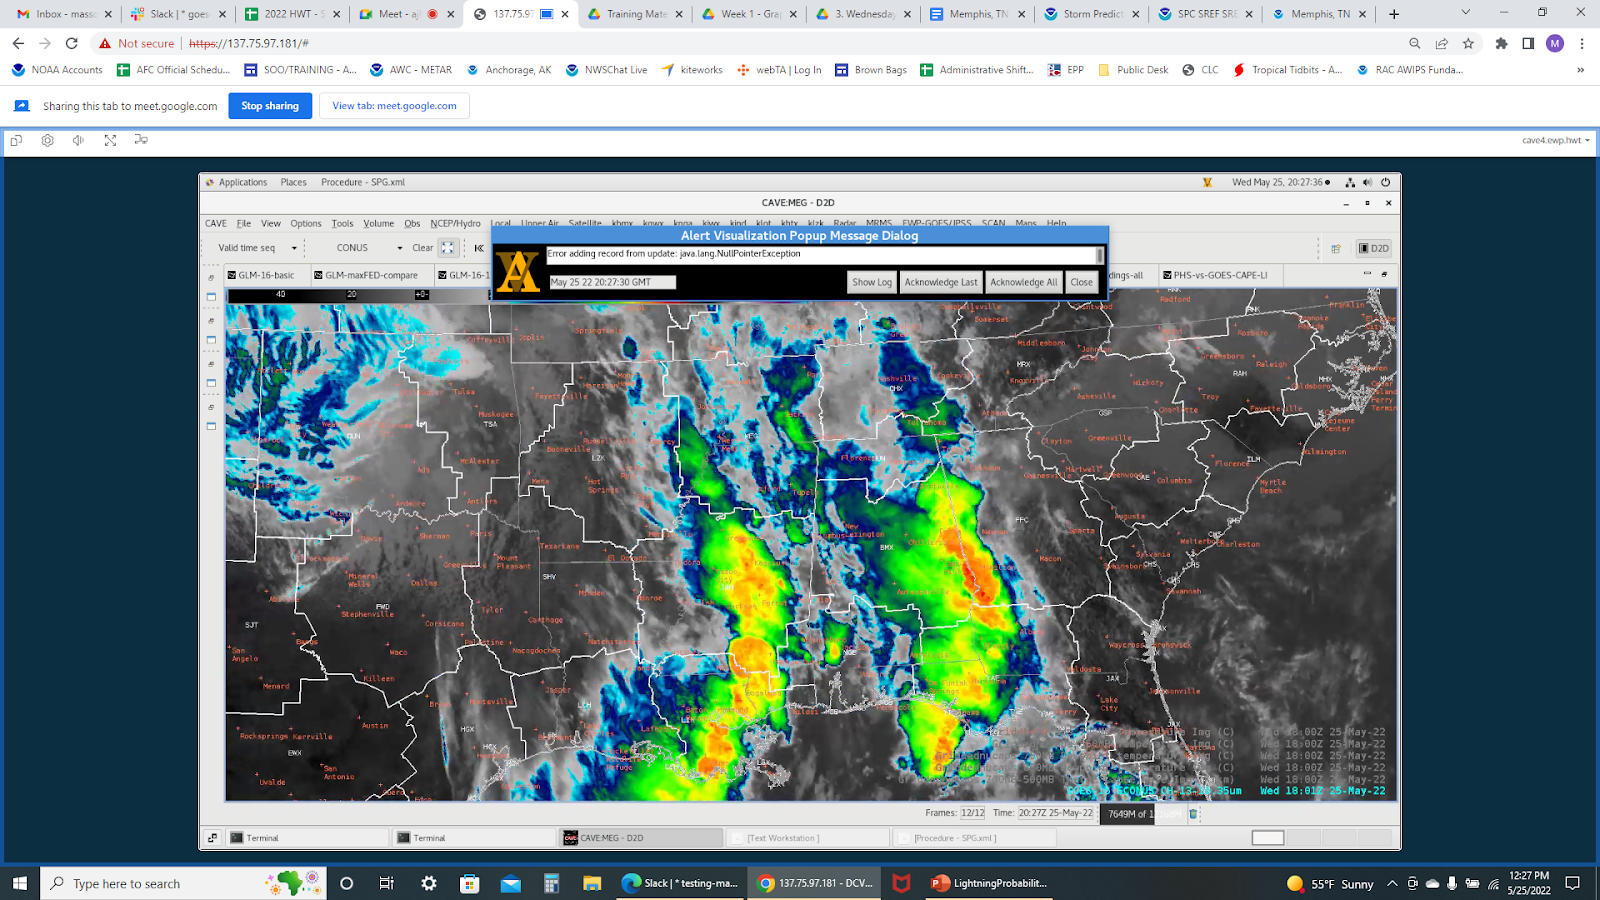
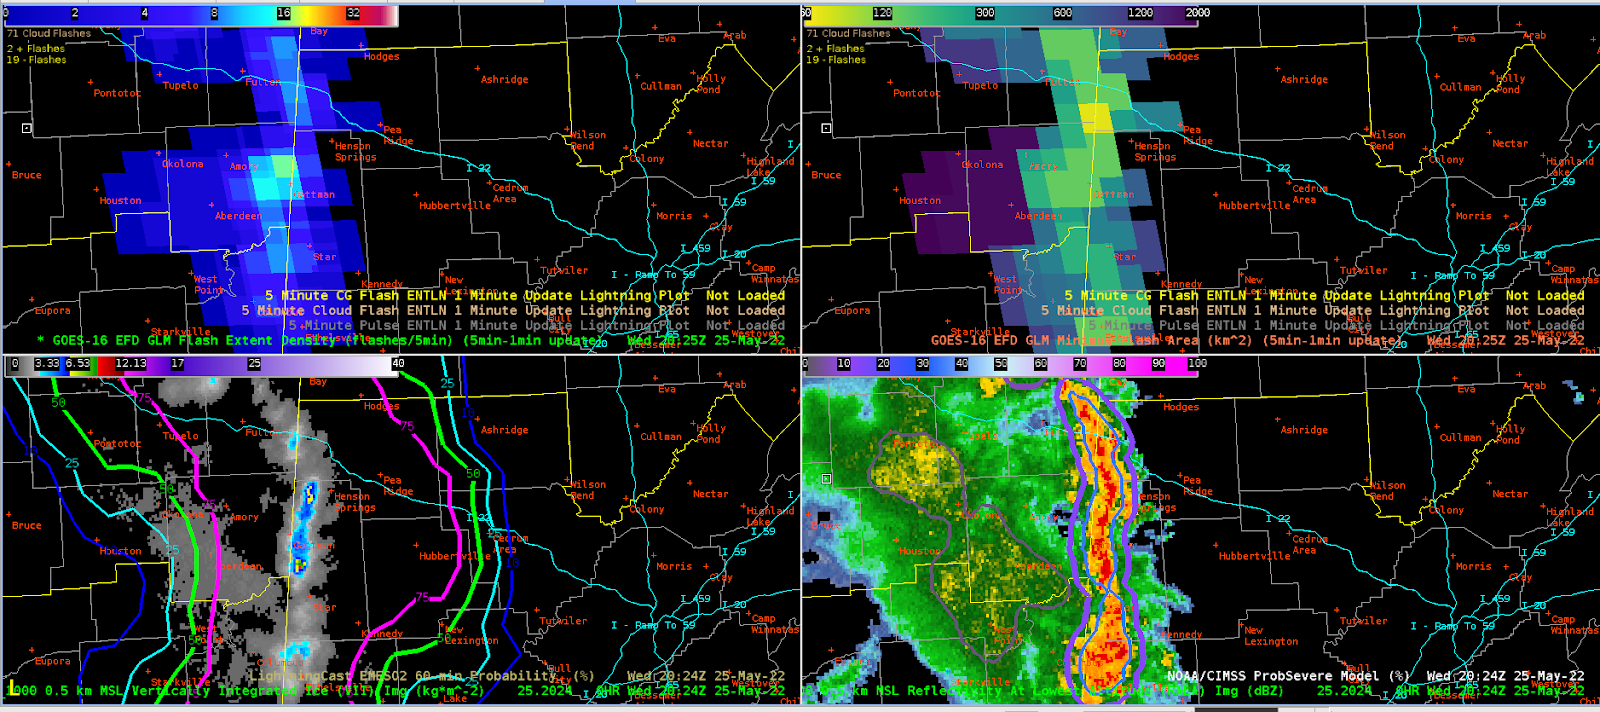
LightningCast, GLM, radar, and satellite showing the decreasing trend in lightning threat and the approach of moderate to light showers on the DSS event.
Showers are expected within the next 30-40 minutes and the trend in lightning appears to be going down consistently. GLM has also been helpful in showing that no cloud flashes have been observed at this stage.
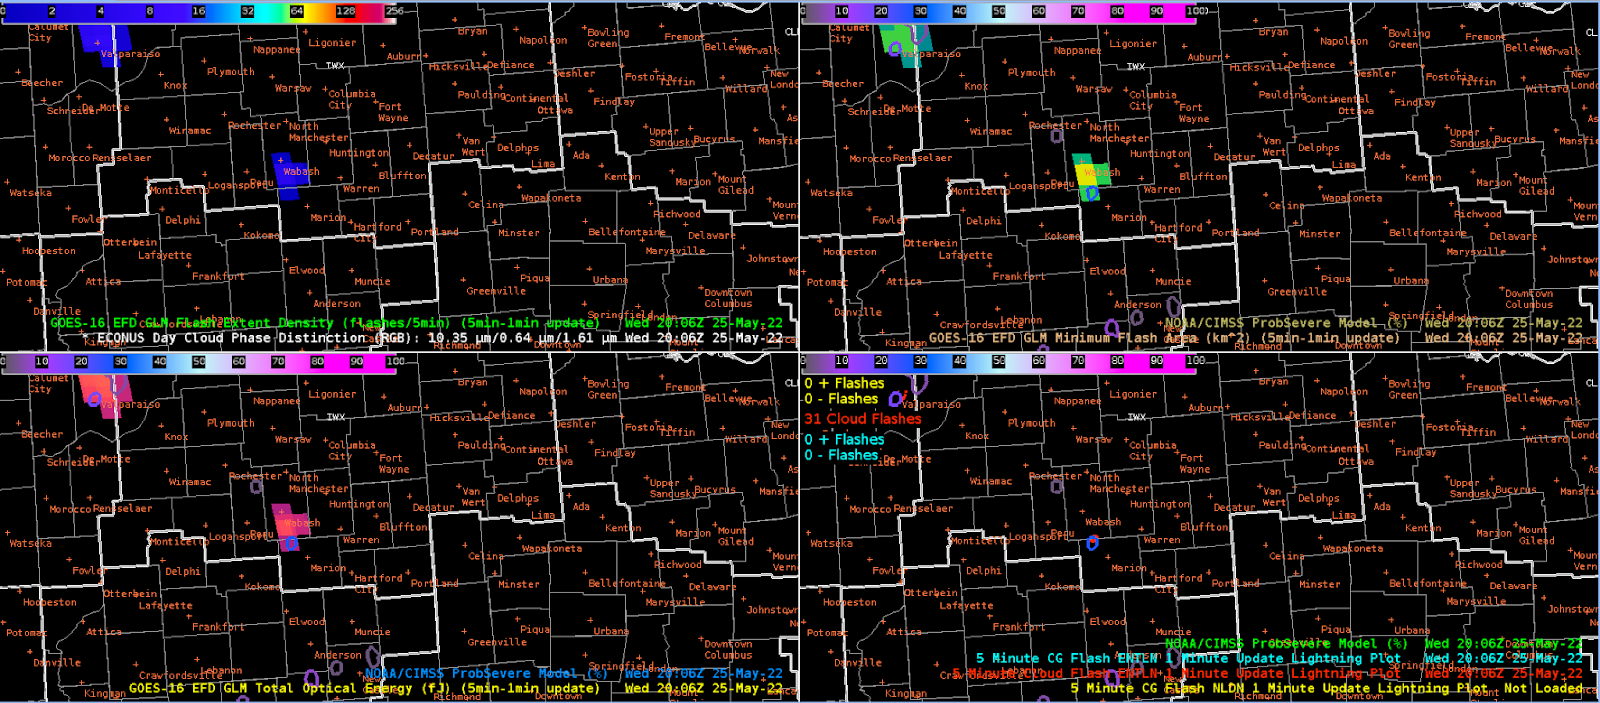
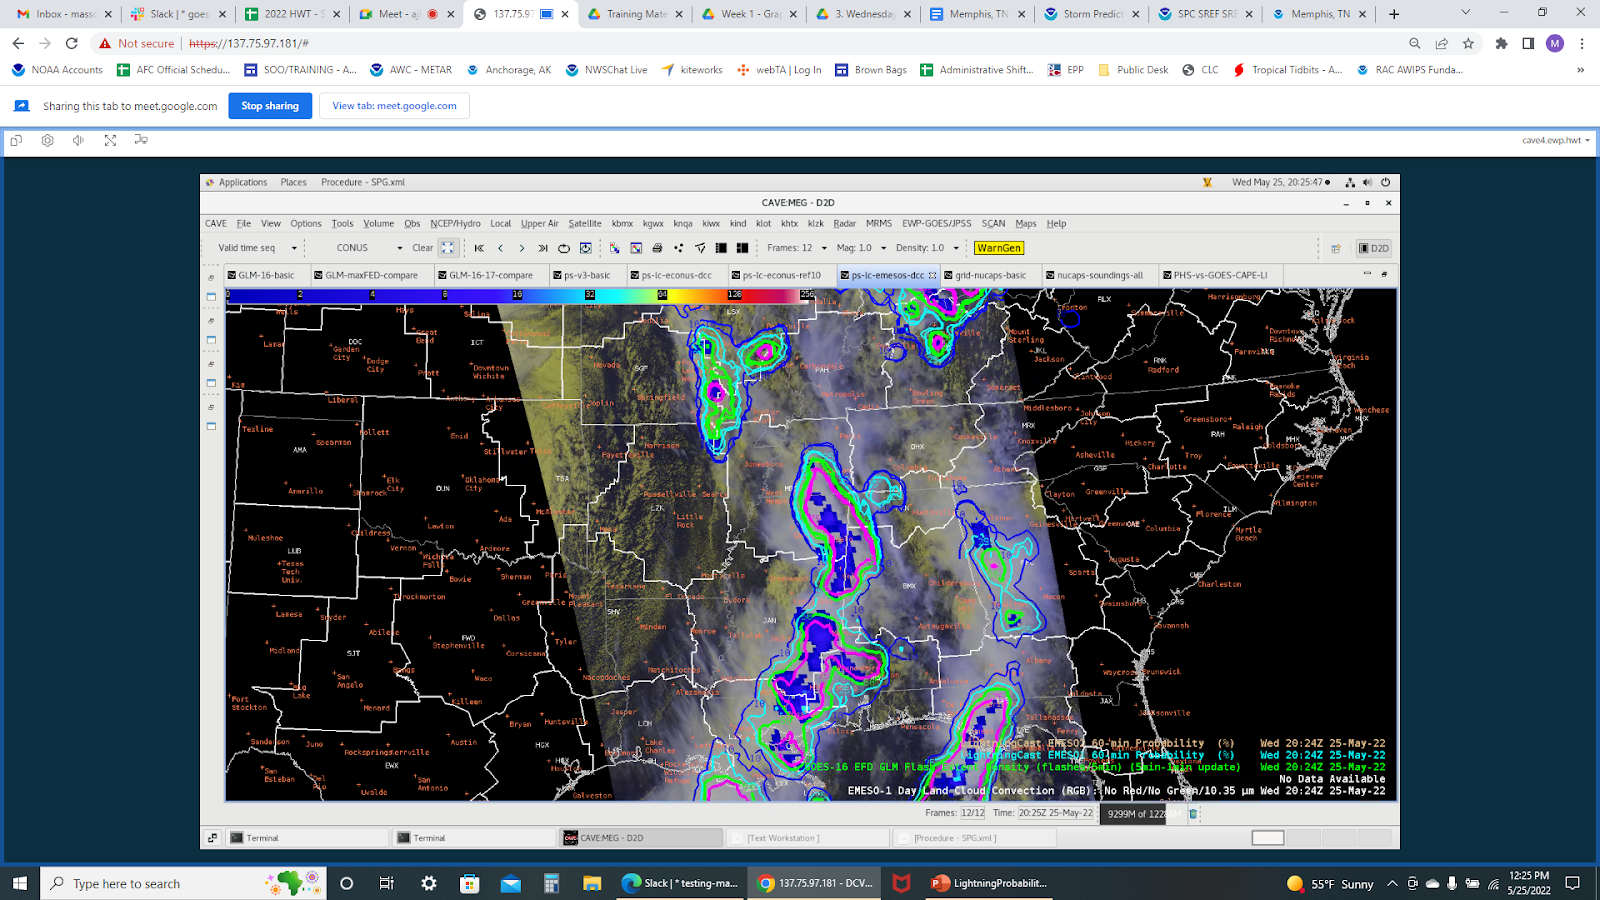
There were some minor inconsistencies that I noticed since the Meso-sectors were both over our CWA. These were mostly minor, but I noticed at one point, a location had a probability of >50% or 0% and did not intersect with GLM measurements.

Inconsistencies in GLM and LightingCast Meso1/Meso2 probabilities. It seems the accurate probability here was 0% based on the lack of ground-based lightning network reporting.
As PHS indicated there was a second and more concerning wave of convection moving from the SW toward the DSS event area later in the afternoon. GLM and LightningCast probabilities both show the strengthening of this pulse and the increased lightning activity as it moved into the BMX CWA.

21:26Z, the storm indicated a 10% chance of lightning at the DSS event area.
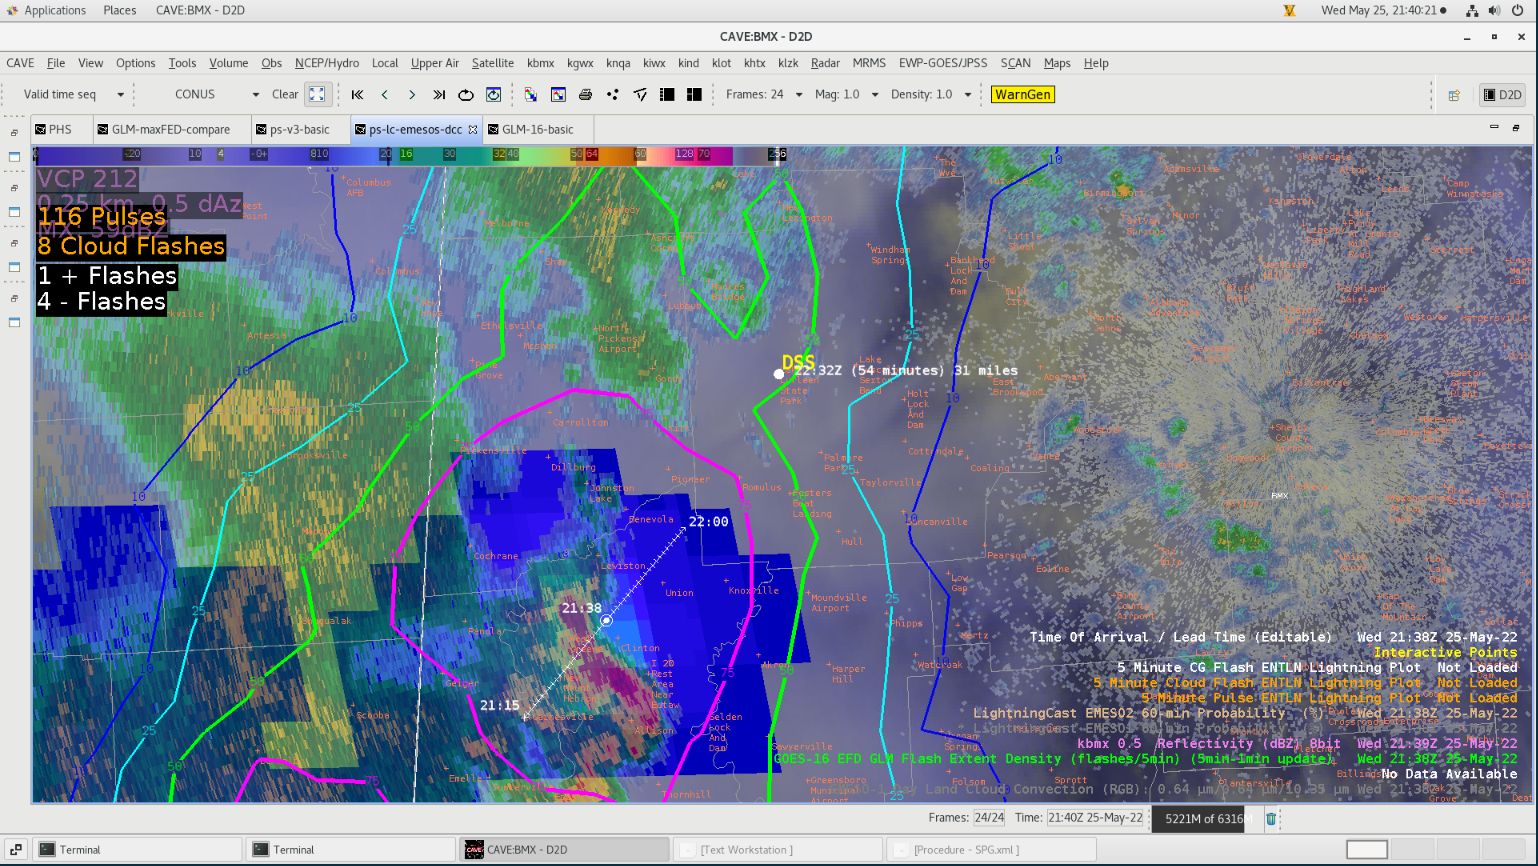
21:36Z, the storm indicated a 50% chance of lightning at the DSS event area.
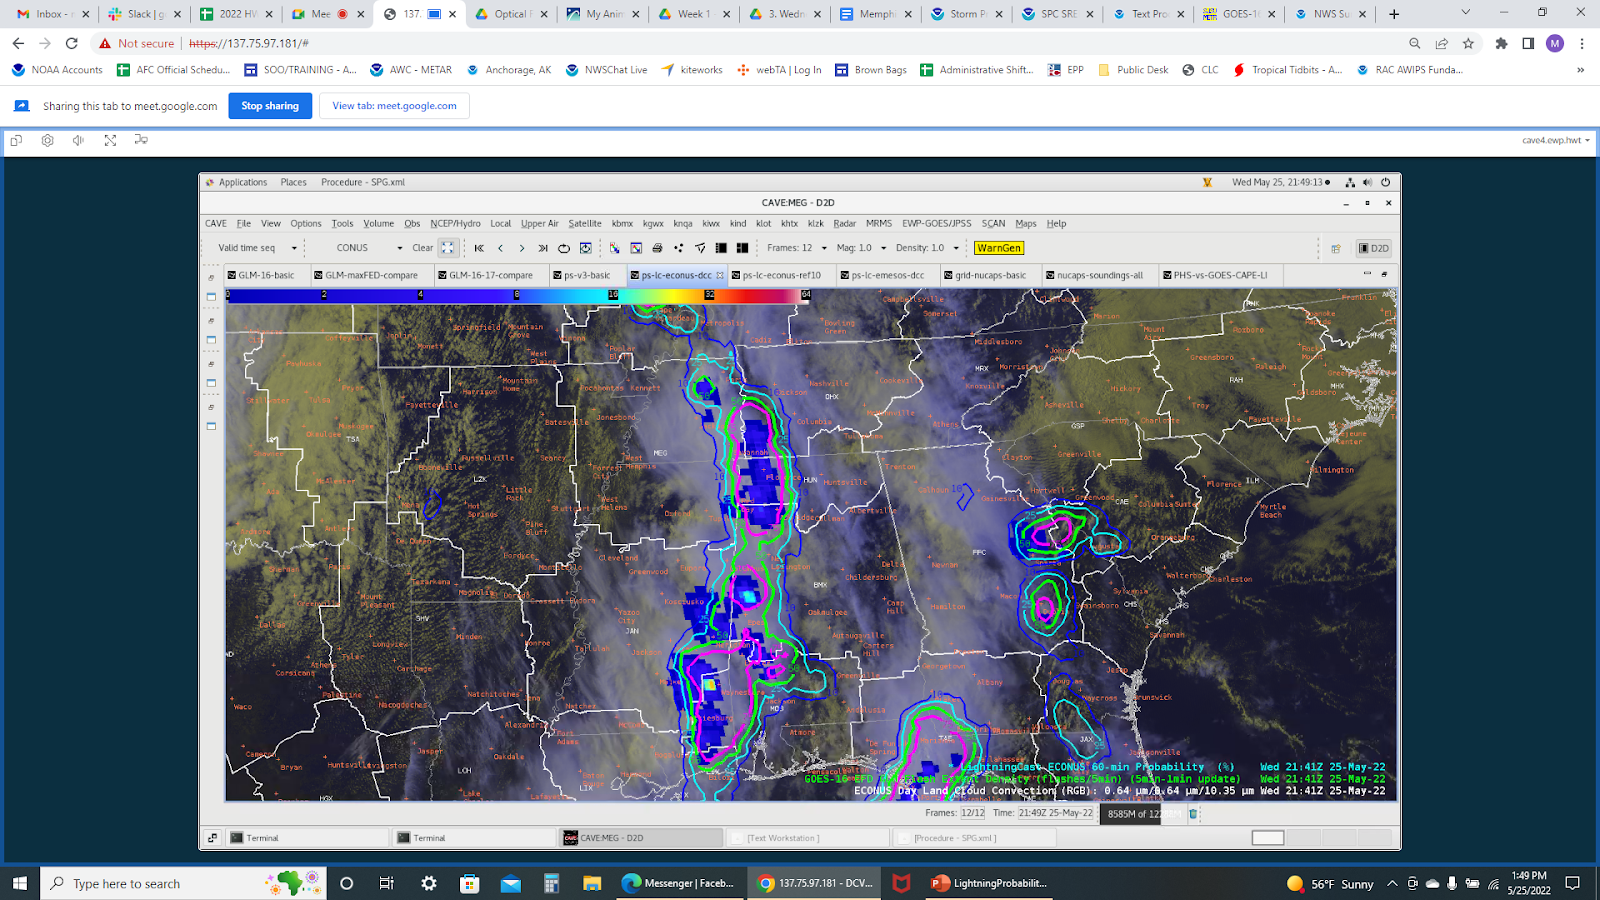
The 45-minute warning was given at 21:50Z to the event coordinator that a storm with the potential of producing lightning and winds in excess of 30 mph was approaching the event area. GLM was a key part in this decision as it continued to show strengthening with lightning pulses indicating that the storm was at least maintaining its strength. The LightningCast probabilities were also increasing as they approached the area with the 75% contour moving into the area by 21:52Z.
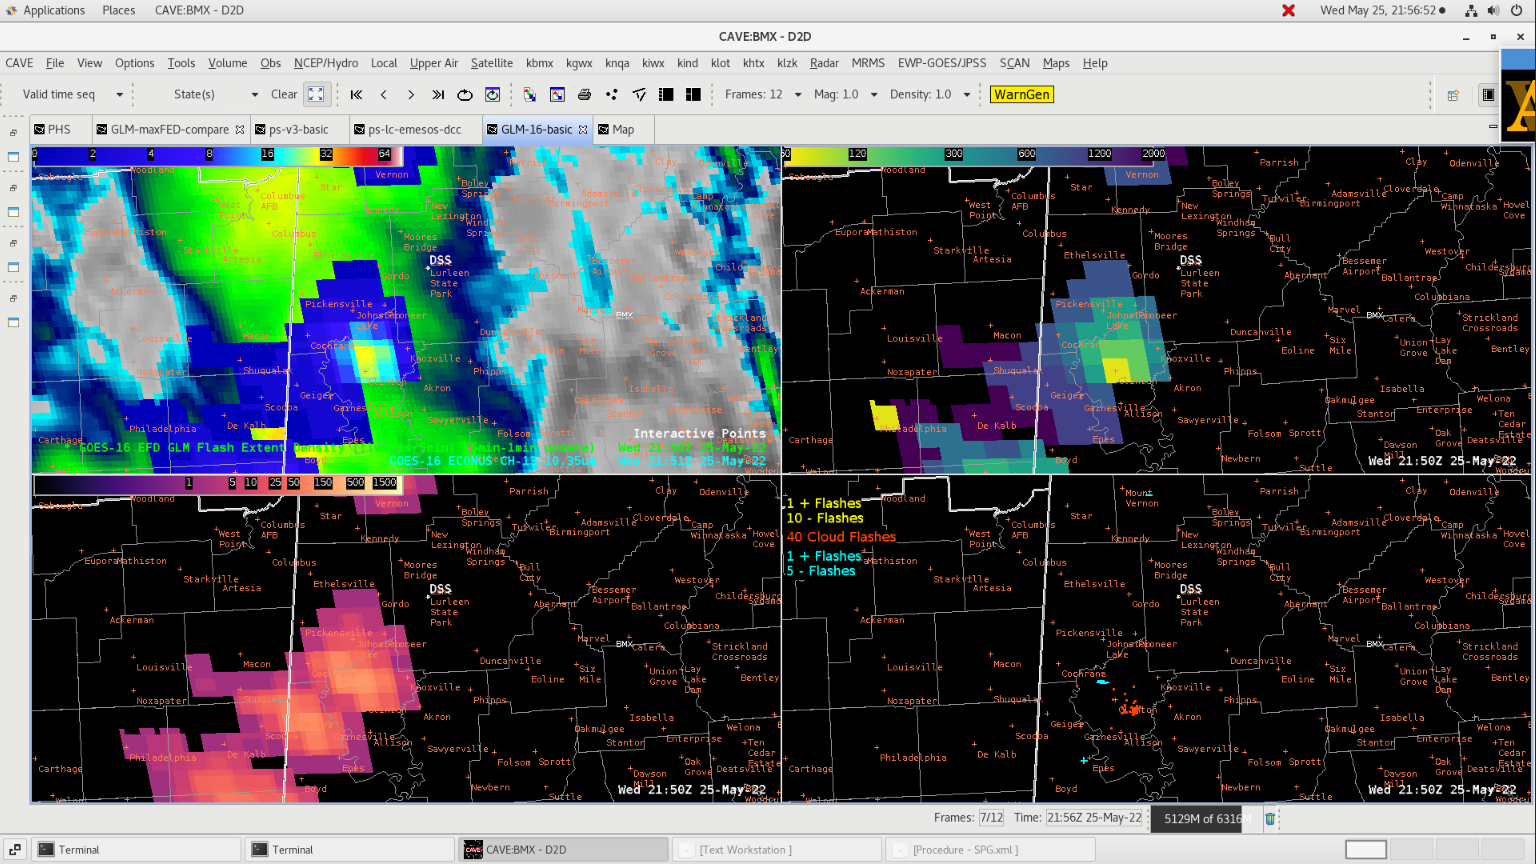
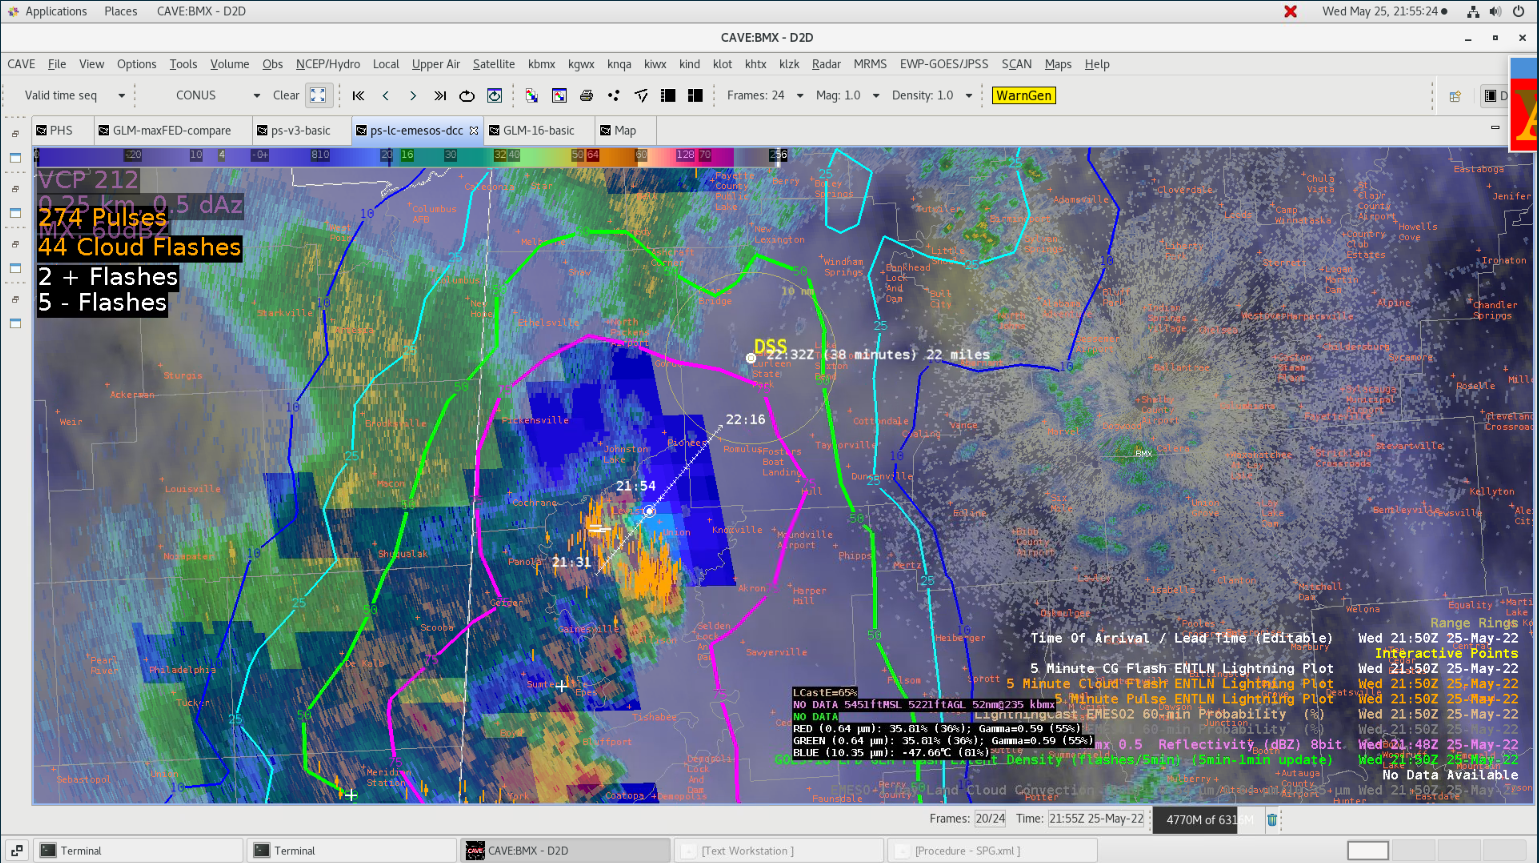
GLM (top) and LightningCast at the 45-minute DSS decision point.
The pulses weakened significantly as it approached the area and this was consistently evident in the GLM display and the LightningCast probabilities.
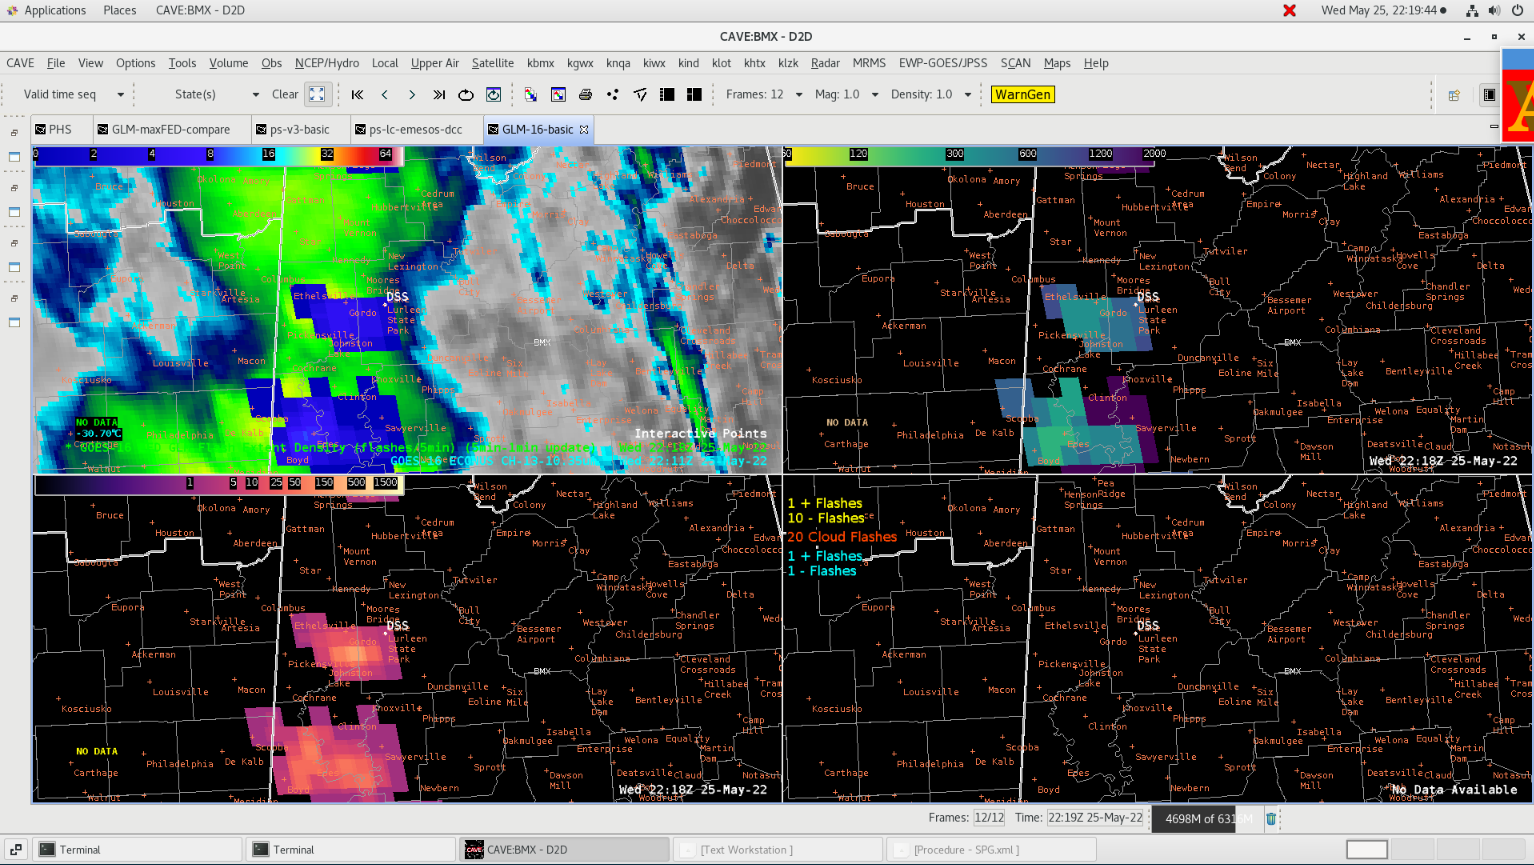

GLM (top) shows the MFA increasing and the FED decreasing. This was consistent with radar data and observed lightning pulses. The LightningCast probabilities also decreased.
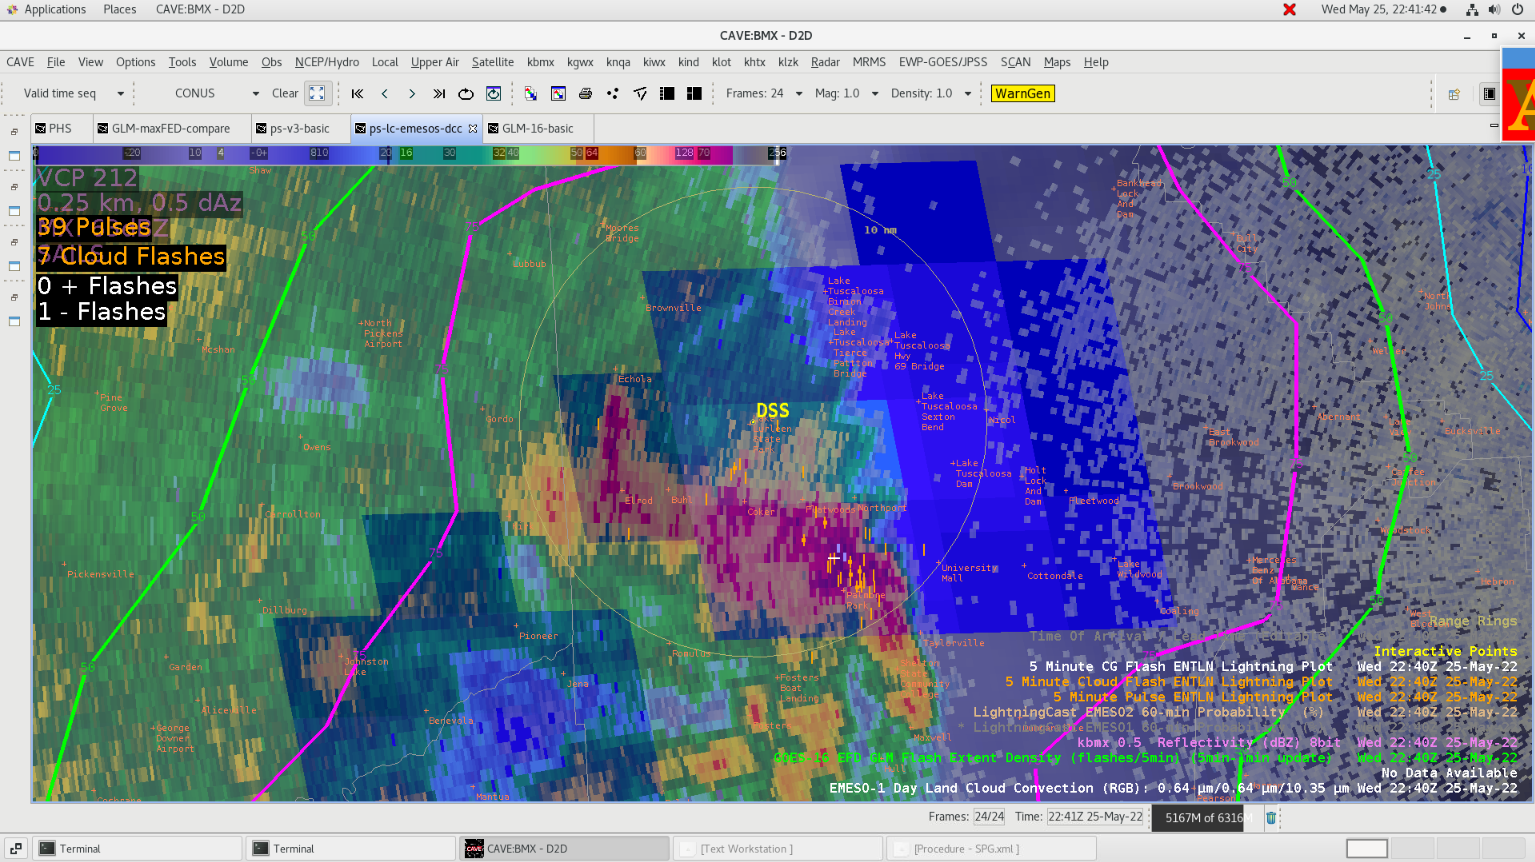
Lightning occurred in the area around 22:38Z with GLM showing another pulse beginning as the storm moved through our DSS area.
In general, I found GLM to be much more useful today outside of the supercellular mode with more multicellular convection observed over central and southern AL and especially so for identifying strong cells within a linear structure.

ProbSevere v3
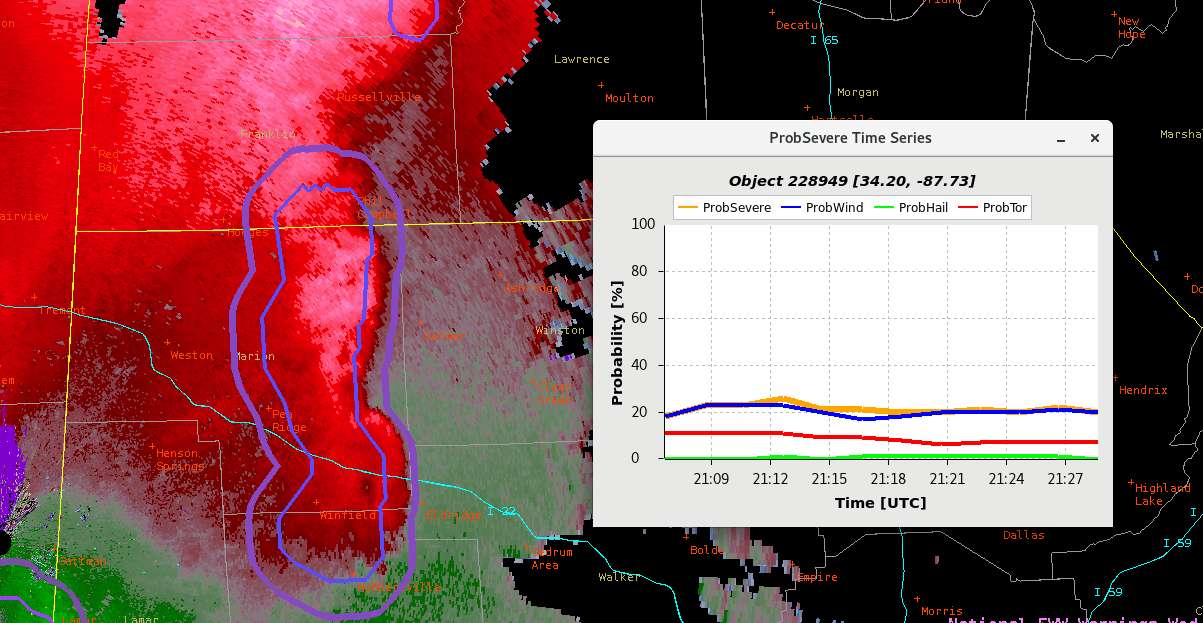
In a DSS setting there isn’t a real reason to use ProbSevere v3 because winds far below the 50-knot threshold could cause problems at our DSS events. That being said, there was great information in the trend graphic as I could see the growth and decay of storms that were already in progress. This allowed me to focus my attention on the strongest storms.
NUCAPS
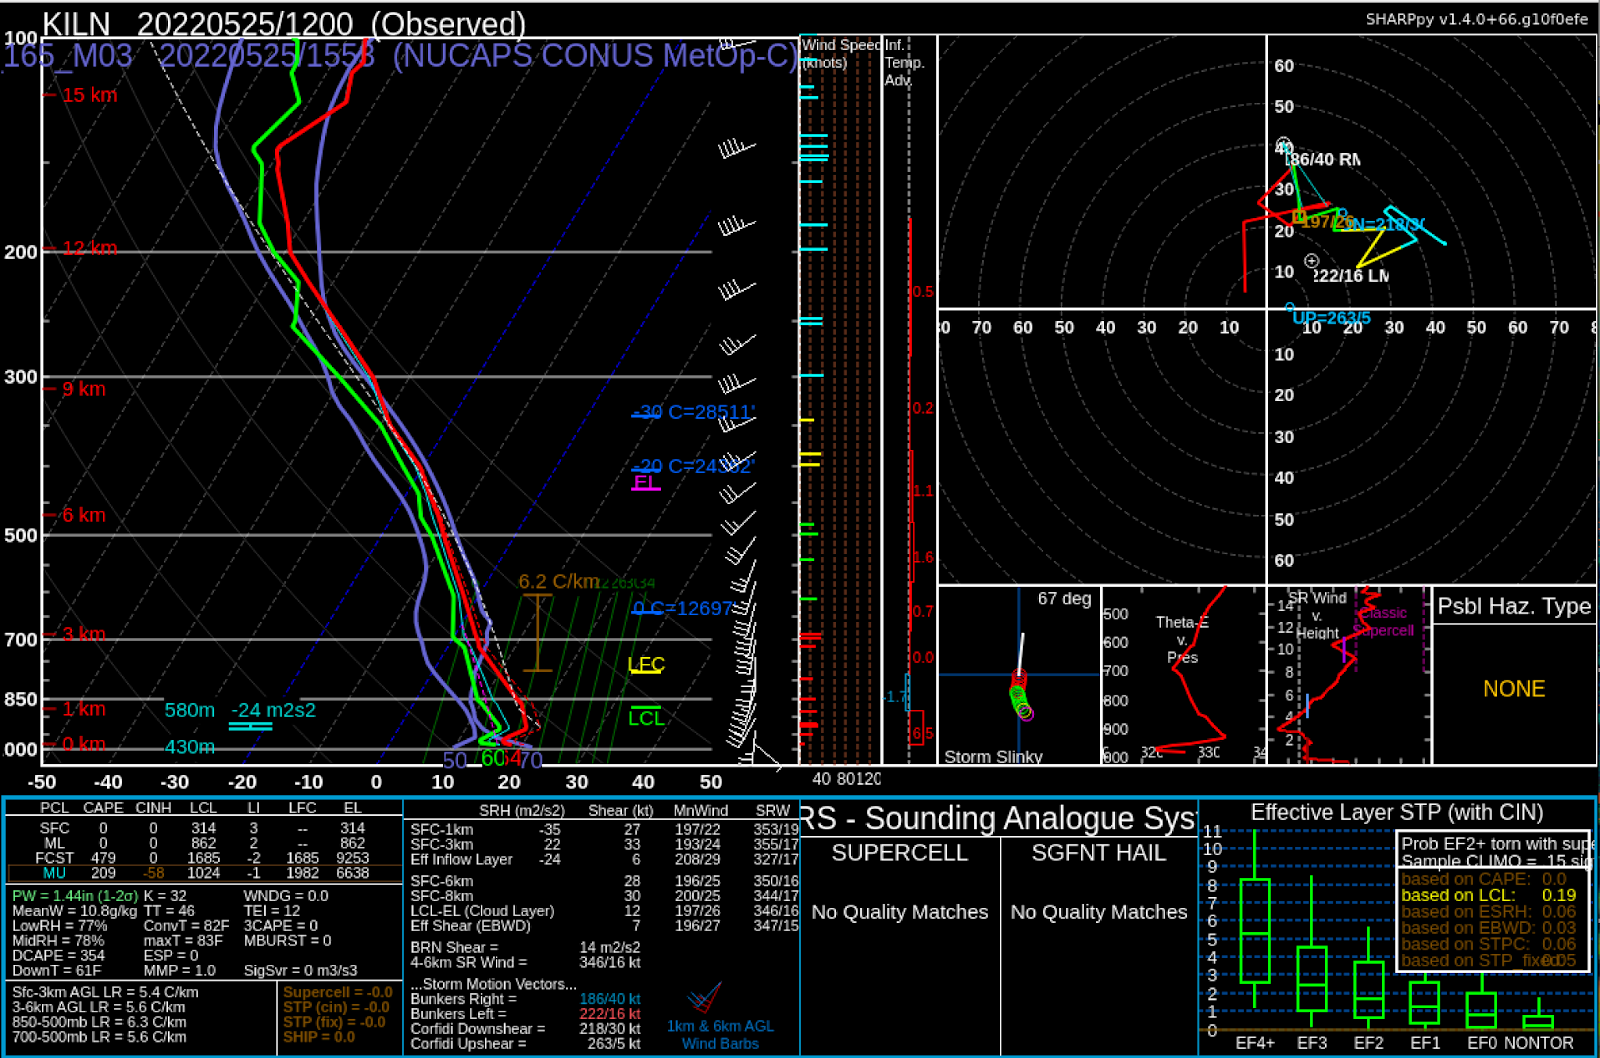
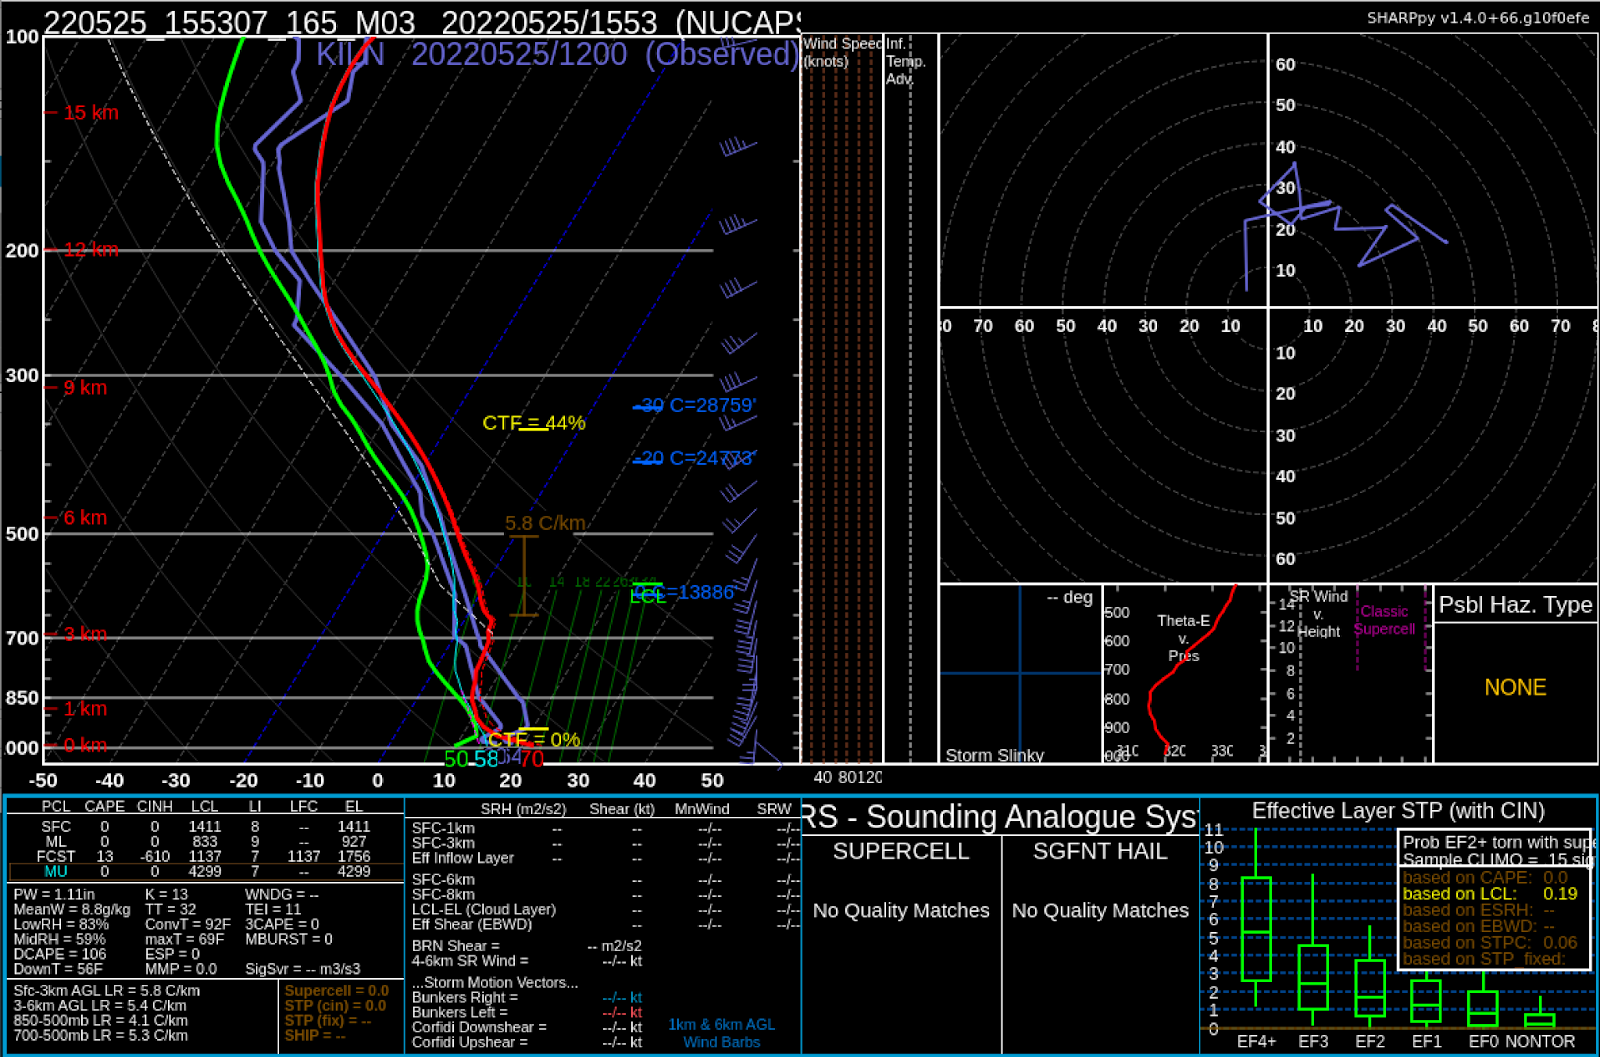
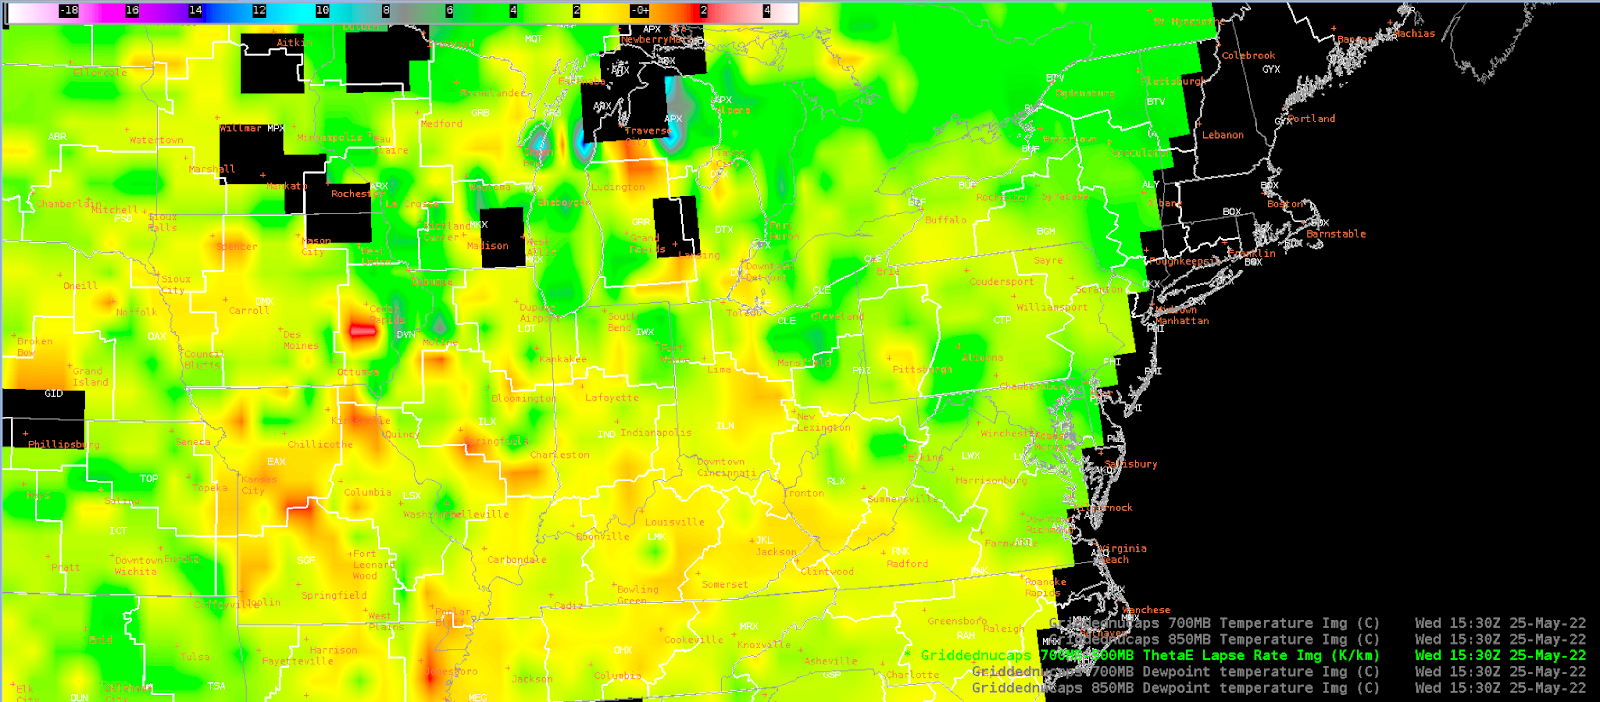
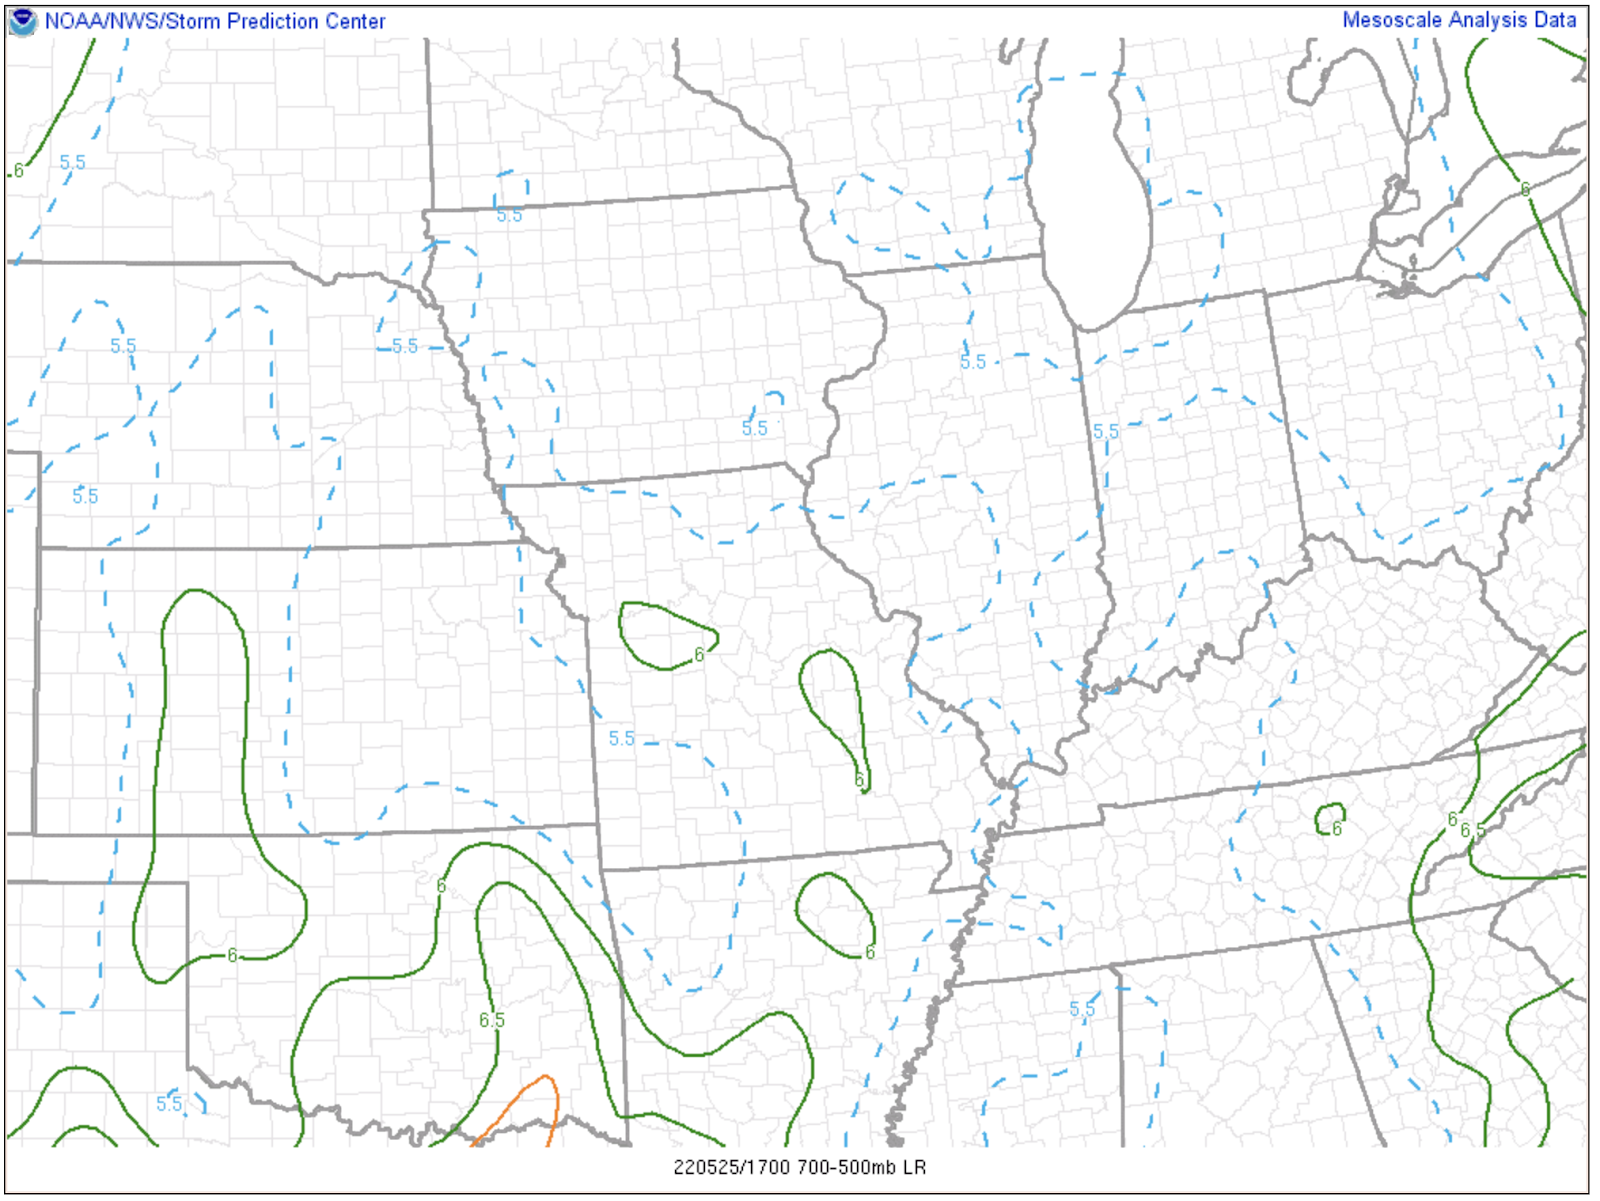
Ongoing convection ahead of the line of storms limited the NUCAPS ability to produce good data. Availability of soundings was also an issue as the data came in between 19-20Z with storms ongoing near my area of interest.
Optical Flow Winds
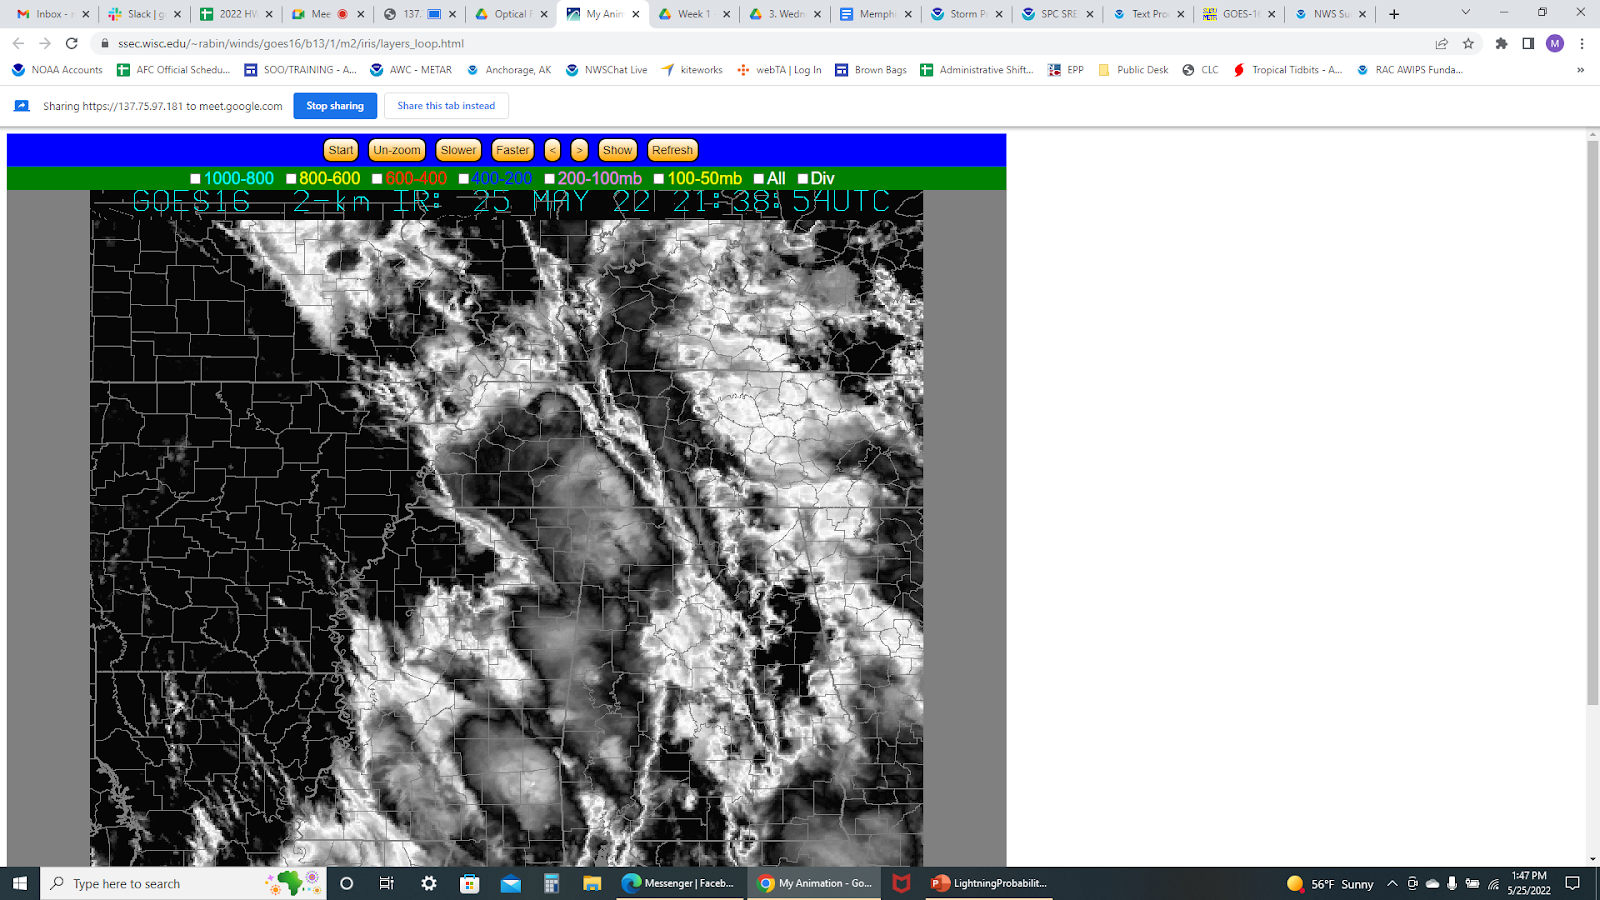
For the optical flow winds, there wasn’t much in the way of DSS that I could find a use for. The divergence field again could be useful, but with the suite of GLM I was seeing the divergence and strengthening of the storms in multiple products. Visualization is still the main hurdle with OFW.
Once the anvil for some of these storms developed it was difficult to use. Especially as debris clouds developed and overspread the area in advance of additional convection behind the initial line.
- Overcast Ambiance