Tuesday, June 22, 2021

Sampling of Sub-Severe Convection Across the Southeast

 Modified NUCAPS sounding appeared to have a better handle on the environment compared to baseline NUCAPS sounding. However, it also appears it might not be totally representative of the atmosphere given the partly cloudy conditions at the time RTMA data was pulled in. The SPC mesoanalysis page suggested MLCAPE upwards of 2500 J/kg in an uncapped environment.  Using the gridded mid level lapse rate product from NUCAPS we found the data to be representative. It verified well with what was shown in the NUCAPS soundings and matched with the values suggested by the SPC Meso Analysis page.

MODIFIED SOUNDING 1927UTC – WEST HINDS COUNTY, MS

MODIFIED SOUNDING 1927UTC – WEST HINDS COUNTY, MS

1927UTC BASELINE SOUNDING – WEST HINDS COUNTY, MS

21UTC 700-500MB LAPSE RATES

The NUCAPS mid-level lapse rates were fairly representative when compared to the SPC mesoanalysis page. This was further evidence that large hail was probably not going to be in the cards for the Jackson area today, but marginally severe wind gusts would be something to watch.
16 UTC 700-500MB NUCAPS GRIDDED LAPSE RATES, SAMPLE NEAR THE SOUNDING DATA POINT

Prob Severe version 2 vs version 3, particularly in prob severe wind:

In this event, the prob severe there was a sig wx statement and severe thunderstorm warning put out by the Huntsville office. Around that time, the prob severe was increased specifically for the prob severe wind component. The version 2 had a prob severe value of 3% while the version 3 had a 53%.  Version 3 better captured the significance of the storm with a 40 mph gust reported around the same time.  This is significant since we were also discussing how filtering lower prob severe thresholds would be useful in decluttering the operational screen. We could have missed this event if that was the case (with version 2).

Based on this experience, we can see the vast improvement in the wind component of prob severe version 3.

21:16 UTC ProbSevere Sample (note V2 versus V3 differences in sample).

Local Storm Report of a measured 41mph wind gust in Colbert County AL, just north of the contoured ProbSevere storm.
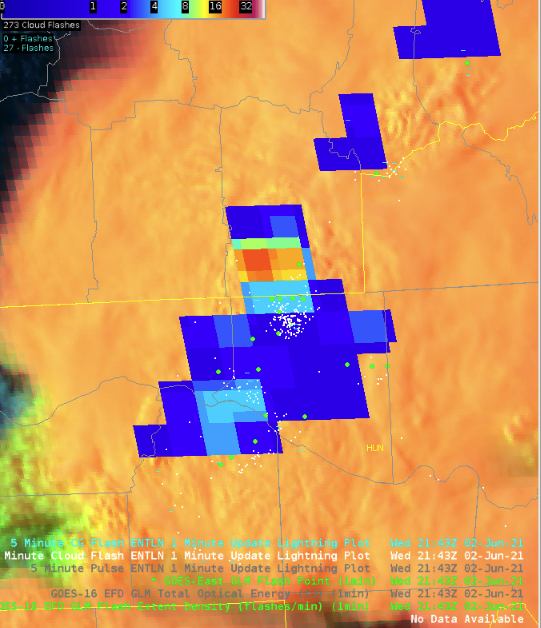
1 Minute FED overlaid with ENTLN 5 minute (1 minute update) and GM Flash Point

GLM Observation:

Saw a steady lightning jump depicted in the GLM FED correlated with a storm that NWS Huntsville issued a Severe Thunderstorm Warning on. Several mPING reports of wind damage (assuming sub-severe with no LSRs issued as of this time) which raises confidence that storms are intensifying. Perhaps the most interesting thing about this screenshot is seeing the parallax-correction in action when looking at the Flash Points.

Optical Wind:  

Still difficult to tell where you are geographically.  Suggestions to perhaps swap the lime green grid with the state outline colors.

Additionally, the time stamp gets cut off if you zoom in on the product and occasionally gets covered by the wind barbs themselves. Perhaps a floating time stamp would be better for this instance.

Time stamp for the image above.

A note about the timestamps:

The time stamps attached to the wind barbs appear to be formatted incorrectly, showing times like 21.97Z, note the actual time correctly formatted shown in the image below was actually 21:58Z.
– Groot and Dwight Schrute

NOAA-20 Pass Ahead of Severe Convection

 The San Angelo CWA was expecting severe convection in the afternoon.  There was a NOAA-20 pass over their CWA at 1927Z.  A NUCAPS Sounding in the clear air ahead of ongoing convection was chosen.  The approximate point of this sounding is shown by the white circle in the left image.  The sounding in the right image showed an environment very favorable for severe convection, including hail.  Since ongoing severe storms were heading in this direction (left image), the storms could be expected to maintain their intensity or possibly strengthen.

– Champion

GLM Flash Point Product

The GLM Flash Point is a unique addition to the GLM suite of products.  It’s parallax corrected, which is nice.  But the points seem to tell you less data per minute than the FED.  In this example there are eight points for the Sterling/Irion County storm.  However, you need to mouse over each point to get more data (flash duration and area).  By comparison, the FED quickly tells you this is an electrically active storm.  In a warning environment, with limited screen space, and where every second counts, the FED tells you a lot more very quickly than the Flash Points.


– Champion

New Mexico Severe Storm

 Radar imagery showed a storm form and rapidly strengthen over Guadalupe County, NM.  ProbSevere matched this intensity increase well.  The storm looked like it was going to become severe.  ProbSevere jumped to 60% at 2226Z, which was about a 40% increase in about 5 minutes.  Surprisingly, the 60% value was the same for ProbSevere Versions 2 and 3.  The modelers mentioned that Version 3 has lower values than what forecasters are used to seeing in Version 2.  Therefore, a 60% value for Version 3 is probably a higher threat than an identical value for Version 2.  That gave me more confidence considering this storm severe.


– Champion

Friday, June 18, 2021

Minnesota hailers

Intense storms quickly spun up in southeast Minnesota in the 23:00 to 00:00 UTC hour yesterday, eventually dropping hail with diameters up to 3 inches. The environment was highly sheared (55-60 kt) and the storms straddled a gradient of MLCAPE with values from 300 to 1100 J/kg. 

Figure 1: ProbSevere contours, MRMS MergedRef, and NWS severe weather warnings in southeast Minnesota.

ProbSevere version 3 (PSv3) produced higher probabilities of severe hail sooner than the operational version 2 for a number of these rapidly growing storms. 

The first storm, which dropped 2-inch hail west of New Prague, MN at 23:40 UTC (and later produced numerous severe hail reports near the Mississippi River), had PSv3 probabilities about 20% higher a few minutes before PSv2 did. While a few minutes might not seem like much, it can be crucial during a quickly developing situation. 

Figure 2: Time series of PSv3 and PSv2 for the development phase of a severe thunderstorm near New Prague, MN.

A second storm developing right in the wake of the first one also exhibited higher PSv3 earlier, and maintained a probability ≥ 40% before the first 1-inch report, in Belle Plaine, MN. This storm would also be long-lived and later produce numerous severe hail reports. 

Figure 2: Time series of PSv3 and PSv2 for the development phase of a severe thunderstorm near New Belle Plaine, MN.


The third highlighted storm developed west of the first two and never achieved very high MRMS MESH. However, PSv3 did attain probabilities of 30-40% before the 1-inch report in Norseland, MN, whereas PSv2 was largely under 10%. 
Figure 4: Figure 2: Time series of PSv3 and PSv2 for a severe thunderstorm southwest of Norseland, MN.

For each of these storms, increasing VIL, MergedRef, and ENI lightning density along with the very high effective bulk shear (55-60 kt) enabled PSv3 to produce more accurate guidance. PSv3 is overall much better calibrated than PSv2, meaning probabilities better match the occurrence of events (i.e., reports). In general, the optimal probability thresholds for PSv3 are between 40-60% for hail, wind, and any severe, but between 25-40% for tornado. However, users will still see differences case-to-case based on the meteorological regime they find themselves working.

Wednesday, June 16, 2021

ProbSevere v3 gives sooner "heads up" in South Carolina


Several isolated storms in South Carolina tapped into some better bulk shear, becoming better organized, as well as threatening. ProbSevere v3 (PSv3) highlighted elevated probabilities of severe before version 2 for the three storms shown here. 

Figure 1: Animation of ProbSevere, MRMS MergedRef, and NWS severe weather warnings for several storms in South Carolina yesterday afternoon.

The first storm, northwest of Myrtle Beach, SC (Figures 2 and 3), had PSv3 hovering in the 20-40% range for a while before increasing to 60% and then later to 70%. In the 50 minutes before the official NWS warning, PSv2 was mainly under 10%. The MRMS VIL (32 g/m^2), 0-3 km lapse rate (8.2 C/km) and MRMS 3-6 km AzShear were leading contributors to the PSv3 probability at 19:00 UTC, when PSv3 was about 40% and PSv2 was 8%. 

Figure 2: A storm in eastern SC that downed multiple trees.

Figure 3: PSv3 and PSv2 time series for the storm highlighted in Figure 2.


A second storm, northwest of Charleston, SC, took a while before becoming severe and dropping silver dollar-sized hail. PSv3 remained in the 30-40% range for a while (owing to a favorable environment), while PSv2 was < 10 %. The probabilities in the 30-40% range early on better conveyed the severe threat that this storm would soon exhibit. The VIL (37 g/m^2), 0-3 km lapse rate (8.8 C/km) and the satellite growth rate (moderate) were leading contributors to the enhanced probability of severe early on in this storm's lifetime.

Figure 4: A storm northwest of Charleston, SC, which dropped large hail.

Figure 5: PSv3 and PSv2 time series for the storm highlighted in Figure 4.


A third storm, which followed in the wake of the storm NW of Charleston, SC, also exhibited higher severe probabilities (in the 20-40% range) well before PSv2 latched on to it. This storm went on to produce numerous wind damage reports as well as some large hail. In a similar refrain, the VIL, low-level lapse rate, and satellite growth rate all contributed to the higher probability of severe early on (with the 3-6 km AzShear and composite reflectivity also aiding). The PSv3 models are able to find connections between the observed and environmental predictors in a more robust way, compared to PSv2. 

Figure 6: A third storm in South Carolina, producing numerous wind damage reports.
Figure 7: PSv3 and PSv2 time series for the storm highlighted in Figure 6.


Forecasters at the HWT have been able to use a time series tool in the ProbSevere AWIPSII plug-in. The more accurate ProbSevere v3 models, coupled with instant access to storms' time series history will hopefully aid forecasters in the warning decision-making process. 


ProbHail and ProbWind v3 in Florida

A slow-moving cold front converged with a sea-breeze boundary to produce some strong storms in a weakly-sheared environment. One forecaster at the HWT remarked how the ProbHail values in version 3 (PHv3) seemed more reasonable to him in this environment, compared to ProbHail version 2 (PHv2).

Figure 1: ProbSevere contours, MRMS MergedRef, and NWS severe thunderstorm warnings in the Florida panhandle. The highlighted storm produced severe wind reports

We can see that despite the favorable MESH, satellite growth rate, and thermodynamic parameters in the storm highlighted in Figure 1, PHv3 was only 11% at this time, while ProbWind v3 (PWv3) was 60%. This storm later produced multiple reports of downed trees and power lines. While ProbWind v2 correctly had high probabilities (PWv2 = 81%), PHv2 was heavily overforecasting (PHv2 = 85%). The machine-learning models in ProbSevere v3 (gradient-boosted decision trees) were able to more accurately discriminate between the wind and hail threats in this situation. For this storm, the low effective bulk shear (12 kt), high wetbulb 0C height (13.4 kft) and high PWAT (2.1 in) all detracted from the PHv3 probability. 

Several storms in the Florida panhandle did produce severe hail reports, including the storm highlighted in Figure 2. In general, PHv3 was in the 25-40% range for storms that produced hail in this environment, and perhaps could help forecasters identify hail threats compared to other storms in the area not producing hail, which had PHv3 probabilities in the 0-15% range. The higher MESH (1.5 in) and slightly better effective shear (19 kt) contributed to higher PHv3 for this storm.

Figure 2: ProbSevere contours, MRMS MergedRef, and NWS severe thunderstorm warnings in the Florida panhandle. The highlighted storm produced severe hail and wind reports.


Thursday, June 10, 2021

Northern Minnesota storms

At the 2021 HWT, one team of forecasters was working in eastern North Dakota and northern Minnesota yesterday. After monitoring a string of very weak-looking storms, a few storms finally tapped into some better deep-layer shear and overcame a capped environment.

One forecaster noted that a storm in Cass County looked severe, and while it was just outside of their county warning area, they would have warned it for 1" hail and 60-mph winds. The storm showed a small hail spike at 21:30 UTC (Figure 1). 

Figure 1: A small storm in Cass County, MN, with a hail spike. 


The team of forecasters also noted how PSv3 seemed to handle the marginally severe nature of this storm and others in the area better than PSv2, with PSv3 exhibiting higher probabilities earlier and maintaining them better than PSv2. 

Figure 2: ProbSevere contour with hover-readout and time series window, and MRMS MergedRef for the storm in Cass County. 

At 21:46, PWv3 was 49% whereas PWv2 was 11%. The MRMS VIL (30.3 kg/m^2), 0-3 km lapse rate (8.1 C/km), GOES intense convection probability (ICP; 24%), and 1-3 km mean wind were the top four contributors to the higher probability of wind for this storm


Further northwest, another storm showed a wind threat. PSv2 and PSv3 were fairly similar for this warned storm, which later produced a 61-mph wind gust near Red Lake. 15 minutes before the wind report, PSv3 achieved 67%, with the VIL, 0-3 km lapse rate, ICP, and 1-3 km mean wind contributing the most to the probability. 

Figure 3: ProbSevere contours, MRMS MergedRef, and official NWS severe weather warnings. 

Forecasters have remarked how they would use the time series feature in the ProbSevere AWIPS plug-in, if available at their offices. They also desire new enhancements, such as meteograms of more predictors and the ability to "dock" the window within a CAVE pane or tab. 


Friday, June 4, 2021

Storm on the Potomac

Moderate instability and good deep-layer shear produced a line of storms near a surface trough in northern Virginia. ProbWind v3 was handling the severe threat better than v2, with a probability of 41% vs. 3%, seven minutes before reports of trees down. PWv3 increased by over 20% at 17:00 UTC, due to increases in the MRMS VIL and 0-3 km lapse rate, with the MRMS azimuthal shears and composite reflectivity also contributing. Forecasters at the HWT have noted this week that PWv3 seems to be better calibrated to the wind threat than its predecessor.


Thursday, June 3, 2021

ProbWind in northern Alabama

At the HWT, forecasters working the warning desk in Jackson, MS noted an arc of storms in northern Alabama where ProbWind v3 was much higher than its v2 counterpart. They shared that the greater ProbWind probabilities and the fact that they received sub-severe LSRs, (~40 kt gusts) gave them more confidence that there could be severe-level reports soon. The NWS in Huntsville, AL issued a severe thunderstorm warning at 21:18 UTC and there were indeed trees down at 21:49 UTC, near Athens, AL.

Figure 1: ProbSevere v3 contours, MRMS MergedRef, and official NWS severe weather warnings for storms in northern AL.

Figure 2: ProbSevere time series for the storm highlighted in Figure 1.

ProbWind v3 produced greater and more consistent probabilities than v2 for this storm. A post-mortem analysis showed that the top-5 contributing predictors were:

  1. MRMS VIL (23.6 J/kg)
  2. 0-3 km lapse rate (7.6 C/km)
  3. MRMS 0-2 km AzShear (7 x 0.001 /s)
  4. MRMS 3-6 km AzShear (7 x 0.001 /s)
  5. ABI+GLM intense convection probability (ICP; 69%).
The ProbSevere team has been in active discussions with HWT forecasters regarding explaining and conveying model predictions in AWIPS in near-realtime.