Tuesday, May 14, 2024

Missing data


Charmander and Kilometers were watching over an event in central Tennessee and employed the lightning cast meteogram. The probability of lightning tool worked (img. 1) great for alerting the event staff to an increase in the lightning threat, providing about 45 minutes of lead time. 

I began to monitor the cell for further intensification and any chance that it could become severe. In the background of this work I was also monitoring for lightning activity from the cell. Eventually, the cell did produce lightning. Image two showed the ENTLN product pick up on a series of cloud flashes, with the GLM product showing some light lightning activity two minutes later (img. 3).  

Positive for GLM was that the latency was not an issue. What was more of an issue was that the meteogram from lightning cast never plotted the GLM data on the meteogram. If the person working the event shared the meteogram to event organizers, they would assume this was a missed event. Positive though, is that the organizers could be shown the GLM image or ground network data and be assured that their actions were not for nothing. This left us wondering why the meteogram did not show the lightning activity picked up in the vicinity?

We saw that the GLM began showing up when the main line of convection moved through the event space about an hour later than we identified it through alternate means (img. 4).


Image one: Meteogram for the Probability of Lightning product with GLM flash Density.


 Image two: GLM Data quality (upper-left), GLM Background Image (upper-right, Day cloud phase RBG overlaid with GLM Flas Density (Bottom-right), ENTLN observed lighting flashes and cloud-to-ground strikes (bottom-right).

 Image three: GLM Data quality (upper-left), GLM Background Image (upper-right), Day cloud phase RBG overlaid with GLM Flas Density (Bottom-right), ENTLN observed lighting flashes and cloud-to-ground strikes (bottom-right). 


 Image four: Meteogram for the Probability of Lightning product with GLM flash Density beginning at 15:15 local time.  


- Kilometers / Charmander

Convective Initiation Failure

 Watching a New Updraft Among ongoing Convection

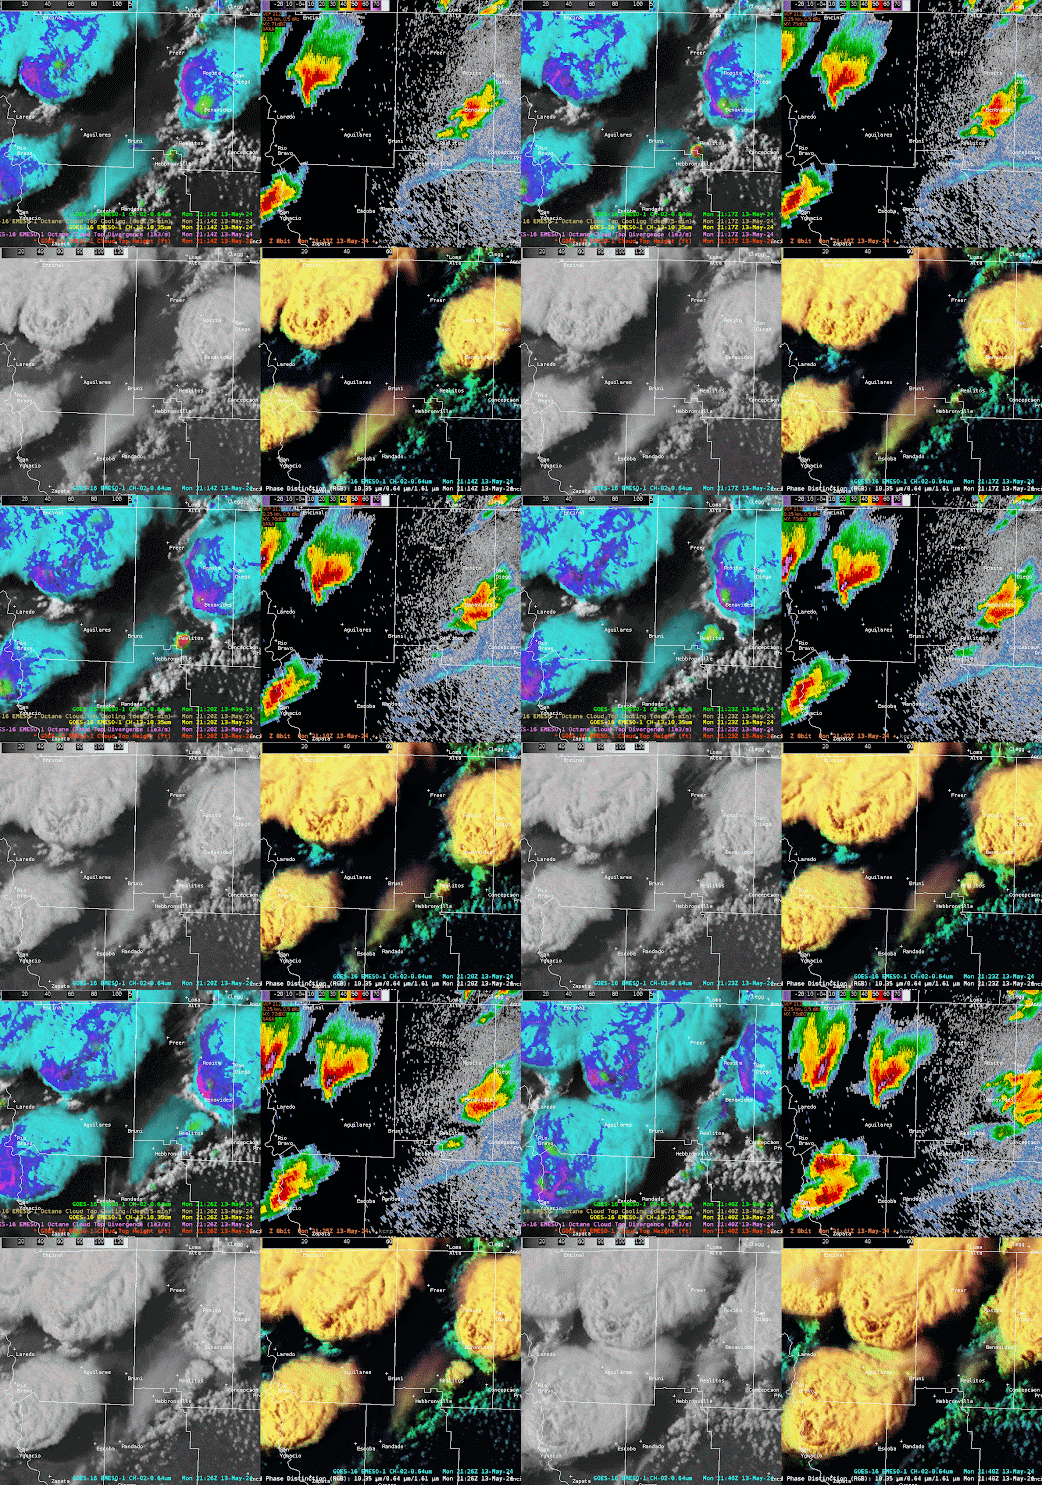
Multiple supercell thunderstorms were ongoing across South Texas along and behind a southward moving outflow boundary within a strongly unstable airmass. At 2115Z, a new updraft began to develop near Realitos, TX to the southwest of an ongoing thunderstorm.

Fig 1: Notice the cooling cloud tops in the CTC image (top right) near Realitos, TX at 2114Z. This updraft is evident in the Day Cloud Phase Distinction RGB and Visible imagery.

About 5 minutes later, the cloud top cooling peaks near Realitos. The first faint radar echo become evident to the southwest of the ongoing supercell.


Fig 2: Cloud top cooling peaks at 2119Z near Realitos. The first weak radar echo is evident to the southwest of the ongoing supercell.

At 2127Z, the cloud top cooling product indicates that cooling has significantly decreased. Meanwhile the cloud top divergence product suggests little to no meaningful divergence is occurring. This suggests that the updraft has weakened and will not likely continue to develop. The latest CRP 0.3 degree reflectivity shows an intensification of the precipitation in this area, but the satellite derived imagery suggests that this intensification on radar is temporary and the updraft will continue to weaken.


Fig 3: Cloud top cooling has decreased and no notable cloud top divergence is observed. There is still considerable "texture" in the visible and daytime RGB. Notice the increase in reflectivity to the south of the ongoing thunderstorms.

The information from the derived products suggest that this updraft will likely not develop into an additional thunderstorm near the outflow boundary. There were several minutes of lead time over radar/visible imagery gained from these derived products to indicate that the updraft would not develop fully into a new thunderstorm. An animation of the updraft sequence is shown below.


wthrman


Octane Trying with Confirmed Tornado within QLCS

Day 1:

    A NE-to-SW line of storms approaching the southern Texas/Louisiana border from the west with another W-to-E oriented line of scattered storms developing along a stationary front. The eastward moving storms starting to bow out with notch in the line starting to develop near the town of Starks, LA. Low-level rotation starting to show on SRV with a weak TDS showing up between 2115-2117Z and a stronger TDS at 2130Z. Radar starting to show what looks to be an embedded supercell within the line and several mesovortices beginning to develop just offshore along the southern half of the line. 


  2117Z
 
2130Z

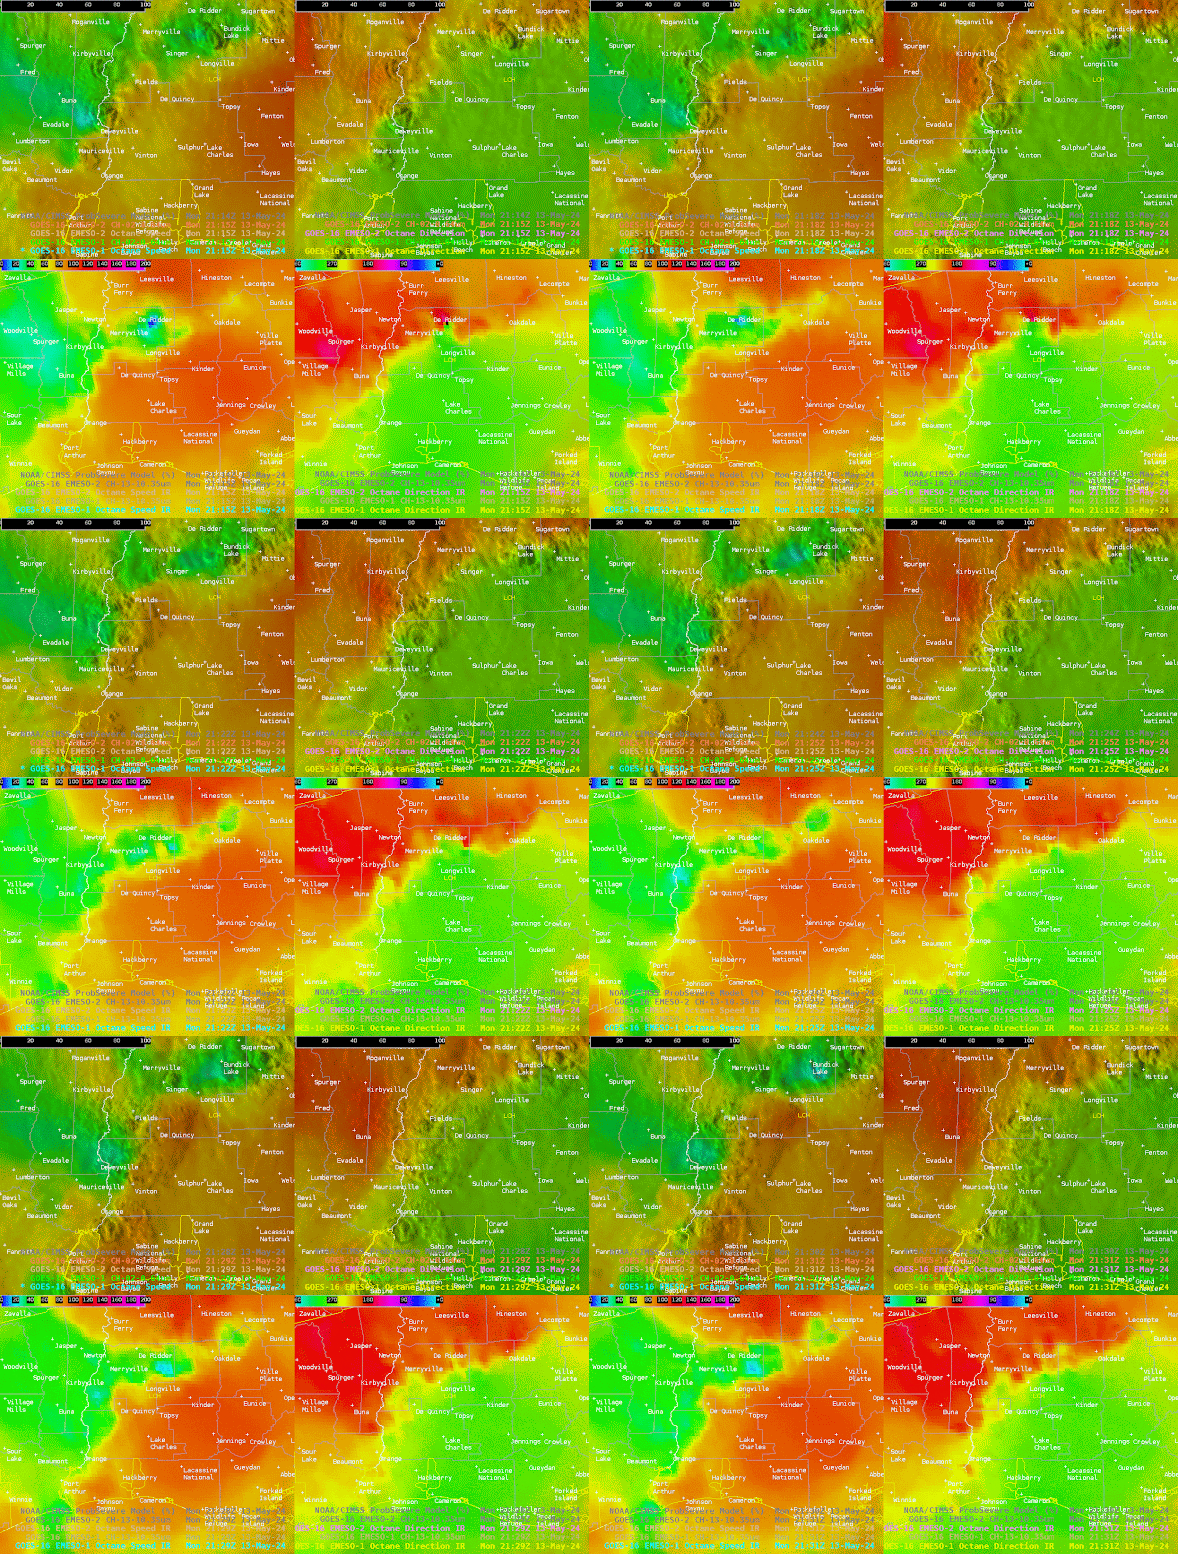
        Leading up to the development of the tornado, the Octane speed product indicated a decent speed decrease on the upshear side of the storm before tornadogenesis. The Octane speed product also showed higher speeds wrapping slightly back to the west just to the north of the main updraft. The Octane direction product also showed an interesting appendage developing just to the east of the speed min at the same time.   


        As the storm cycled, and new updraft and meso developed, another speed min and direction changed was noted. The two products again showed higher speeds bending back to the west and the northern side of the updraft and another appendage developing on the direction product. While this storm did not produce a tornado, strong wind gusts of 55-60 mph and damage was reported.


- Vera Mae

Getting in Shape

Two aspects for what constitutes operational relevance jump to mind when discussing radar imagery. The first is the shape and the second is the intensity. In the image below a line of storms is moving through central Tennessee. The GREMLIN emulated radar is doing a fine job at showing the location of the convection. Where it is still lacking some usefulness to warning operations is not having high enough DbZ returns. Even so, between the two aspects, I believe GREMLIN is resolving the more operationally useful aspect because we can use the prob-severe tool to infer strength and warn on the meso-scale analysis.


Image one: GREMLIN Emulated Radar on the left and the MRMS composite reflectivity on the right.

Image two: GREMLIN Emulated Radar on the left and the MRMS composite reflectivity on the right later in the event.


-Kilometers

Monday, May 13, 2024

Lake Charles Radar Confirmed Tornado

 An MCS resulted in a number of TDS and TVS signatures on radar near Lake Charles today. 


This one was capture to the WNW of Sulphur LA as an MCS surged east in an atmosphere that had 5000J/KG of SBCAPE. In addition to a TDS a LSR was submitted to the Lake Charles office regarding significant damage to the Walmart in Sulphur downstream of where these stills were taken. Radar was primarily used to determine that a tornado was on the ground. Looking at some of the Octane data, it was noted that this tornado formed on the leading edge of a speed minimum on the EMESO-1 Octane Speed Display. 


As the storm moved toward Lake Charles, the line segment began to bow out. Numerous reports of wind damage came in with an Semi being flipped on I-10 and a 60MPH wind gust reported by the Lake Charles ASOS. Velocity data showed a strong signal for damaging winds, and the Octane Speed Sat Display again gave us a significant gradient between speeds as the storm passed over Lake Charles. This data could be useful in verifying the potential for damaging winds, especially when storms are close to the radar. 

The Octane Sandwich display seems to be an upgrade to the Day Cloud Phase Distinction although both displays could serve different purposes, with Day Cloud being useful in watching storms develop, while Octane is useful once storms become more organized in identifying more distinct elements of the storm. 

-Charmander

Gremlins are dismantling the nebula!

 Hi everyone! 


First blog post for the Satellite Convective Applications Experiment - Week 1, let's go!

The loop below shows an example of this from the Corpus Christi, Texas. Notice the convection moving out of the frame to the northeast is bounded by prob-lightning contours (Gif 1). My desire would be to have these better matched to the storms. Right now, the contours are too nebulous.


GIF one: MRMS reflectivity at -10 C overlaid with lightning cast 60-min probability. 

Why do I care about it's nebulousness? When I am providing decision support to an event, I want to know which cell is driving the highest probability, which is building and be able to anticipate the lightning threat based on the cells movement. 

As my partner in the testbed pointed out, the anvil(s) (see image one below) were merging and this was likely causing the nebulousness. 
   Image one: GOES East Day Cloud Phase RBG channel.

Our discussion began to expand to others in the testbed and an idea emerged to try and reduce the nebulousness. The idea was to use the GREMLIN Radar Emulation product to further train the lightning cast dataset so that the probabilities become anchored by the emulated MRMS product. 

Below is a GIF of the GREMLIN and MRMS product. With the GREMLIN product using some of the same satellite features as the lightning cast; the two products have some base level of compatibility. And so my challenge to the developers of these products is, an these two be combined such that lightning cast is mapped to the convective feature causing the probability. 

GIF Two: GREMLIN Emulated Radar on the left, and MRMS composite reflectivity on the right.

-Kilometers

Thursday, May 9, 2024

Beginning of the 2024 Satellite Convective Applications Experiment

The time has come! Six months of planning and the 2024 Convective Applications Experiment begins at NOAA's Hazardous Weather Testbed in Norman, Oklahoma. Sixteen NWS forecasters will get to demonstrate five experimental products in live and archived severe weather scenarios to improve NWS severe convective warnings, impact-based decisions support services (IDSS), and enhance the transition of new technologies into operations. The schedule is as follows:

  • Week 1: 13-17 May, In-Person
  • Week 2: 20-24 May, In-Person
  • Week 3: 3-7 June, Virtual
Five products headline the testbed this year, with a mix of applications that covers mesoanalysis, convective initiation, warning issuance, IDSS support, machine learning, and even mesoscale modeling. The products are as follows:
  • GLM Background and Data Quality Product
  • GREMLIN (GOES Radar Estimation via Machine Learning to Inform NWP)
  • OCTANE (Speed, Direction, Cloud-Top Cooling and Divergence)
  • Polar Hyperspectral Soundings with Microwave and ABI data (PHS) Model
  • NOAA/CIMSS ProbSevere LightningCast
Each product will have its own tag, so you can follow along with each product (GLM-DQP, GREMLIN, OCTANE, PHS, and LightningCast) or the entire experiment at HWT2024!

Lastly WDTD is hosting R2O O2R Tales (ROOTs) webinars, formerly known as Tales from the Testbed, featuring testbed forecasters on May 17th and 24th at 11am CDT. Those interested may register here (Note: You must submit the form multiple times to register for multiple webinars).


Thank you all, and happy forecasting!
-Kevin Thiel, SPC/HWT Satellite Liaison

Wednesday, May 1, 2024

Cold front on the Plains

A potent cold front swept through the Great Plains in late April, spawning severe storms, including supercells, producing large hail, severe wind gusts, and tornadoes. 

Figure 1: Storm Prediction Center local storm reports from 12Z on 30 April to 12Z on 1 May 2024.


ProbSevere LightningCast was able to pick out developing convection along and ahead of the cold front, shown by regions of enhanced probabilities---first in eastern Nebraska, and then later in Kansas and Oklahoma. Toggle back and forth in time in the animation below to investigate model lead time to the first GLM flashes in different cells.


LightningCast is being evaluated at the HWT this spring, with some new features including:

  • better probability calibration (as a result of more training data)
  • static and on-demand lightning dashboards
  • GOES-West version trained on only GOES-18 data
  • an additional output product, the probability of ≥ 10 flashes in the next 60 minutes
The lightning dashboards are available from the LightningCast webpage for static locations such as airports and football stadiums, as well as dynamically changing locations like active wild-land fires.


The panel above shows some time series of LightningCast probabilities for the 5-min CONUS sector (red) and 1-min mesoscale sector (yellow) for Wichita Mid-Continent Airport, as storms developed and traveled over the airport. Blue dots are GLM centroid observations within 5 miles (large dots) and 10 miles (small dots) of the airport. 

A new feature being evaluated this year at HWT is the on-demand dashboard capability, whereby a NOAA user can submit location and timing information for an event that they want a dashboard for. They simply fill out this form and receive an automated email with the valid link: https://go.wisc.edu/x16m56. In this way, forecasters can get custom guidance for locations they are serving with decision support. This capability has already been used for events such as NFL games and state fairs.

Below is output from ProbSevere IntenseStormNet, which is a deep-learning model like LightningCast, but uses images of GOES-R ABI and GLM data to predict the probability of "intense" convection, from a satellite perspective. It is useful as storms are maturing. 


From the animation above, one can see how strong overshooting tops, bubbly-like texture in the cloud tops, and above-anvil cirrus plumes correspond well with stronger probabilities, which correlate well with local storm reports. IntenseStormNet works well for deep convection, day and night. Output from this model is used in ProbSevere v3, but can also be useful stand-alone severe-weather guidance in regions without radar coverage. 

Wednesday, February 28, 2024

Midwest storms...in February!

 Record-breaking high temperatures for February preceded and helped spawn storms in eastern Iowa and northern Illinois yesterday.

ProbSevere LightningCast gave a heads up on the developing convection. LightningCast uses deep-learning methods and GOES ABI data to predict the probability of lightning up to an hour in advance. LightningCast version 1 (LCv1) is being transitioned to NOAA operations in 2024. 

Development and improvement of LightningCast continues, however, based on forecaster feedback. One new product that is being evaluated at the Hazardous Weather Testbed this year is the probability of ≥ 10 fl in 60 min. Forecasters remarked that in some situations, having guidance on a more robust level of lightning would be very helpful. 

In the animation below, the P(≥ 1fl in 60 min) are depicted by contours in shades of blue (at 10%, 25%, and 50% levels). The P(≥ 10 fl in 60 min) are in red-shaded contours (10% and 25% levels).

For the three storms in Illinois, there was 13 min, 6 min, and 13 min of lead time to ≥10 flashes (when measured from the 10% contour). The storms in Iowa never got to 10 flashes, but the LightningCast probabilities only touched 25%. Users should recognize that lead time for the 10-flash product will be lower than the 1-flash product. When probabilities above 10% begin to appear (and especially above 25%), forecasters should anticipate an intensification in the lightning activity. 

Figure 1: LightningCast contours (P[≥ 1 fl] in blues, P[≥ 10 fl] in reds), GOES-16 ABI imagery, and GOES-16 GLM flash-extent density for storms in eastern Iowa and northern Illinois.


These storms developed rapidly into supercells and produced hail, severe wind gusts, and several tornadoes. ProbSevere v3 corresponded with NWS warnings quite well, even in this explosive environment. Notably, ProbTor v3 was much higher (30-45%) than ProbTor v2. While more investigation is needed to confirm this, it is likely that the HRRR model inputs in v3 were more impactful than the RAP model inputs in v2, signifying that the HRRR better depicted the environment. 


Tuesday, September 26, 2023

ProbSevere v3 for a couple of early autumn storms

ProbSevere v3 (PSv3) was able to provide an earlier heads-up and increased lead time to the initial severe hazards in several recent autumn storms on the Southern Great Plains. 

On September 23, there were a number of powerful supercells ravaging east-central Oklahoma. The storm in Figure 1 quickly split into two cells, with the right split producing 2"-diameter hail at 23:55 UTC and 3" hail at 00:15 UTC.

Figure 1: ProbSevere v3, MRMS MergedReflectivity, and NWS severe weather warnings for storms in central Oklahoma.


Figure 2: ProbSevere v3 for a storm in Pottawatomie county at 22:56 UTC.

As this supercell was developing (see Figure 2), PSv3 was 37%, whereas PSv2 was only 3%. Hail appeared to be the main threat. At this time, the very weak lightning signal (only 5 fl/min) and low MESH (0.33") were keeping the PSv2 probability very low. However, the top 5 contributing predictors in PSv3 were:

  • Lapse rate 0-3 km (8.4 C/km)
  • MLCAPE (3685 J/kg)
  • Eff. bulk shear (46 kt)
  • Sat growth rate (2.7%/min -- "moderate")
  • MRMS MESH (0.33")
ProbSevere v3, compared to v2, is more adept at extracting salient signals in the combined NWP, satellite, radar, and lightning phase space. In the developing stage of this storm, the environment and the satellite were more important than the radar predictors.  

The next evening, it was Texas's turn. One lone supercell in west Texas produced golfball-sized hail and wind reports of 59 and 62 mph (Figure 3).

Figure 3: ProbSevere v3, MRMS MergedReflectivity, and NWS severe weather warnings for a lone supercell in west Texas.


Figure 4: The storm in Figure 3, at 01:44 UTC.

ProbSevere v3 again had a jump on this storm before PSv2. At 01:44 UTC, right after the initial severe wind report, PSv3 was 55% vs. v2's 9% (Figure 4). PSv3 was showing both hail and wind as potential threats. The very weak low-level mean wind (5 kt) was keeping ProbWind v2 low (5%), and the modest flash rate and MESH, and very low hail CAPE (~250 J/kg) were combining for a ProbHail v2 of only 9%.

In contrast, the top contributors in ProbSevere v3 were the modest flash rate (18 fl/min), modest MESH (0.72"), the effective shear (47 kt), and the low-level lapse rate (8.1 C/km). PSv3 was able to integrate the marginal radar signature with favorable NWP data (from HRRR) to provide a better indication of severe probability.

Figure 5 highlights the higher probability of severe in PSv3 well before PSv2 shoots up, which was after the initial wind report. This storm later produced severe hail and another wind report.

Figure 5: Time series comparing PSv3 and PSv2 probabilities during the developing stage of the supcercell in Figures 3 and 4.