20:45Z
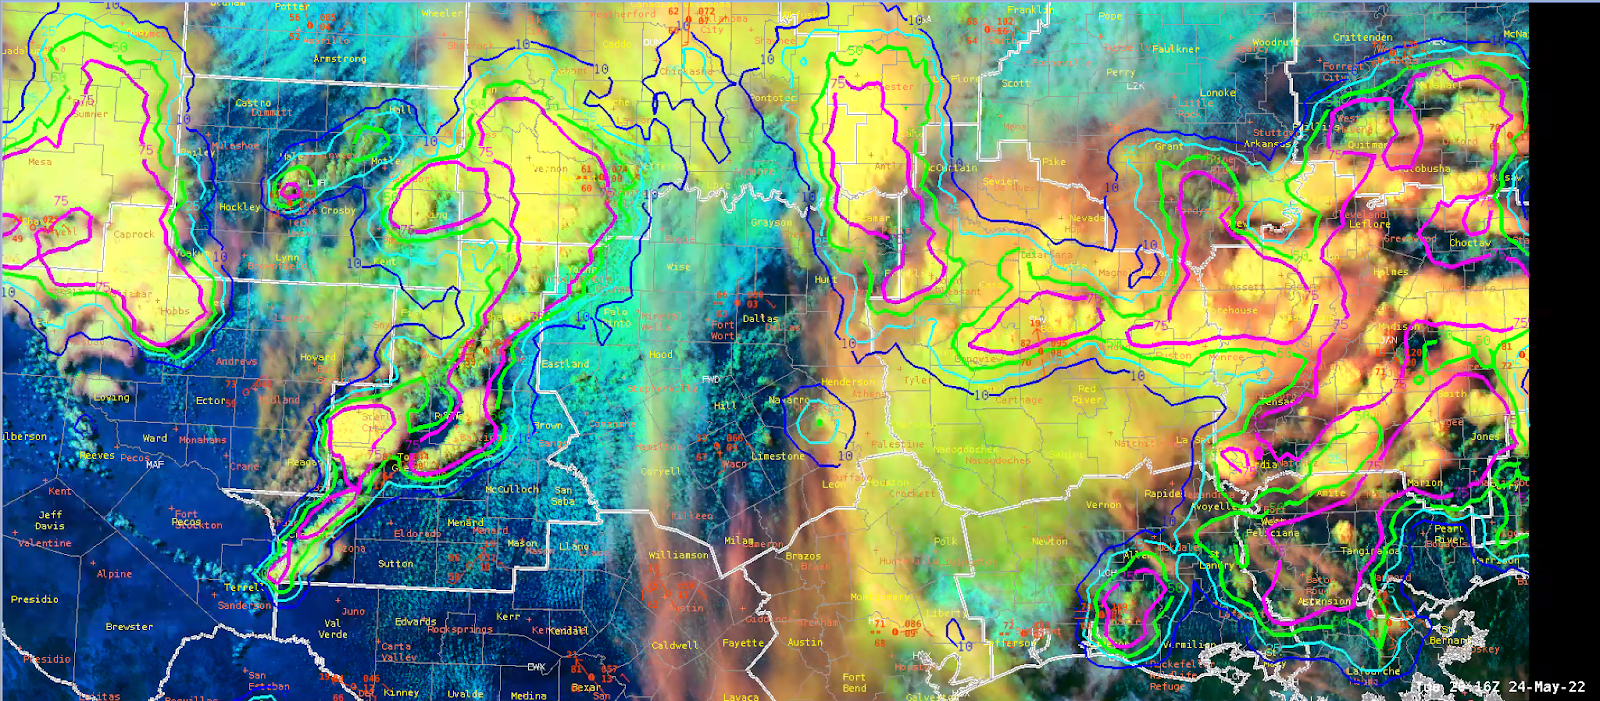
Optical Flow winds indicate a broad south-southwesterly flow at mid-levels.

Snowfan
20:45Z
Optical Flow winds indicate a broad south-southwesterly flow at mid-levels.
Snowfan
20:10Z: The PHS is showing a very unstable environment along/south of the outflow boundary, stretching southwest to northeast across the Fort Worth CWA. Temperatures are in the 80s south of the boundary with upper 60s to lower 70s dewpoints. North of this boundary, temperatures are in the lower 60s with lower 60s dewpoints.
Over time, close to 00-01Z, the boundary slides south and east toward the southern portion of the CWA, with SBCAPE over 2000 J/kg, STP values upwards of 3-5 (perhaps picking up on the better curved hodographs along the mesoscale boundary), and LI values approaching -8 to -10. The CAPE seems to match up very well with that seen on the SPC meso page. The SPC meso page had a higher STP southwest of our CWA at this time. This product helped me to focus on regions where new convection would likely form, good for situational awareness.
Snowfan
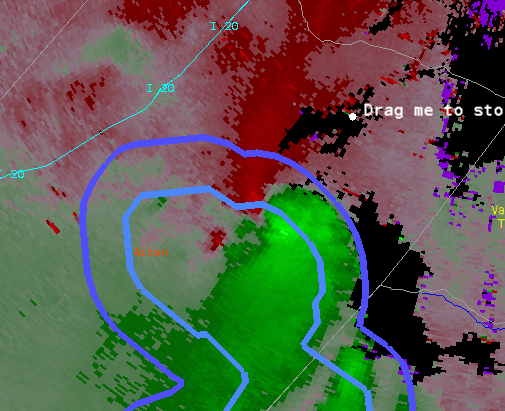
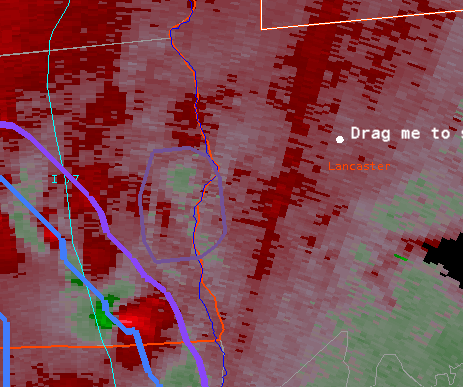
This was the lone tornado warning I issued. It was borderline but a nice MCV wrapped up after this. Likely contributed to some severe winds at times.
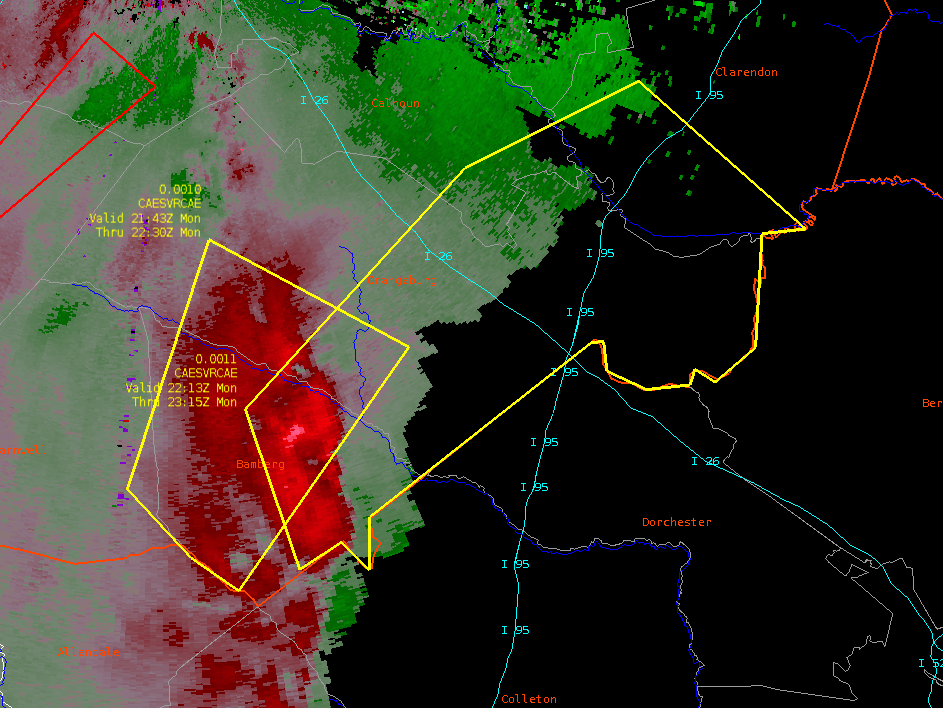
This helped lead to a warning at 2146 UTC. This cell was near our southern CWA border. This looked good for hail.
Here is the same storm a bit later when it's more of a wind threat. 40 kt winds showing up even with a poor radar angle.
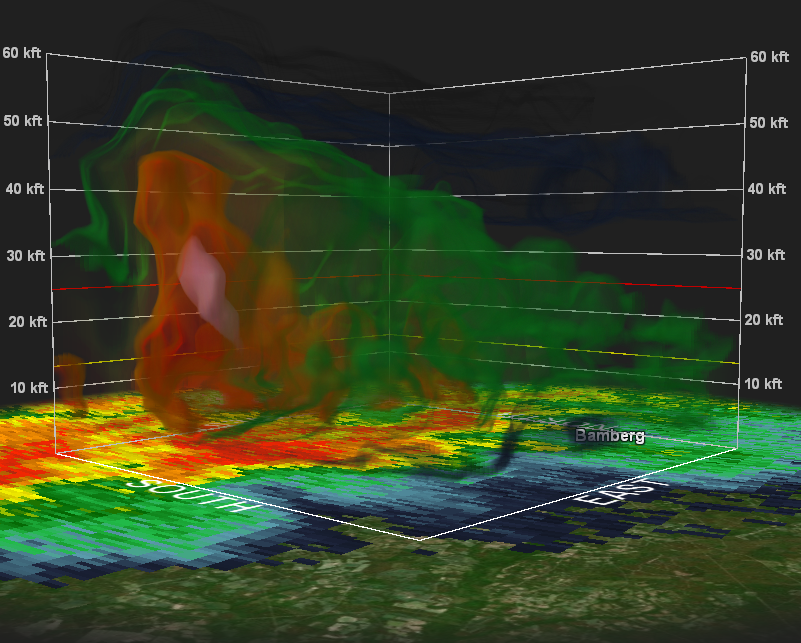
Good overshooting top with that same storm showing up nicely in the DCP.
Other notes. I liked the idea of the micro wind product but it’s too hard to read. Needs work to be usable.
One last minute tornado warning…
20:25Z
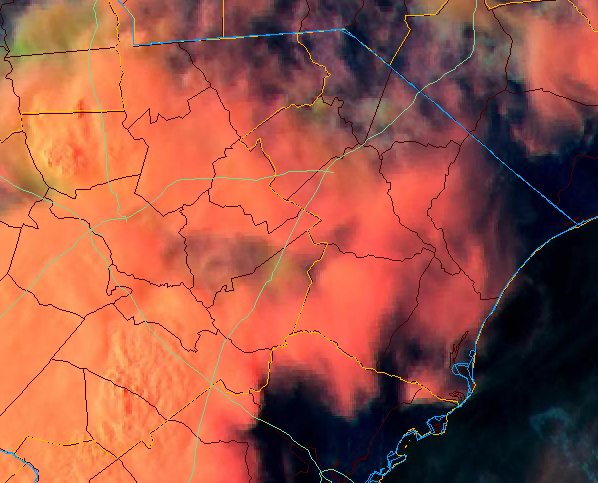
LightningCast depicts well the ongoing convection north of the CWA and moving in from the west
The deep-learning model IntenseStormNet uses only image patches of GOES-R ABI and GLM data to detect the most intense parts of storms. Specifically, it uses the 0.64-µm reflectance, 10.3-µm brightness temperatures, and the GLM flash-extent density. In this way, IntenseStormNet tries to holistically use spatial patterns and textures to predict the probability of intense storms from a purely satellite perspective. Figure 1 shows the output of IntenseStormNet for several supercell or supercell-like storms in Texas. Notice how the model predicts high probabilities in areas of cold cloud tops, bubbly cloud-top texture, and strong overshooting tops.
 |
| Figure 2: ProbSevere contours, MRMS MergedRef, and NWS severe weather warnings for two supercells in Texas during the HWT. The outer contours are colored by the probability of tornado. The time series window is for the rightmost storm. |
A slew of storms entered Midland's CWA. Both forecasters in Midland noted how ProbSevere v3 probabilities seem to better match their own subjective threat levels for hazards. This right-moving storm in Figure 1 has a probability of severe of 66%, compared to 34% in v2. It later dropped golfball-sized hail.
One forecaster working this office said he likes how ProbSevere integrates and quantifies their own internal thought process to make objective and consistent guidance for warning decision-making.
 |
| Figure 1: ProbSevere contours, MRMS MergedRef, and NWS severe weather warnings for a storm entering Texas. |
Day 2 of the HWT has forecasters working in Midland, San Angelo, and Dallas/Fort Worth, Texas. The forecasters in DFW are also working a DSS event (PGA event in Fort Worth).
Storms are getting started along a dryline and other boundaries in south Texas (Figure 1). LightningCast picked up on these regions pretty well, with lead-times of 15, 25, and 60 minutes from the 50% threshold, for three different cells.
 |
| Figure 1: LightningCast contours, GOES-16 day cloud convection RGB (1-minute meso scan), and GOES-16 GLM flash-extent density over south Texas. |
Today marks the beginning of the 2022 GOES-R Proving Ground Spring Experiment at the HWT! Forecasters will get acquainted with products today in the Lubbock, TX and Columbia, SC county warning areas.
ProbSevere LightningCast is one product being evaluated this month. LightningCast provides probabilistic next-hour lightning guidance using deep learning and GOES-R ABI data. It aims to provide objective, quantitative guidance for convective initiation, maintenance, and decay. For the HWT, the data are supported in AWIPS as contours of probability (Figure 1).
 |
| Figure 1: LightningCast contours, GOES-16 GLM flash-extent density, and GOES-16 Meso2-sector day-cloud RGB, over south Texas. |
ProbSevere v3 (PSv3) is also being evaluated for the second consecutive year. PSv3 utilizes gradient-boosted decision trees for its ML engine, enabling better use of all of the pertinent data available to forecasters, distilling the fire hose of data into actionable information.
Last Friday, Gaylord, MI was struck by an EF-3 tornado (see more details here). ProbSevere had it tracked well over Lake Michigan and into the lower Michigan (Figure 2). This week is looking quieter, so hopefully we won't see any tornadoes with major damage.
 |
| Figure 2: ProbSevere contours, MRMS MergedRef, and NWS severe weather warnings for storms in lower Michigan. |
 |
| Figure 3: The Gaylord EF-3 tornado with ProbSevere v3 time series window. |
A supercell quickly developed on the southern flank of an arc of storms in central Texas on Tuesday, April 12. High CAPE (≥ 3000 J/kg), effective shear (≥ 50 kt) and effective SRH (≥ 170 J/kg) all contributed to an elevated probability of tornado from ProbTor v3 (PTv3) by 22:00Z. About 30 minutes later, the supercell produced an EF-3 tornado west of Salado and south of Killeen, TX.
 |
| Figure 1: ProbSevere contours, MRMS MergedReflectivity, and NWS severe weather warnings in central Texas. The storm that produced the EF-3 tornado traveled south of Killeen, Texas. |
In the critical early stages of storm development, PTv3 probabilities exceeded PTv2 probabilities, which is noteworthy given PTv3's better-calibrated guidance. From Figure 2, we see that prior to the initial NWS tornado warning, PTv3 was consistently 10-20% greater than PTv2. Because PTv3 is better calibrated than PTv2 (i.e., probability value better match tornado occurrence), PTv3 will rarely exceed 60%, whereas PTv2 regularly hits 80-90% (but PTv2 over-predicts in that range).
 |
| Figure 2: Time series of PTv3 and PTv2 for the tornadic storm west of Salado, TX. |
At 22:14Z, PTv3 = 30%, while PTv2 = 7%. In a post-mortem analysis, we found that the MESH, mid-level azimuthal shear, and effective bulk shear were the top-3 contributing predictors. The 4th leading predictor was the probability of intense convection produced by the ProbSevere IntenseStormNet. A rapid increase in this value from 29% to 99% occurred from 21:52Z to 22:14Z (see "ICP" in the meteograms). IntenseStormNet is a GOES-ABI and GOES-GLM-based convolutional neural network, which picked up an a developing cold-U signature and increasing lighting to produce a very high probability of "intense" convection (see the animation below). In this way, it provides a holistic method of leveraging important values, textures, and spatial features found in geostationary imagery. In ProbSevere v3 models, IntenseStormNet computes one value per storm per time step, which is used as a predictor.
Figure 3: Intense convection probability contours overlaid GOES-16 "sandwich" imagery from a 1-min mesoscale scan. Note the rapidly developing supercell on the south flank of the developed convection.ProbSevere v3 infuses spatially important satellite information into its predictions. This example shows that forecasters should pay especially close attention to developing storms when PTv3 is exceeding PTv2.
An energetic short-wave and attendant surface low rapidly intensified on April 12th, bringing quickly developing storms to a number of regions in the Midwest U.S. Large hail, severe wind gusts, and potent tornadoes were reported from Wisconsin to Texas.
 |
| Figure 1: SPC categorical outlook at 06 verification. |
 |
| Figure 2: ProbSevere storm-based contours, MRMS MergedReflectivity, and NWS severe weather warnings for a storm in Wisconsin. |
 |
| Figure 3: An animation of ProbSevere contours, MRMS MergedReflectivity, and NWS severe weather warnings for a tornadic storm in Iowa |
 |
| Figure 4: ProbSevere contours, MRMS MergedReflectivity, and NWS severe weather warnings for a tornadic storm in Iowa. The ProbSevere time series window can be activated by double-clicking inside a storm object. |
 |
| Figure 5: ProbSevere contours, MRMS MergedReflectivity, and NWS severe weather warnings for a cold front from Iowa to Kansas. |